Streaming Kubernetes Objects from the API Server
Starting with version 5.9 you can stream all the changes from the Kubernetes API server to Splunk. That is useful if you
want to monitor all changes for the Workloads or ConfigMaps in Splunk. Or you want to recreate a Kubernetes Dashboard
experience in Splunk. With the default configuration we don't forward any objects from the API Server except events.
Configuration
In the ConfigMap configuration for the collectorforkubernetes you can add additional sections for the 004-addon.conf,
in the example below we will forward all objects every 10 minutes (refresh) and stream all changes right away for the
Pods, Deployments and ConfigMaps.
1 2 3 4 5 6 7 8 9 10 11 12 13 14 15 16 17 18 19 20 21 22 23 24 25 26 27 28 29 30 31 32 33 34 35 36 37 38 39 40 41 42 43 44 45 46 47 48 49 50 51 52 53 54 55 56 57 58 59 60 61 62 63 64 65 66 67 68 69 70 71 72 73 | [input.kubernetes_watch::pods] # disable events disabled = false # Set the timeout for how often watch request should refresh the whole list refresh = 10m apiVersion = v1 kind = pod namespace = # override type type = kubernetes_objects # specify Splunk index index = # set output (splunk or devnull, default is [general]defaultOutput) output = # exclude managed fields from the metadata excludeManagedFields = true [input.kubernetes_watch::deployments] # disable events disabled = false # Set the timeout for how often watch request should refresh the whole list refresh = 10m apiVersion = apps/v1 kind = Deployment namespace = # override type type = kubernetes_objects # specify Splunk index index = # set output (splunk or devnull, default is [general]defaultOutput) output = # exclude managed fields from the metadata excludeManagedFields = true [input.kubernetes_watch::configmap] # disable events disabled = false # Set the timeout for how often watch request should refresh the whole list refresh = 10m apiVersion = v1 kind = ConfigMap namespace = # override type type = kubernetes_objects # specify Splunk index index = # set output (splunk or devnull, default is [general]defaultOutput) output = # exclude managed fields from the metadata excludeManagedFields = true |
If you need to stream other kind of objects, you can find the list of available in the Kubernetes API reference.
You need to find the correct apiVersion and kind. All the object kinds with the group core should have a apiVersion v1.
Other groups, like apps, should have an apiVersion apps/v1. You can also specify a namespace, if you want to forward
objects only from a specific namespace.
Modifying objects
Available in collectorforkubernetes:5.19+
In case if you want to hide sensitive information or remove some properties from the objects before streaming them to Splunk
you can use modifyValues. modifier in the ConfigMap.
As an example, if you add ability for Collectord to query Secrets from Kubernetes API (you need to add secrets under
resources for collectorforkubernetes ClusterRole, see below), you can define a new input
[input.kubernetes_watch::secrets]
disabled = false
refresh = 10m
apiVersion = v1
kind = Secret
namespace =
type = kubernetes_objects
index =
output =
excludeManagedFields = true
# hash all fields before sending them to Splunk
modifyValues.object.data.* = hash:sha256
# remove annotations like last-applied-configuration not to expose values by accident
modifyValues.object.metadata.annotations.kubectl* = remove
In that case all the values for keys under object.data will be hashed, and annotations that starts with kubectl removed
(this is a special case to remove last-applied-configuration annotation, which can expose those secrets).
The syntax of modifyValues. is simple, everything that goes after is a path with a simple glob pattern where * can
be in the beginning of the path property or the end. The value can be a function remove or hash:{hash_function},
the list of hash functions is the same that can be applied with annotations.
Filtering objects
Available in collectorforkubernetes:5.21+
If you want to filter objects based on the namespaces, you can configure under a specific input as following
[input.kubernetes_watch::pods]
# You can exclude events by namespace with blacklist or whitelist only required namespaces
# blacklist.kubernetes_namespace = ^namespace0$
# whitelist.kubernetes_namespace = ^((namespace1)|(namespace2))$
For example, you can tell Collectord to stream all the pods except the ones from the namespace0 namespace
[input.kubernetes_watch::pods]
blacklist.kubernetes_namespace = ^namespace0$
Or stream only the pods from the namespace1 and namespace2 namespaces.
[input.kubernetes_watch::pods]
whitelist.kubernetes_namespace = ^((namespace1)|(namespace2))$
ClusterRole rules
Please check the collectorforkubernetes.yaml configuration with the list of apiGroups and resources that collectord has access to.
In the example above we request streaming of the ConfigMaps, that we don't give access in our default configuration.
To be able to stream this type of objects, we need to add an additional resource to the ClusterRole
1 2 3 4 5 6 7 8 9 10 11 12 13 14 15 16 17 18 19 20 21 22 23 24 25 26 27 28 29 30 31 32 33 34 35 36 37 38 39 40 41 42 43 44 | apiVersion: rbac.authorization.k8s.io/v1 kind: ClusterRole metadata: labels: app: collectorforkubernetes name: collectorforkubernetes rules: - apiGroups: - "" - apps - batch - extensions - monitoring.coreos.com - etcd.database.coreos.com - vault.security.coreos.com resources: - alertmanagers - cronjobs - daemonsets - deployments - endpoints - events - jobs - namespaces - nodes - nodes/proxy - pods - prometheuses - replicasets - replicationcontrollers - scheduledjobs - services - statefulsets - vaultservices - etcdclusters - configmaps verbs: - get - list - watch - nonResourceURLs: - /metrics verbs: - get |
Applying the changes
After you make changes to the ConfigMap and ClusterRole recreate or restart the addon Pod (the pod with the name similar to
collectorforkubernetes-addon-XXX. You can just delete this pod and Deployment will recreate it for you.
Searching the data
With the configuration in the example above, the collectord will resend all the objects every 10 minutes, and stream all
the changes right away. If you are planning to run the join command or populate the lookups, make sure that your
search command covers more than refresh interval, you can use for example 12 minutes.
The source name
By default the source will be in the format /kubernetes/{namespace}/{apiVersion}/{kind}, where namespace is the namespace
that is used to make a request (from the configuration, not the actual namespace of the object), and apiVersion and kind
also from the configuration, that makes the API request to the API Server.
Attached fields
With the events we attach also kubernetes_namespace and kubernetes_node_labels, that will help you to find the objects
from the right namespace or from the right cluster (if the node labels has a cluster label).
Event format
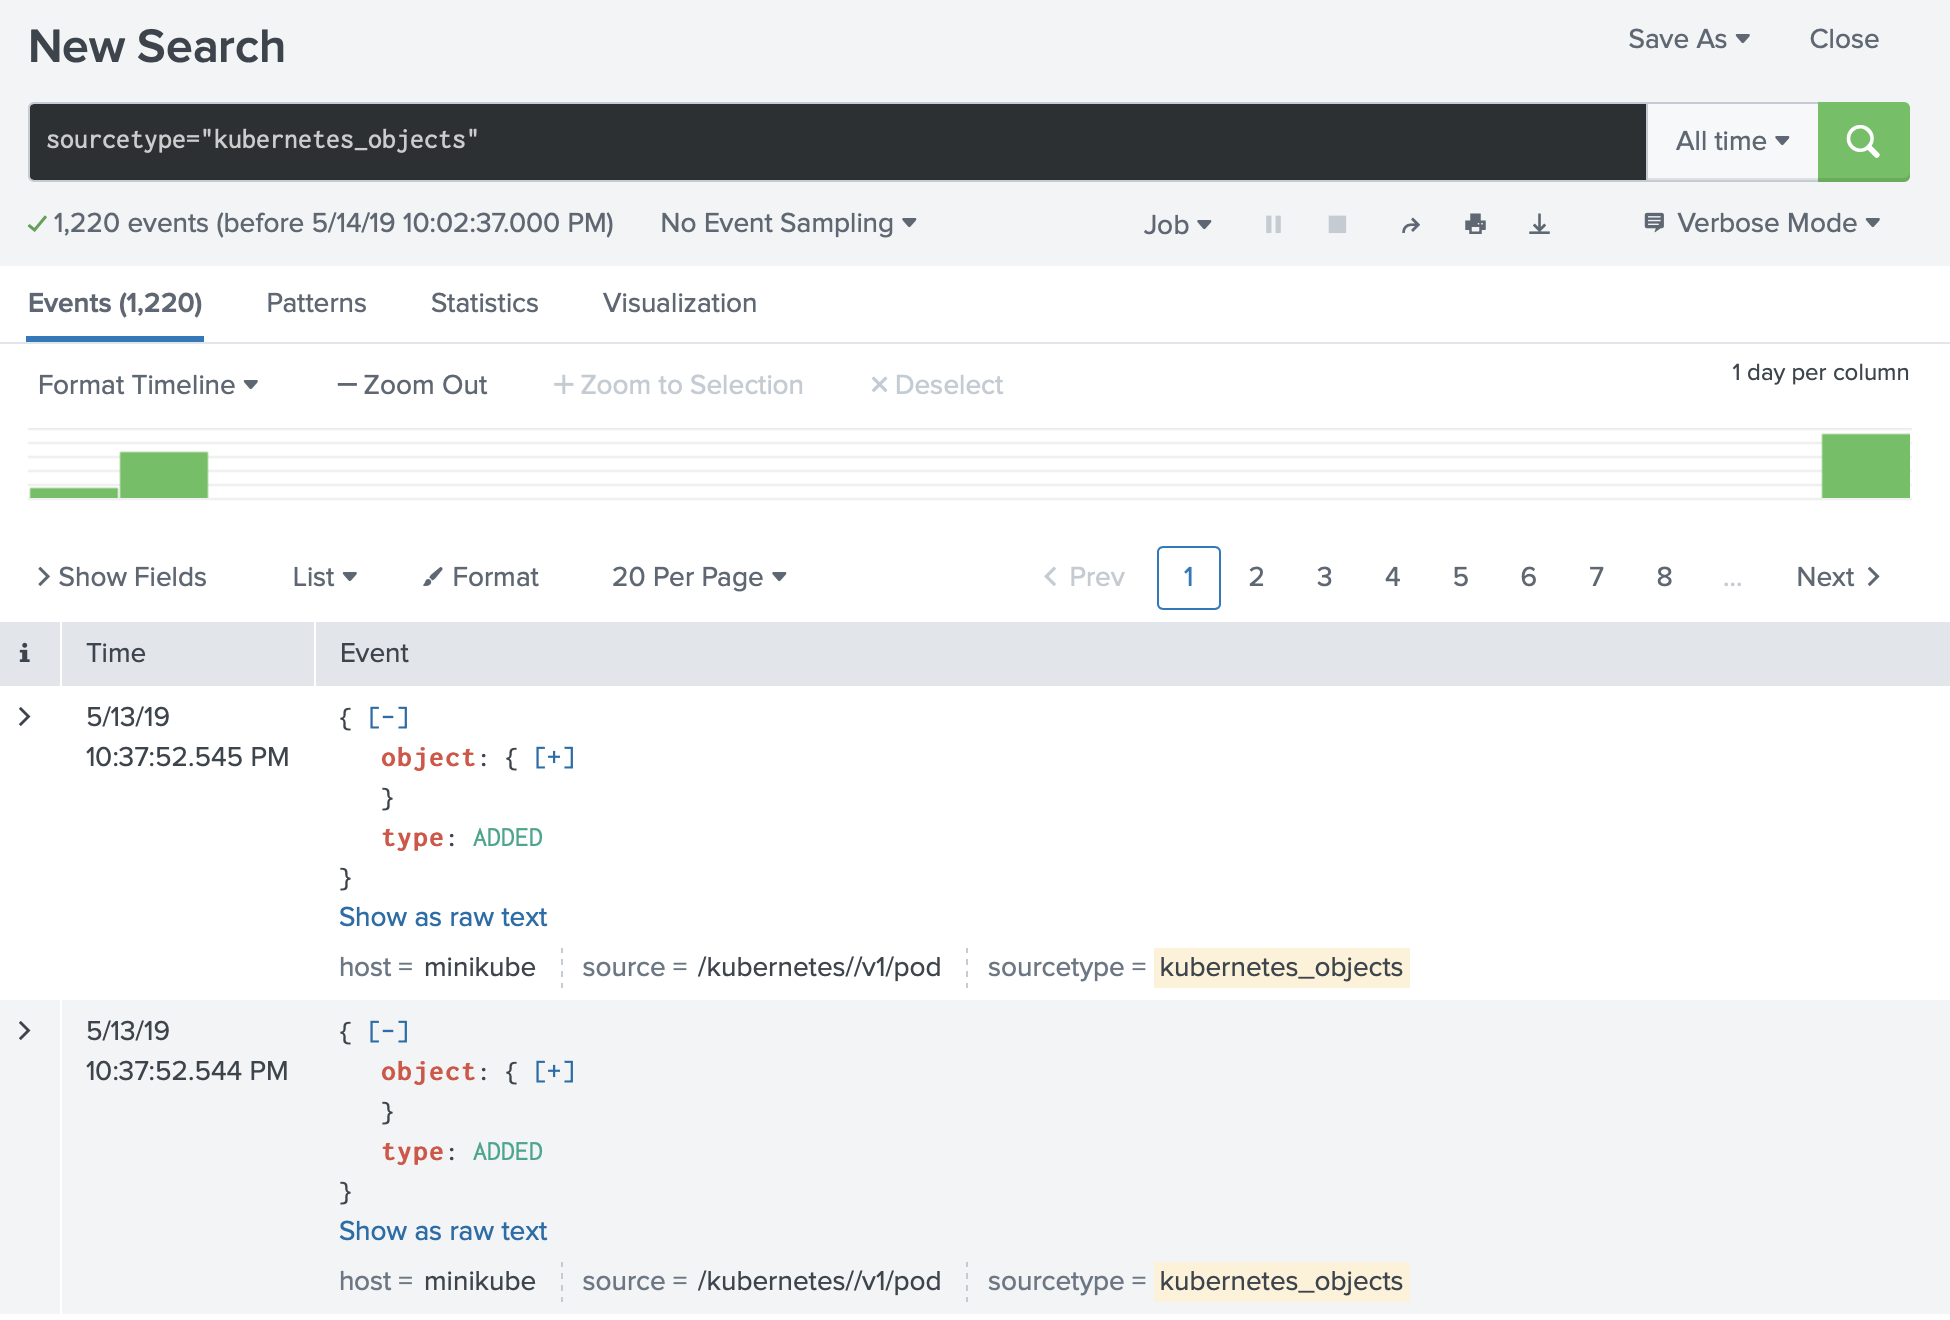
We forward objects wrapped in the watch object, which means that every event has an object field and the type (ADDED, MODIFIED or DELETED).

Searching the data
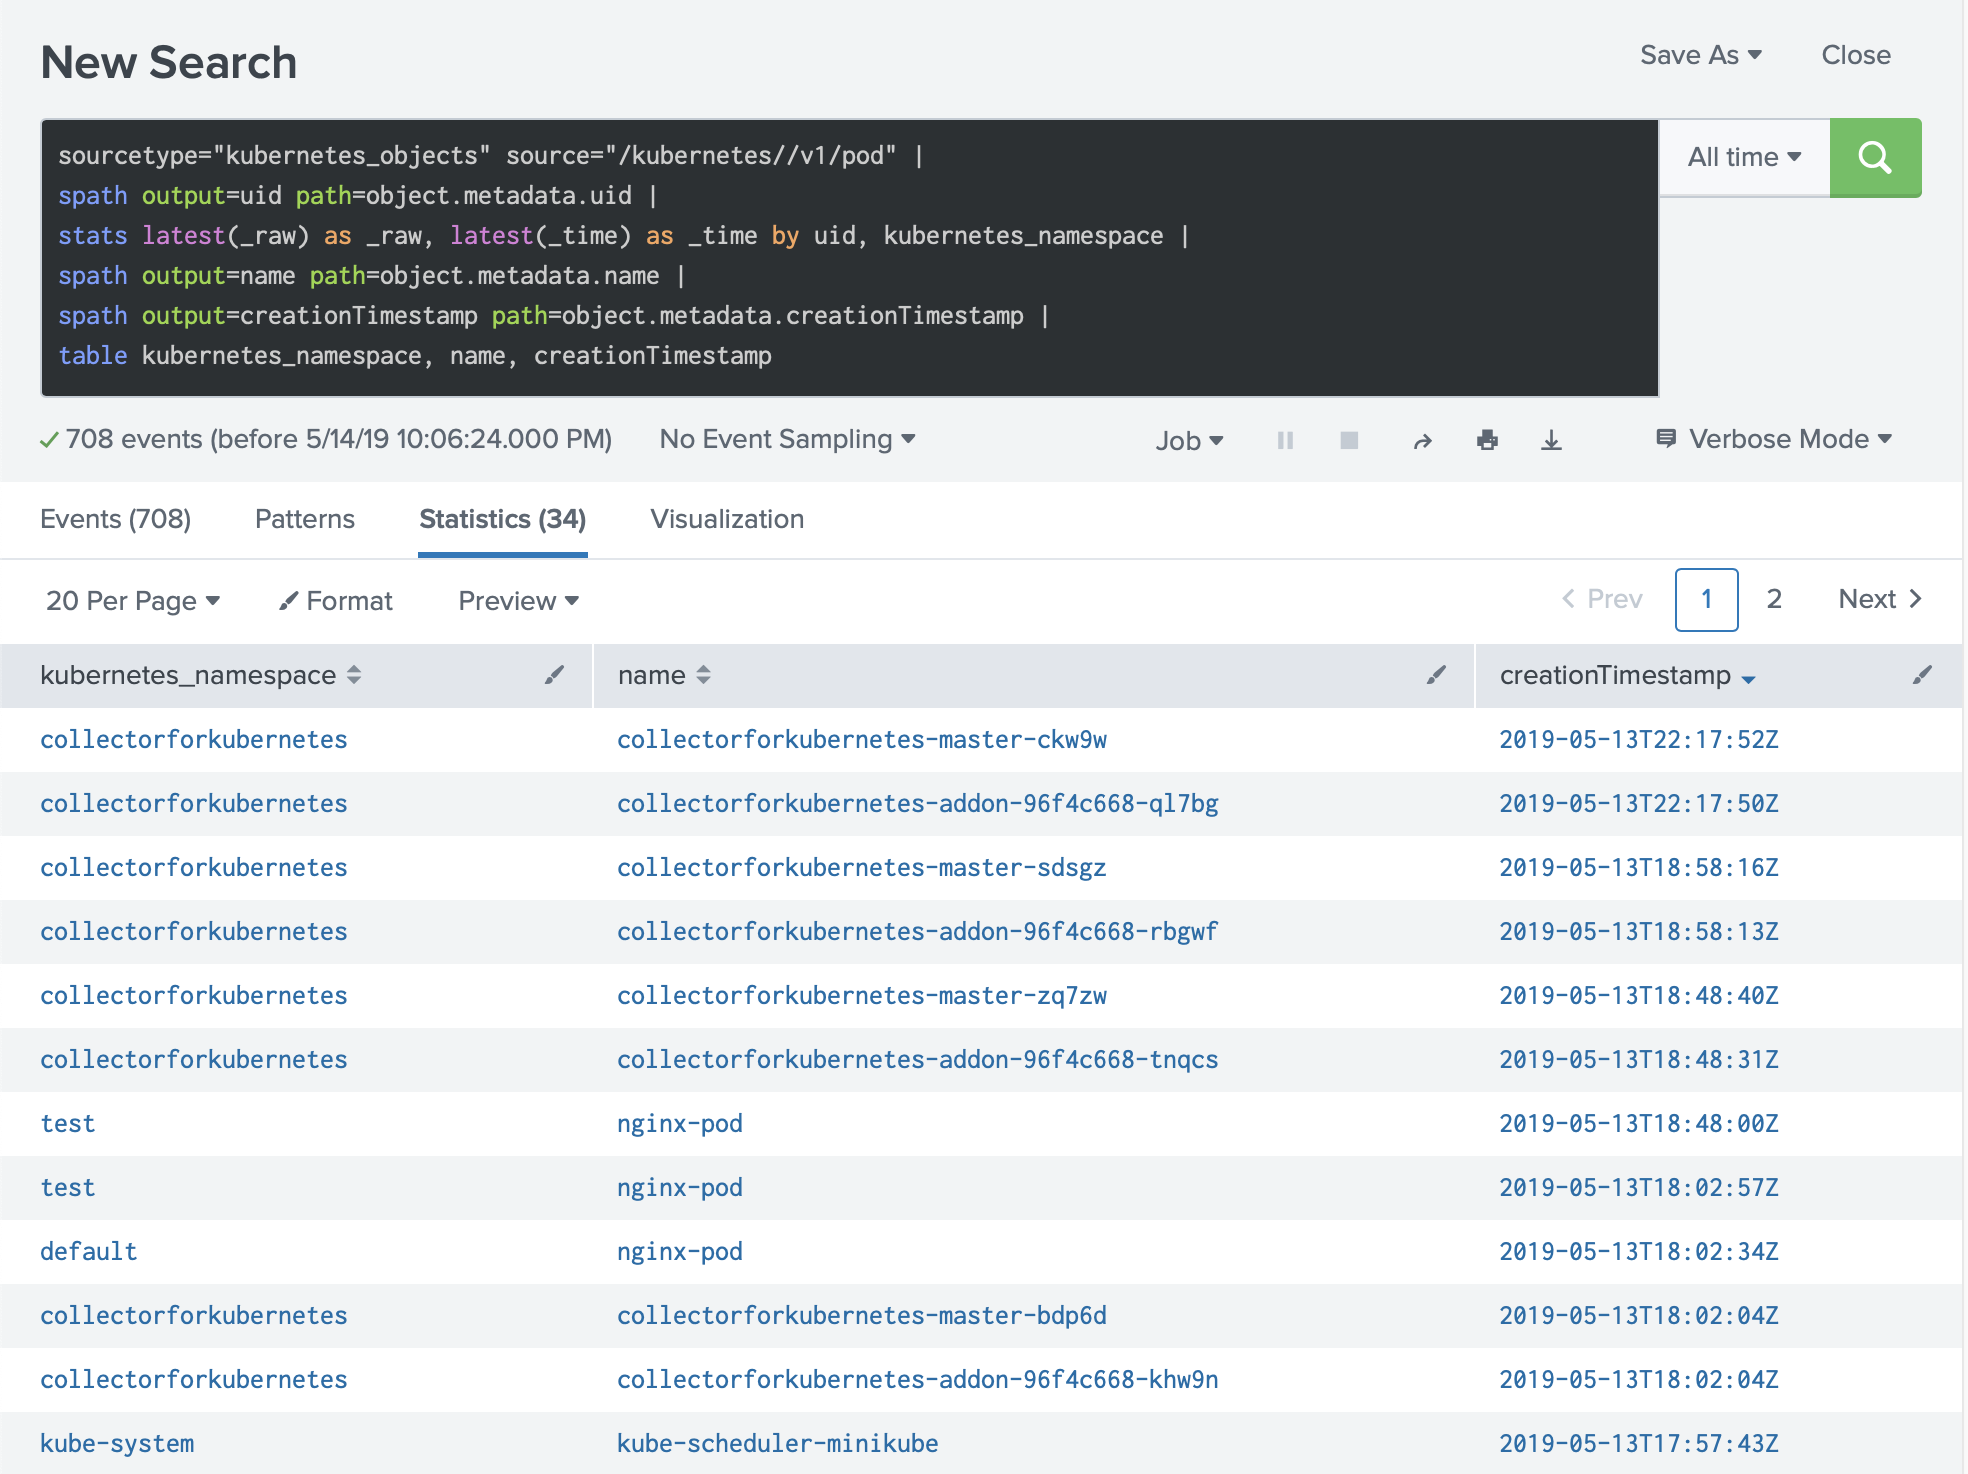
Considering that in the same time frame you can have the same object more than once (as an example if the object has been modified several times in 10 minutes), you need to group the objects by the unique identifier.
sourcetype="kubernetes_objects" source="/kubernetes//v1/pod" |
spath output=uid path=object.metadata.uid |
stats latest(_raw) as _raw, latest(_time) as _time by uid, kubernetes_namespace |
spath output=name path=object.metadata.name |
spath output=creationTimestamp path=object.metadata.creationTimestamp |
table kubernetes_namespace, name, creationTimestamp

Example. Extracting limits
More complicated example how to extract container limits and requests (CPU, Memory and GPU)
sourcetype="kubernetes_objects" source="/kubernetes//v1/pod" |
spath output=uid path=object.metadata.uid |
stats latest(_raw) as _raw, latest(_time) as _time by uid, kubernetes_namespace |
spath output=pod_name path=object.metadata.name |
spath output=containers path=object.spec.containers{} |
mvexpand containers |
spath output=container_name path=name input=containers  |
spath output=limits_cpu path=resources.limits.cpu input=containers |
spath output=requests_cpu path=resources.requests.cpu input=containers |
spath output=limits_memory path=resources.limits.memory input=containers |
spath output=requests_memory path=resources.requests.memory input=containers |
spath output=limits_gpu path=resources.limits.nvidia.com/gpu input=containers |
spath output=requests_gpu path=resources.requests.nvidia.com/gpu input=containers |
table kubernetes_namespace, pod_name, container_name, limits_cpu, requests_cpu, limits_memory, requests_memory, limits_gpu, requests_gpu
Links
-
Installation
- Start monitoring your Kubernetes environments in under 10 minutes.
- Automatically forward host, container and application logs.
- Test our solution with the embedded 30 days evaluation license.
-
Collector Configuration
- Collector configuration reference.
-
Annotations
- Changing index, source, sourcetype for namespaces, workloads and pods.
- Forwarding application logs.
- Multi-line container logs.
- Fields extraction for application and container logs (including timestamp extractions).
- Hiding sensitive data, stripping terminal escape codes and colors.
- Forwarding Prometheus metrics from Pods.
-
Audit Logs
- Configure audit logs.
- Forwarding audit logs.
-
Prometheus metrics
- Collect metrics from control plane (etcd cluster, API server, kubelet, scheduler, controller).
- Configure collector to forward metrics from the services in Prometheus format.
-
Configuring Splunk Indexes
- Using not default HTTP Event Collector index.
- Configure the Splunk application to use not searchable by default indexes.
-
Splunk fields extraction for container logs
- Configure search-time fields extractions for container logs.
- Container logs source pattern.
-
Configurations for Splunk HTTP Event Collector
- Configure multiple HTTP Event Collector endpoints for Load Balancing and Fail-overs.
- Secure HTTP Event Collector endpoint.
- Configure the Proxy for HTTP Event Collector endpoint.
-
Monitoring multiple clusters
- Learn how you can monitor multiple clusters.
- Learn how to set up ACL in Splunk.
-
Streaming Kubernetes Objects from the API Server
- Learn how you can stream all changes from the Kubernetes API Server.
- Stream changes and objects from Kubernetes API Server, including Pods, Deployments or ConfigMaps.
-
License Server
- Learn how you can configure remote License URL for Collectord.
- Monitoring GPU
- Alerts
- Troubleshooting
- Release History
- Upgrade instructions
- Security
- FAQ and the common questions
- License agreement
- Pricing
- Contact


