Kubernetes, OpenShift, Docker and AWS, in Splunk
Monitor Kubernetes, OpenShift and Docker with Collectord and our Splunk apps. Query Kubernetes and AWS live from the search bar, with nothing to ingest. Hand the investigation to an AI agent that works with your own Splunk permissions. For Splunk Enterprise and Splunk Cloud.
Products
Monitoring
Forward everything, keep the history
Collectord forwards container, host and application logs, metrics and events to Splunk. The apps bring the dashboards and alerts to use them.
Also for Linux and Windows containers, and forwarding to Elasticsearch and OpenSearch or QRadar.
Live search
Ask the live API what is true right now
Search apps that query Kubernetes and AWS from the Splunk search bar, across every cluster, account and region you register. Nothing to ingest, no extra index storage.
They complement the monitoring apps: ingestion for history, the live API for what is true right now.
AI agent
Put your own model to work in Splunk
An agent that profiles your data, writes and verifies SPL, and builds dashboards and alerts that wait for your approval. Every action runs with the user's own Splunk permissions.
Works with OpenAI, Anthropic, Azure OpenAI, AWS Bedrock, or a local model behind an OpenAI-compatible endpoint.
- Downloads from SplunkBase
- 40,000
- Installations of our applications
- 2,000
- Pulls of our images
- 30 million
Monitoring, powered by Collectord
Monitoring OpenShift, Kubernetes and Docker in Splunk Enterprise and Splunk Cloud

With a 10-minute setup you have a complete monitoring platform: log aggregation, performance and system metrics, control plane and application metrics, network activity dashboards, and proactive alerts for cluster and application performance issues. Collectord discovers and forwards container, host and application logs, and transforms them on the way - removing sensitive information before it is forwarded, and cutting licensing cost by forwarding only the data you need.
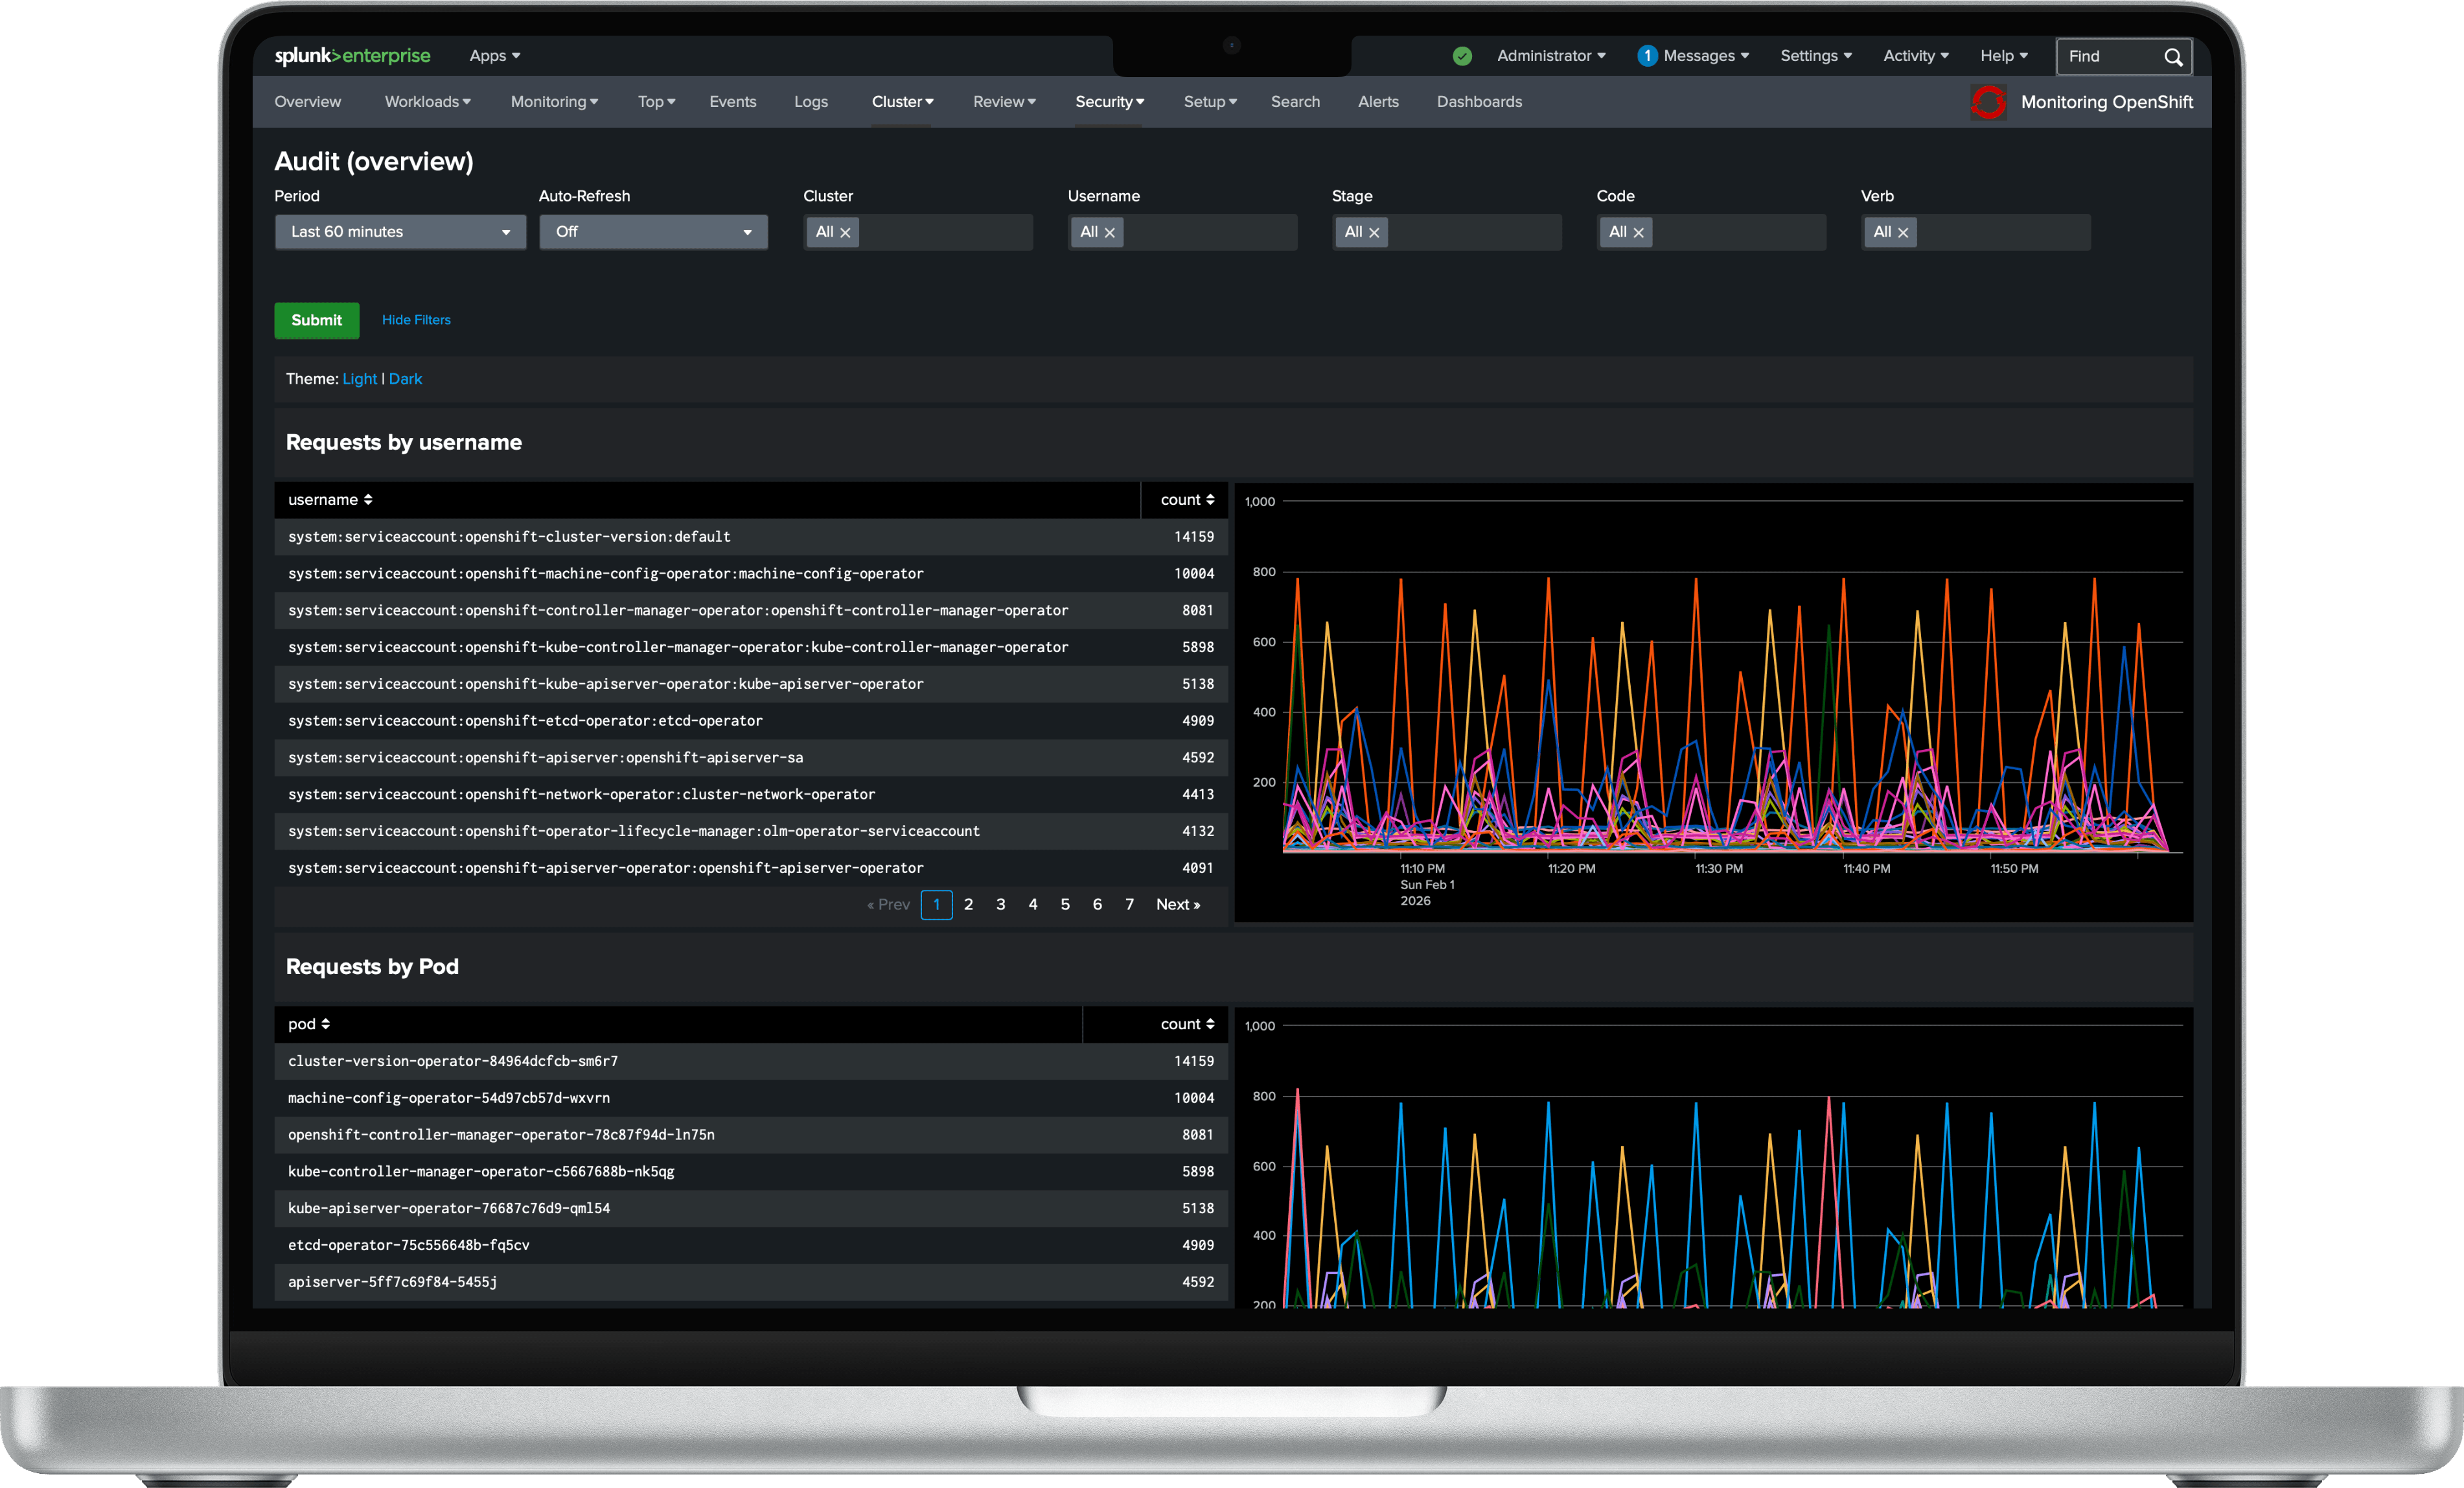
- Application Performance Monitoring.
- Gain comprehensive visibility into container and process performance with detailed metrics including CPU, memory, disk I/O, and security insights. Forward application-specific metrics in Prometheus format and leverage pre-built Splunk dashboards for immediate operational intelligence and faster mean time to resolution (MTTR).
- Enterprise Log Aggregation.
- Centralize logs from containers, applications, and servers with filtering and enrichment. Use flexible mappings to filter logs enriched with container metadata, correlate logs with metrics, and leverage advanced Splunk analytics. Collectord transforms logs before forwarding, automatically removes sensitive information and PII data for GDPR compliance, and reduces licensing and storage costs by up to 60% through data selection.
- Proactive Cluster Health Monitoring.
- Prevent downtime with comprehensive cluster diagnostics through historical event analysis, resource allocation monitoring, and capacity management. Deploy production-ready alerts for cluster health monitoring with zero configuration required - ensuring 99.9% uptime from day one.
- Enterprise Security and Compliance.
- Implement granular access controls by clusters, namespaces, pods, or containers to meet enterprise security requirements. Monitor network activities within clusters and external connections for threat detection. Automatically identify containers with elevated security permissions and maintain comprehensive audit trails for compliance reporting and deployment change tracking.
- Accelerate developer productivity and reduce operational overhead.
- Eliminate tool sprawl with a unified platform for log and metrics collection that developers actually want to use. Through simple annotations, development teams can customize data presentation in log aggregation tools, specify multiline log patterns, remove terminal escape codes, and override types, sources, and indexes - reducing operational overhead by 40% while accelerating development cycles.
- One agent, more platforms and destinations.
- The same Collectord also monitors Linux hosts and Windows containers, and forwards Kubernetes logs to Elasticsearch and OpenSearch or to QRadar over syslog.
Powered by
Our monitoring solutions are powered by Collectord, enterprise-grade container-native software built by Outcold Solutions that delivers comprehensive capabilities for discovering, transforming, and forwarding logs, collecting system metrics, gathering control plane metrics from orchestration frameworks, and monitoring network activity. Collectord provides flexible and powerful tools for log transformation, enabling you to protect sensitive information by filtering it from log lines before forwarding. Reduce your licensing costs by up to 60% with Collectord's data filtering - choose exactly which data to forward from log streams. Collectord seamlessly forwards container logs, host logs, and automatically discovers logs from containerized applications.
Live search, with nothing to ingest
Query your clusters and your cloud live, from the Splunk search bar
Ingestion is for history; the live API is for what is true right now. The search apps call the Kubernetes and AWS APIs from SPL, across every cluster, account and region you register - no agent to deploy, nothing to ingest, no extra index storage. Both install on a search head, on Splunk Enterprise and Splunk Cloud.
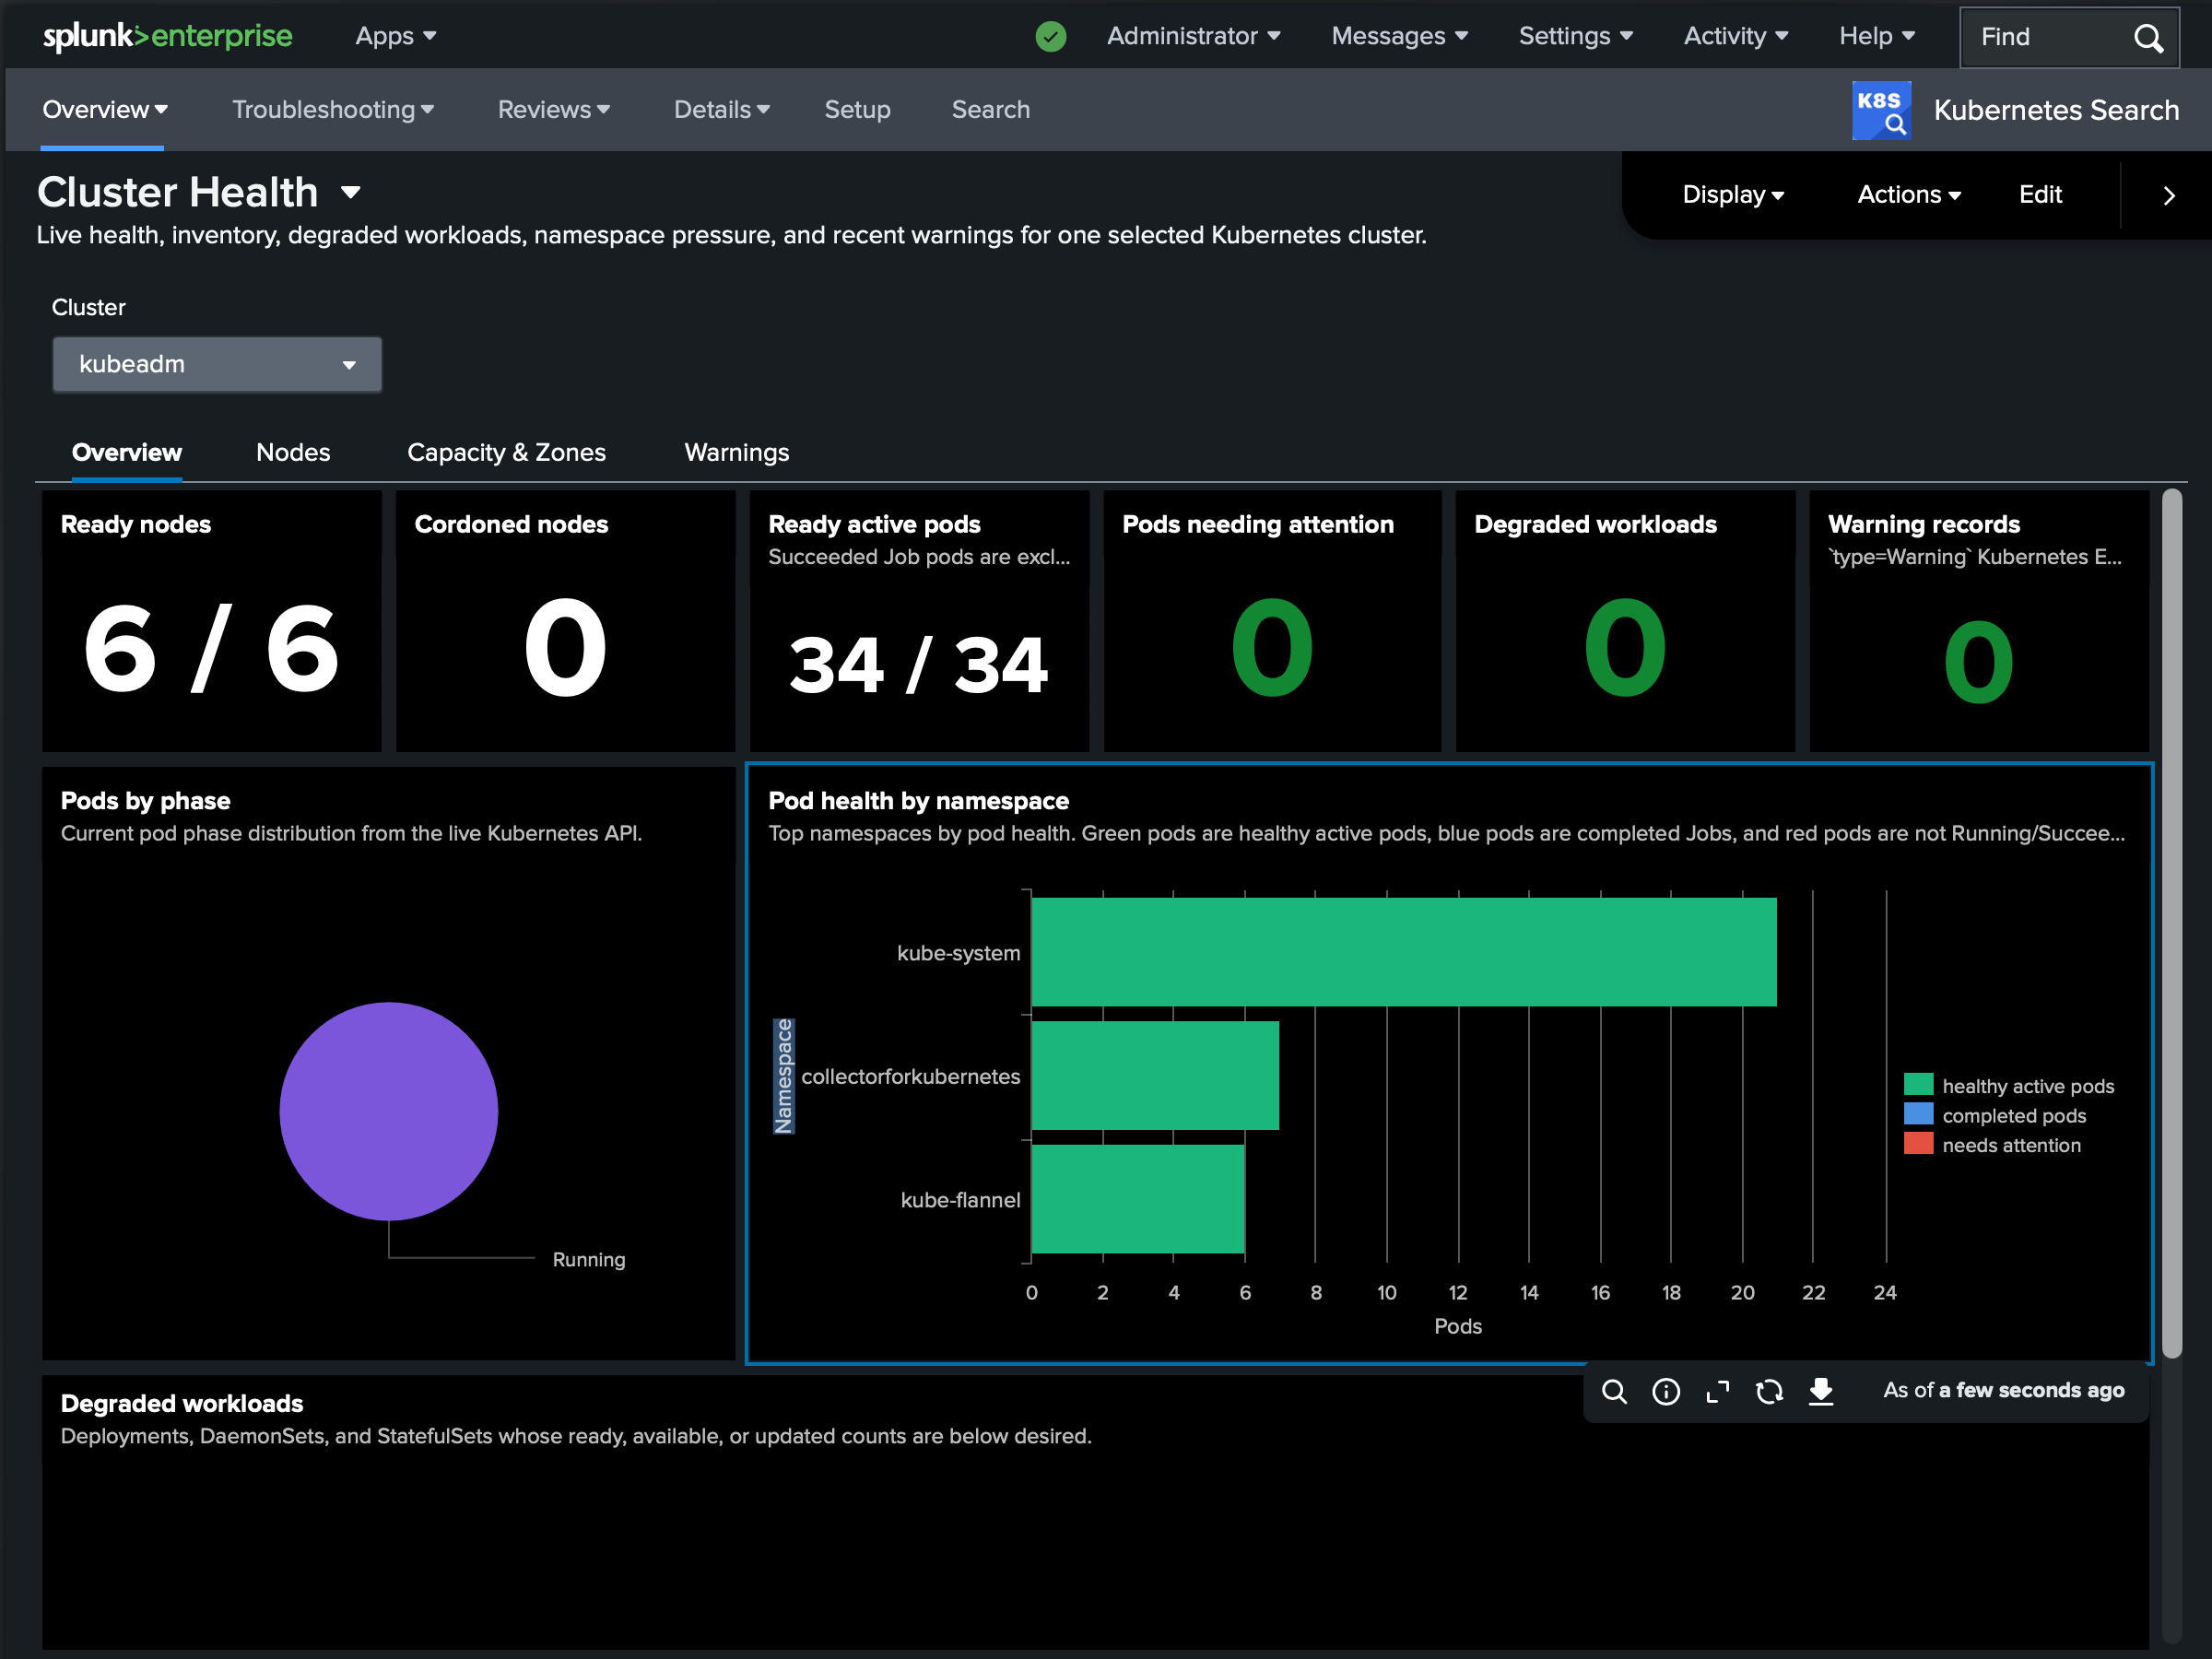
Kubernetes Search
Run kubectl-style queries against the live Kubernetes API without leaving Splunk - list resources, stream pod logs, read events, and describe objects across every cluster you register. No agent in the cluster, no ingestion, no extra index storage.
Search for AWS
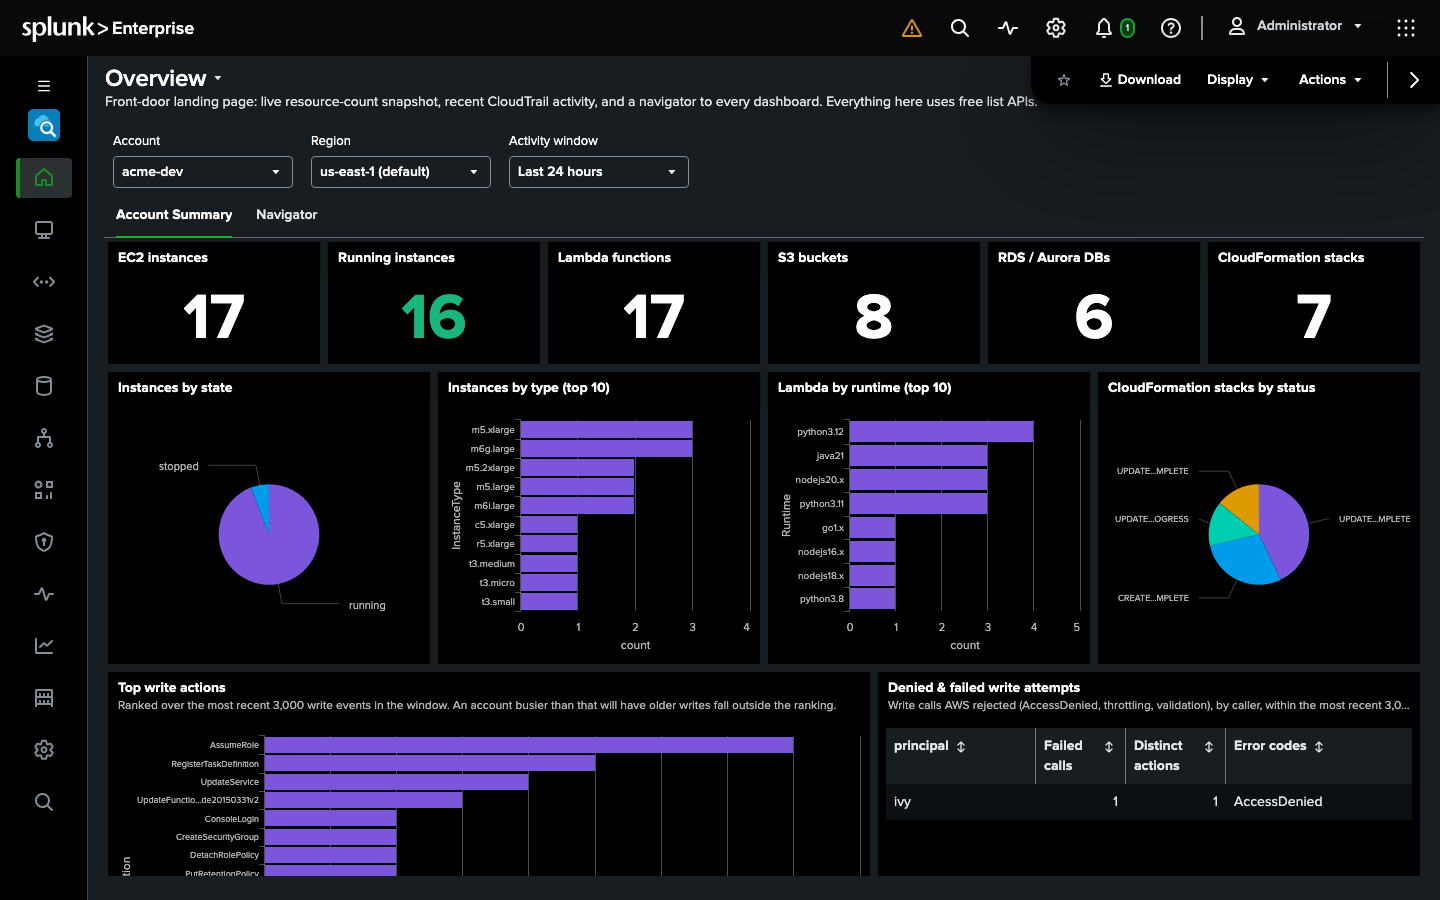
Query your AWS estate live from the search bar: list resources of any kind over Cloud Control, tail CloudWatch logs and chart CloudWatch metrics, look up CloudTrail events, run Athena queries, and pull Cost Explorer data across every account and region you register. No ingestion, no index storage, and one dashboard per AWS service, grouped the way the AWS console groups them.
AI agent
Bring your own LLM to Splunk, and put it to work with your approval
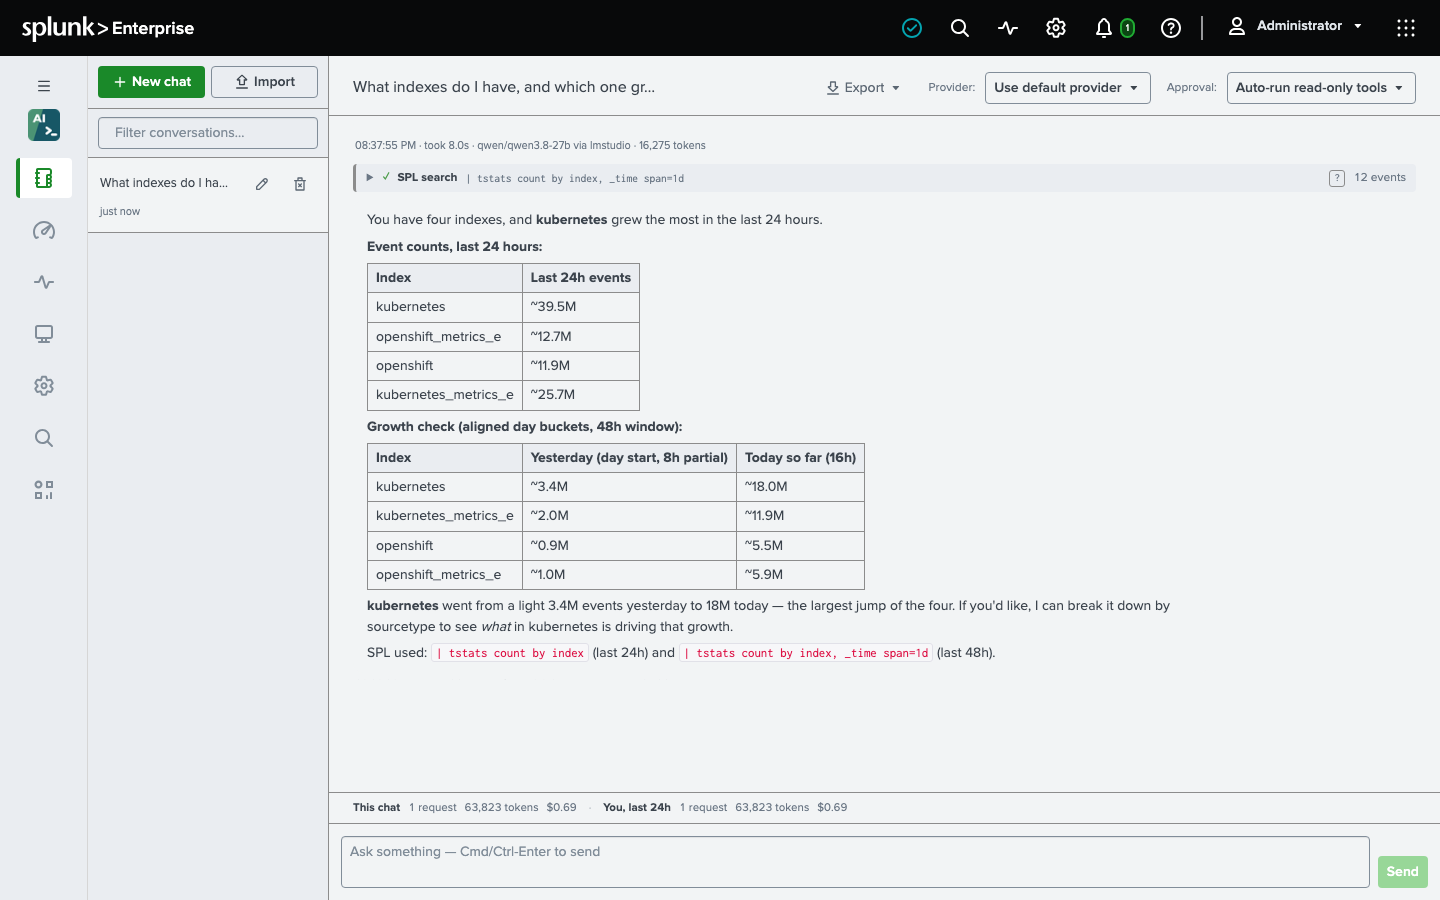
OS AI Agent is a vendor-agnostic assistant that runs inside Splunk. Point it at the model you already pay for, and it profiles your data, writes and verifies SPL, reads your macros and data models, and builds dashboards and alerts.
- Your model.
- OpenAI, Anthropic, Azure OpenAI, AWS Bedrock, or a local model behind an OpenAI-compatible endpoint.
- Your approval.
- Dashboards and alerts it builds pause for your approval before anything is written.
- Your permissions.
- Every action runs with the calling user's own Splunk permissions.
- Chat, SPL, or unattended.
- Chat with it, call it from SPL, or let it investigate an alert while nobody is watching.
- No telemetry.
- Only what you send the provider leaves your environment, and licensing is enforced offline.
Testimonials
Trusted by hundreds of customers worldwide since 2017.
“Outcold Solutions helped us reduce our Splunk licensing costs by 50% while improving our monitoring capabilities. The deployment was seamless and their support team is exceptional.”
“The best container monitoring solution we've evaluated. Installation took literally 5 minutes and we had full visibility into our Kubernetes clusters immediately.”
“Outstanding product quality and world-class support. Outcold Solutions has been instrumental in our digital transformation journey.”
“Their Red Hat certified OpenShift solution gave us the confidence to deploy in production immediately. The security and compliance features are exactly what enterprise customers need.”
“Support is exceptional. The team is responsive, knowledgeable, and always willing to go the extra mile to ensure our success. Instant connection with the team of experts. Helped us to solve issues not only with their product but also with our infrastructure, including Kubernetes and Splunk deployments.”
Success Stories
Global Logistics Leader Streamlines Container Migration
A leading international logistics corporation with operations in over 220 countries faced significant challenges when migrating their Java applications from traditional VMs to Kubernetes and OpenShift clusters. Their Java applications had established configurations for writing logs to specific directories, and redirecting these logs to container stdout was problematic and resource-intensive.
- Solution:
- Using Collectord's volume monitoring capabilities and annotation system, the company maintained their existing logging patterns without code changes. By implementing annotations to automatically discover and forward logs from various directories, they achieved a seamless transition to containerized environments.
- Results:
- The company successfully migrated 200+ applications to containers without disrupting their logging workflows. Development teams maintained familiar logging practices while operations gained enhanced visibility. Deployment times decreased by 40% by eliminating the need for custom log forwarding configurations.
Telecommunications Giant Solves Multi-Team Log Management
A major telecommunications enterprise with numerous development teams struggled with directing logs to the appropriate Splunk outputs and indexes. With over 50 teams running containerized applications, each team required different Splunk indices and output configurations to meet compliance requirements.
- Solution:
- Implementing Collectord's annotation-based configuration system allowed the company to decentralize log management configuration while maintaining central governance. Teams could independently specify their required Splunk outputs and indexes through Kubernetes annotations without requiring infrastructure team intervention.
- Results:
- The organization reduced configuration ticket volume by 85% and accelerated application deployment cycles by 3 days on average. Security compliance improved as teams gained precise control over data routing while the central platform team maintained oversight.
Financial Institution Seamlessly Migrates Between Logging Platforms
A large financial services company had invested heavily in container monitoring with Splunk but needed to migrate to ElasticSearch for strategic reasons. They were concerned about disrupting their existing monitoring workflows and losing the benefits of their annotation-based log configuration system.
- Solution:
- Leveraging Collectord's platform-agnostic architecture, the company was able to reconfigure their output destination from Splunk to ElasticSearch while maintaining their existing annotation system for log extraction, field mapping, and sensitive data filtering.
- Results:
- The organization completed their logging platform migration with zero changes to application configurations. Development teams continued using the same annotation patterns they were already familiar with, and the migration was transparent to end users. The company saved an estimated 2,000 hours of reconfiguration work.
Banking Corporation Implements Granular Resource Controls
A multinational banking corporation providing infrastructure-as-a-service to internal teams faced challenges with "noisy neighbor" applications overwhelming their logging infrastructure. Certain teams were generating excessive log volumes that impacted performance for everyone.
- Solution:
- Using Collectord's advanced throttling capabilities, the infrastructure team implemented project and namespace-specific quotas on log volume. The annotation-based configuration allowed precise control over which applications and teams were subject to specific throughput limits.
- Results:
- Log ingestion became predictable and manageable, preventing service degradation during peak loads. The bank was able to implement fair usage policies while providing flexibility for teams with legitimate high-volume needs. Overall system reliability improved by 99.8%, and infrastructure costs decreased by 30% through elimination of overprovisioning.
Quick Links
Monitoring
Monitoring Kubernetes
Monitoring OpenShift
Monitoring Docker
Live search
Kubernetes Search
Search for AWS
AI agent
OS AI Agent
Subscribe to our newsletter to stay up-to-date with product releases
About Outcold Solutions
Outcold Solutions builds applications for Splunk Enterprise and Splunk Cloud. Our certified monitoring solutions, powered by Collectord, bring logs, metrics and events from Kubernetes, OpenShift and Docker clusters, Linux hosts and Windows containers into Splunk, with the dashboards and alerts that help developers watch their applications and operators keep their clusters healthy. Our search apps query Kubernetes and AWS live from the search bar, with nothing to ingest, and OS AI Agent puts the model you choose to work inside Splunk, with each user's own permissions. Since 2017 we have been helping businesses keep what they need to answer complex questions about their infrastructure in one place.