Blog
Monitoring OpenShift in Splunk: integration with Web Console
Today we are open-sourcing a Node.js application openshift-webconsole-integration. This application allows you to integrate OpenShift web console with Splunk. It embeds two links in the OpenShift Web Console. The first link gives you the ability to navigate to the Pod or Workload dashboard, where you can review the performance of the containers, review network activity and see the logs. The second link navigates you directly to search where you can start working with the logs from this specific workload or pod.
[UPDATE (2018-11-02)] Switched to version
v1.1.0, that usesnodejs:8by default, to make this app compatible with OpenShift Console version below3.11.
[UPDATE (2019-08-07)] Switched to version
v1.2.0, which allows you to override the application name from the defaultmonitoringopenshift.
[UPDATE (2021-02-10)] For OpenShift 4.x look at Integrating OpenShift Web Console 4.x with Monitoring OpenShift application in Splunk
Two examples of how the navigation works. In this example we can navigate directly to the ReplicationController monitoring dashboard and see all the metrics, network activity and the logs from all the Pods scheduled with this ReplicationController.
In the second example, we navigate directly to the Splunk search page, where we already have a predefined filter that shows us logs only from this replication controller.
Installation
You can find detailed installation instructions at README.md.
We assume that you already installed Monitoring OpenShift application and collectorforopenshift.
Switch to the collectorforopenshift project, if you want this application to run in the same project, like all our other
workloads.
1oc project collectorforopenshiftFor the next step, you need a Splunk Web URL, such as http://splunk.local.outcold.solutions:8000. Change this URL in the following
command to the Splunk Web URL, where you have Monitoring OpenShift application installed.
1oc new-app -f https://raw.githubusercontent.com/outcoldsolutions/openshift-webconsole-integration/v1.2.0/openshift/templates/outcoldsolutions-webconsole-integration.yaml \
2    --param=SPLUNK_WEB_URL=http://splunk.local.outcold.solutions:8000 \
3    --param=SOURCE_REPOSITORY_REF=v1.2.0
This template will install the application directly from the GitHub repository
with version (tag) v1.2.0. For production environments we recommend that you fork this repository and move
the sources of this application to your own location. With these parameters you can override the location of the
openshift-webconsole-integration application. As an example
1oc new-app -f https://git.local.outcold.solutions/outcoldsolutions/openshift-webconsole-integration/v1.2.0/openshift/templates/outcoldsolutions-webconsole-integration.yaml \
2    --param=SPLUNK_WEB_URL=http://splunk.local.outcold.solutions:8000 \
3    --param=SOURCE_REPOSITORY_REF=v1.2.0 \
4    --param=SOURCE_REPOSITORY_URL=https://git.local.outcold.solutions/outcoldsolutions/openshift-webconsole-integration
This template automatically creates the route and exposes script.js. You can find the direct link to this script with
1echo "https://$(oc get route outcoldsolutions-webconsole-integration -o=jsonpath='{.spec.host}')/script.js"As an example, it can look similar to
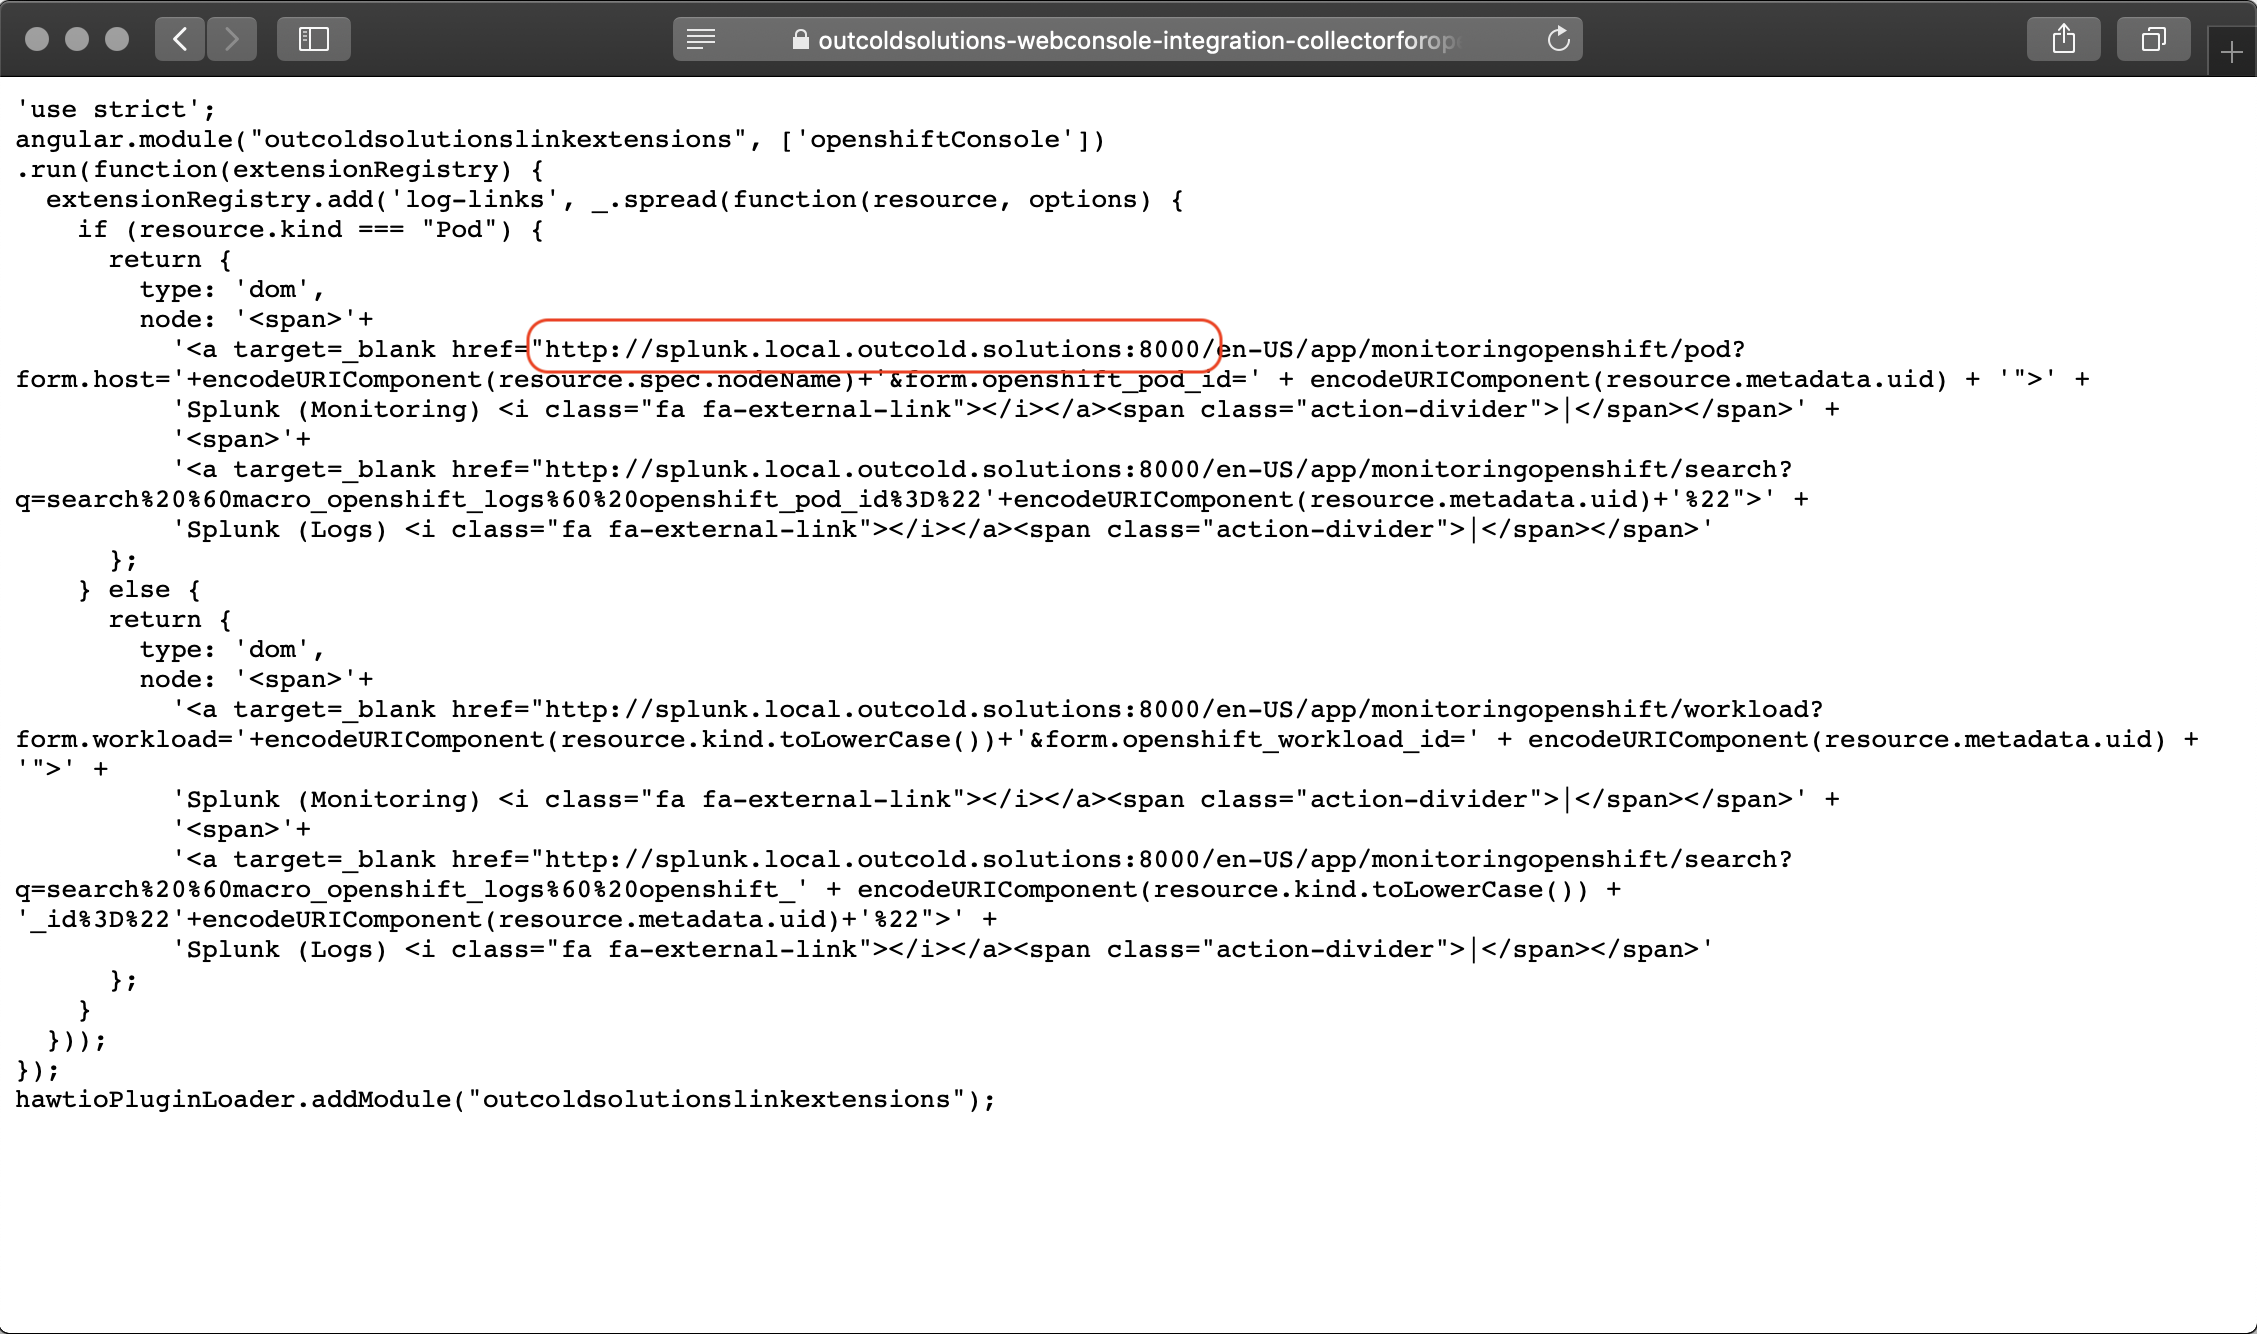
1https://outcoldsolutions-webconsole-integration-collectorforopenshift.apps.local.outcold.solutions/script.jsOpen this script in the browser to verify that you can access it. It might take a few moments for the application
to be built and deployed. You can check the status with oc status.
Verify that you see an expected Splunk URL in the links.
Now we can integrate this script into the Web Console. You can use CLI commands by following the guide Loading Extension Scripts and Stylesheets or you can do that from the Web Console as well.
Open the Development Console in your browser and refresh the page, and verify that you can find the script.js file we just created
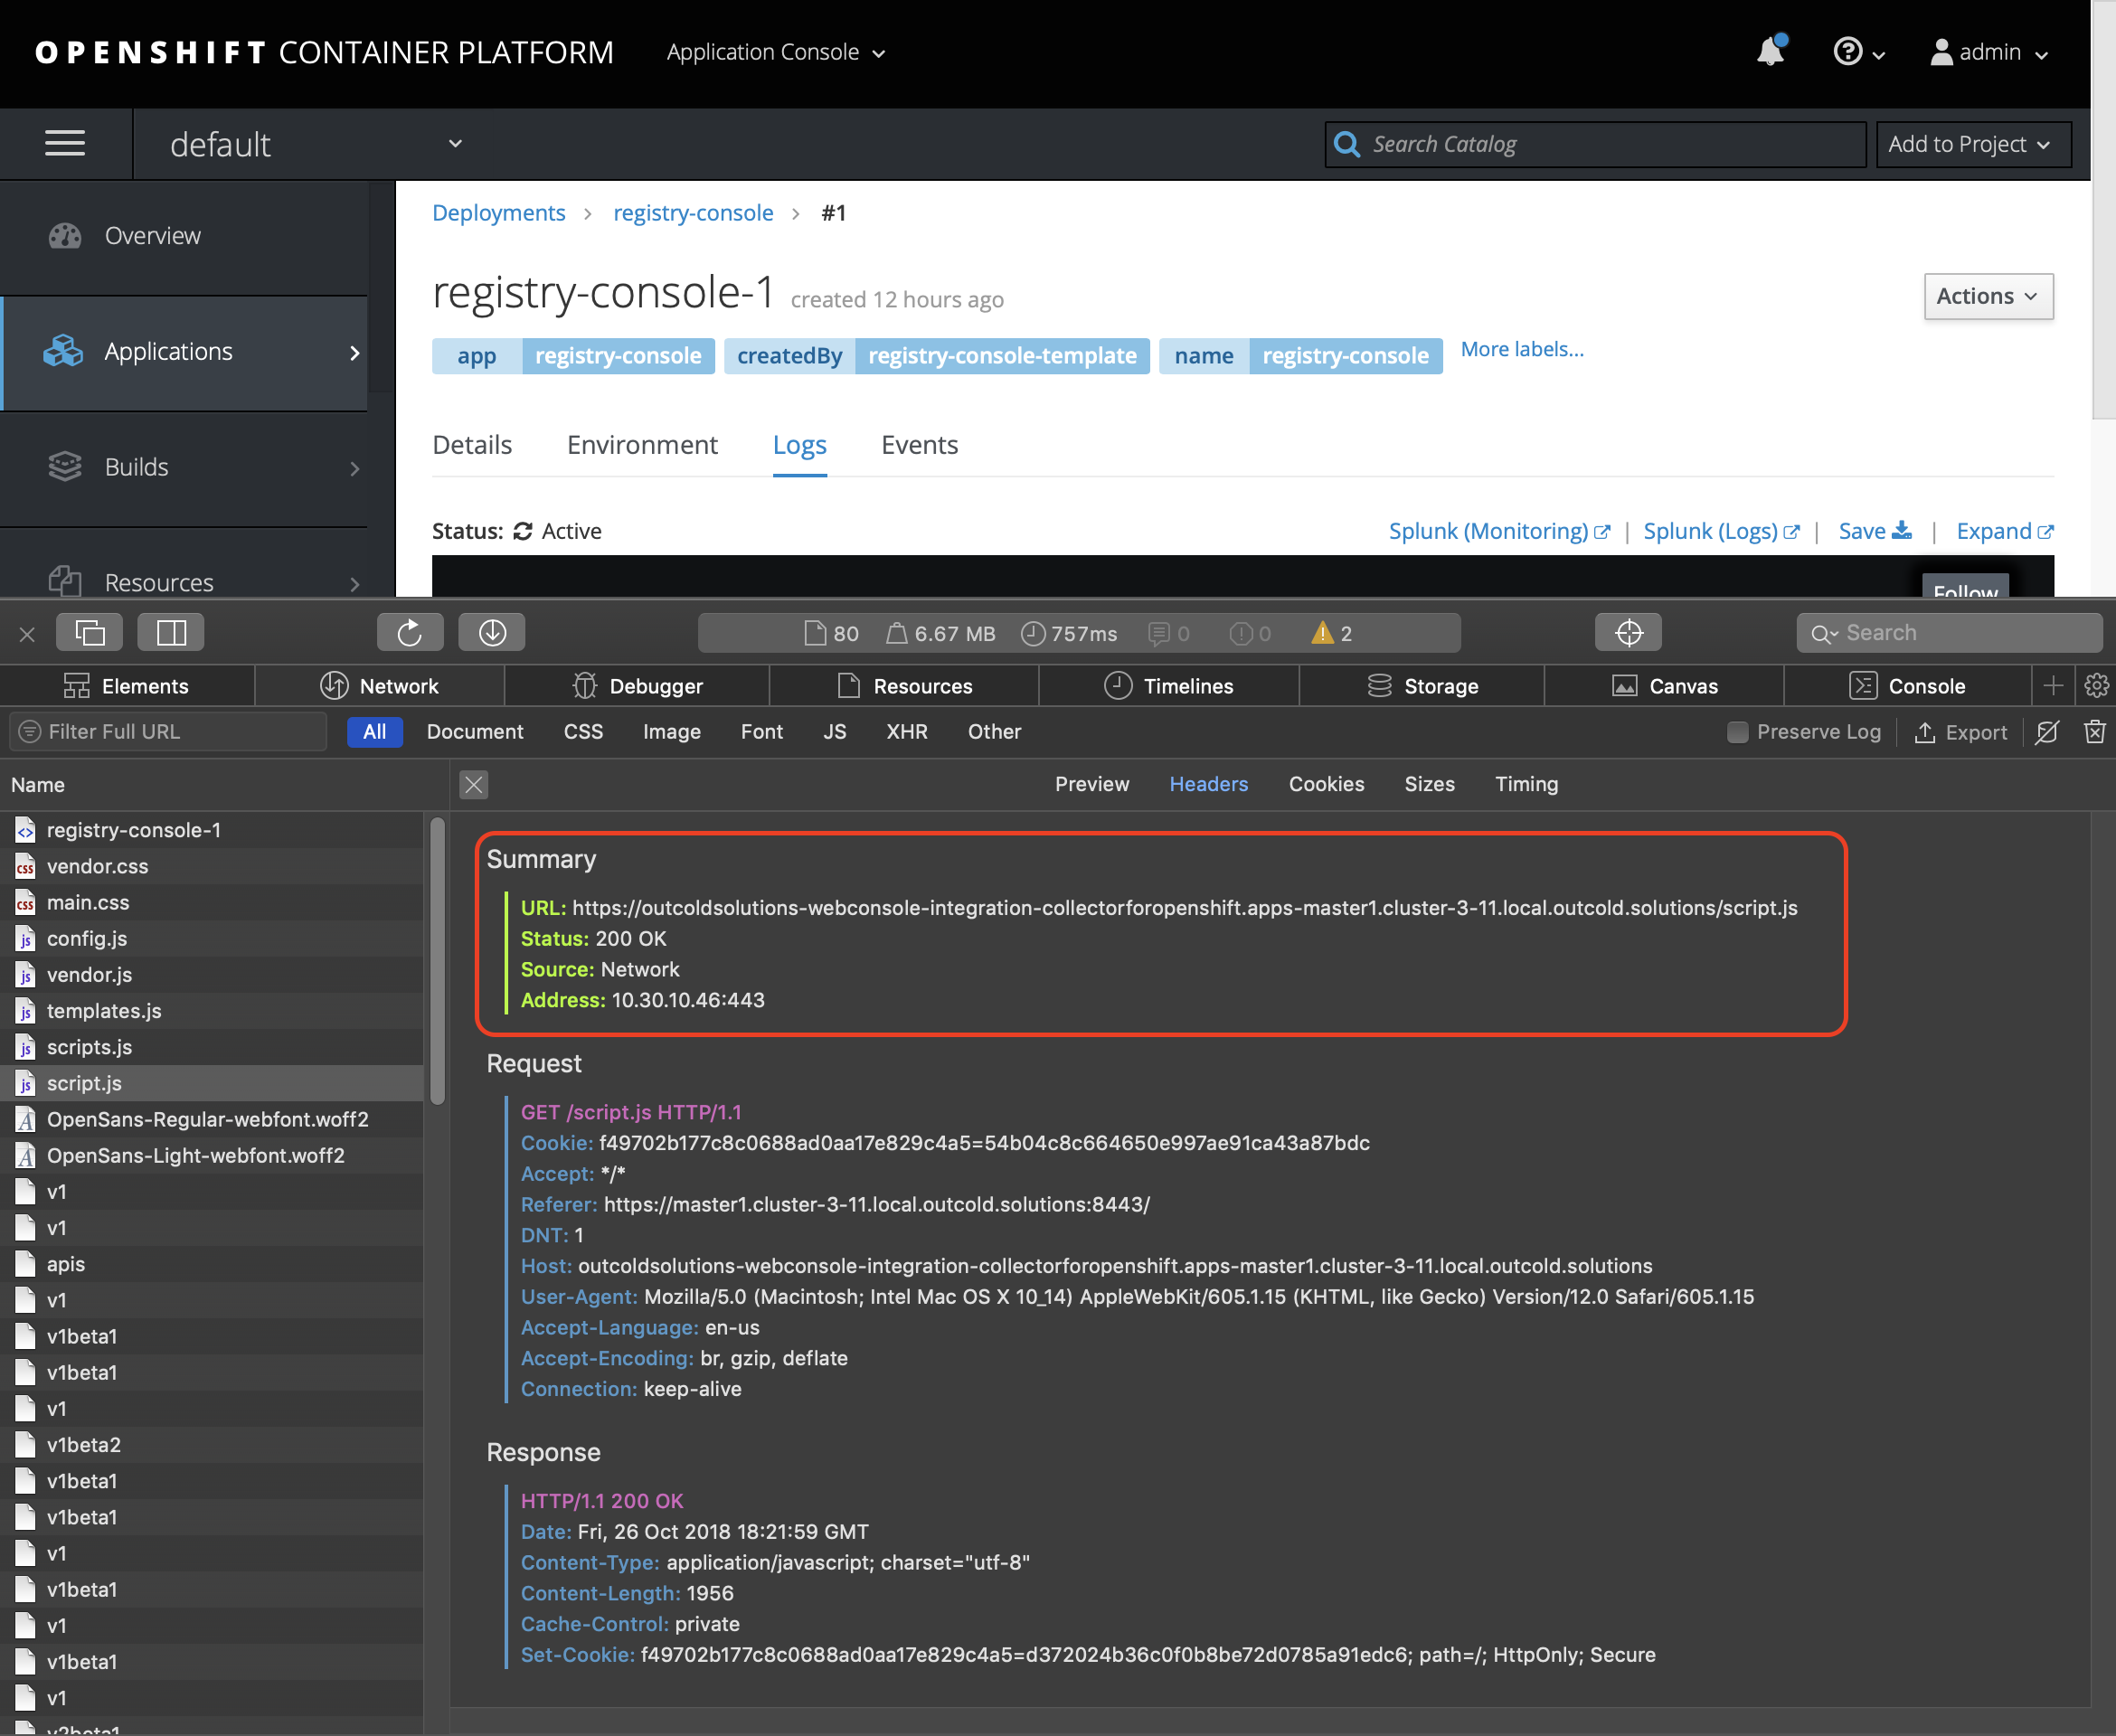
If you don’t see the script, force OpenShift to recreate the Console with the new configuration by deleting Web Console Pods
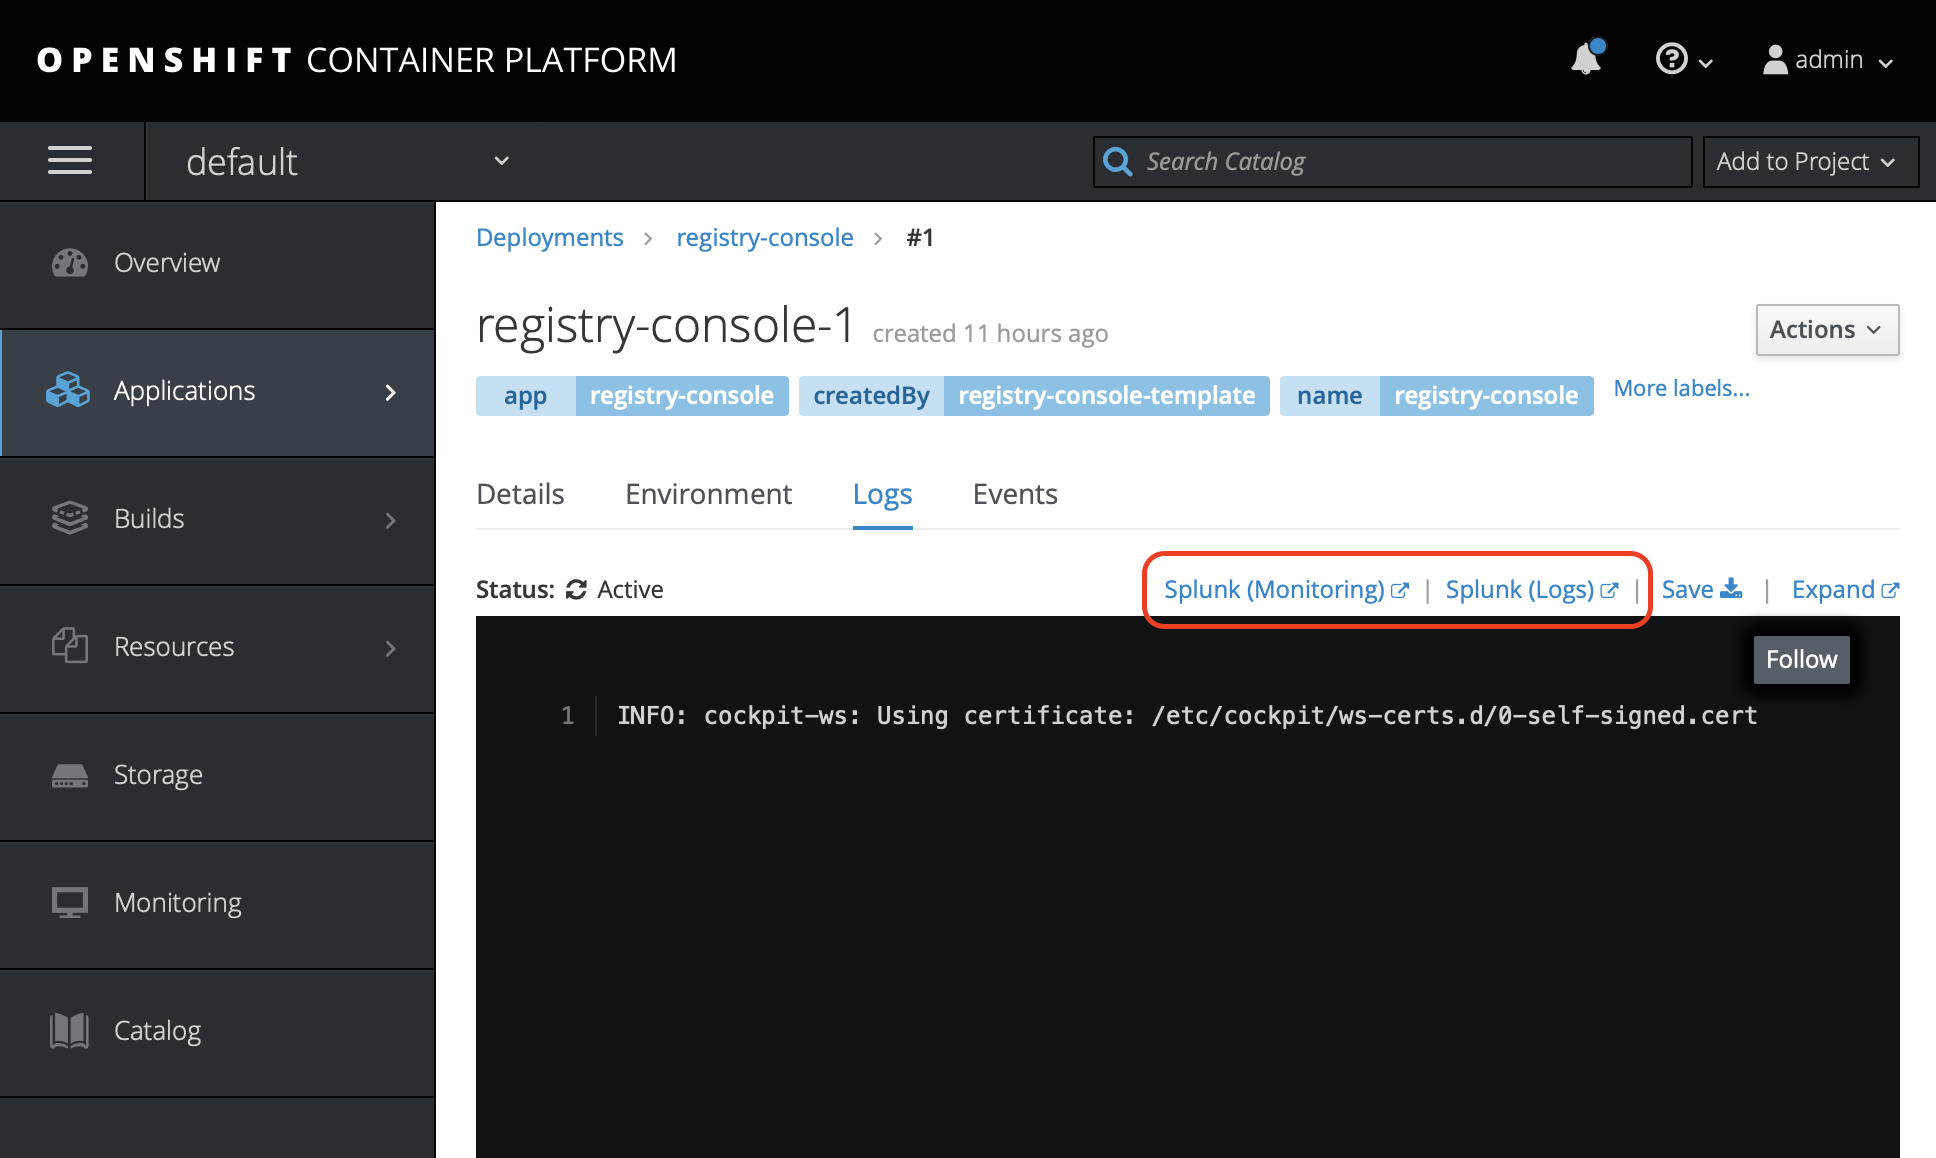
1oc delete pods -n openshift-web-console -l app=openshift-web-consoleAfter that you should see links in every Logs view in the OpenShift web console.
We hope that this simple integration will boost your productivity!
Feel free to fork, contribute and open issues at https://github.com/outcoldsolutions/openshift-webconsole-integration.


