
Configuring Splunk Indexes
By default collectorforkubernetes forwards all the events to the default index specified for HTTP Event Collector Token.
Every HTTP Event Collector Token has a list of indexes, where this specific Token can write data. One of the indexes
from this list is also used as a default index when the sender of the data does not specify target index.
The application assumes that you are writing data to the indexes, which are searchable by default by your Splunk Role.
As an example, the main index is searchable by default.
If you used the different index, which isn't searchable by default by your Splunk Role, you would not see data on the dashboards.
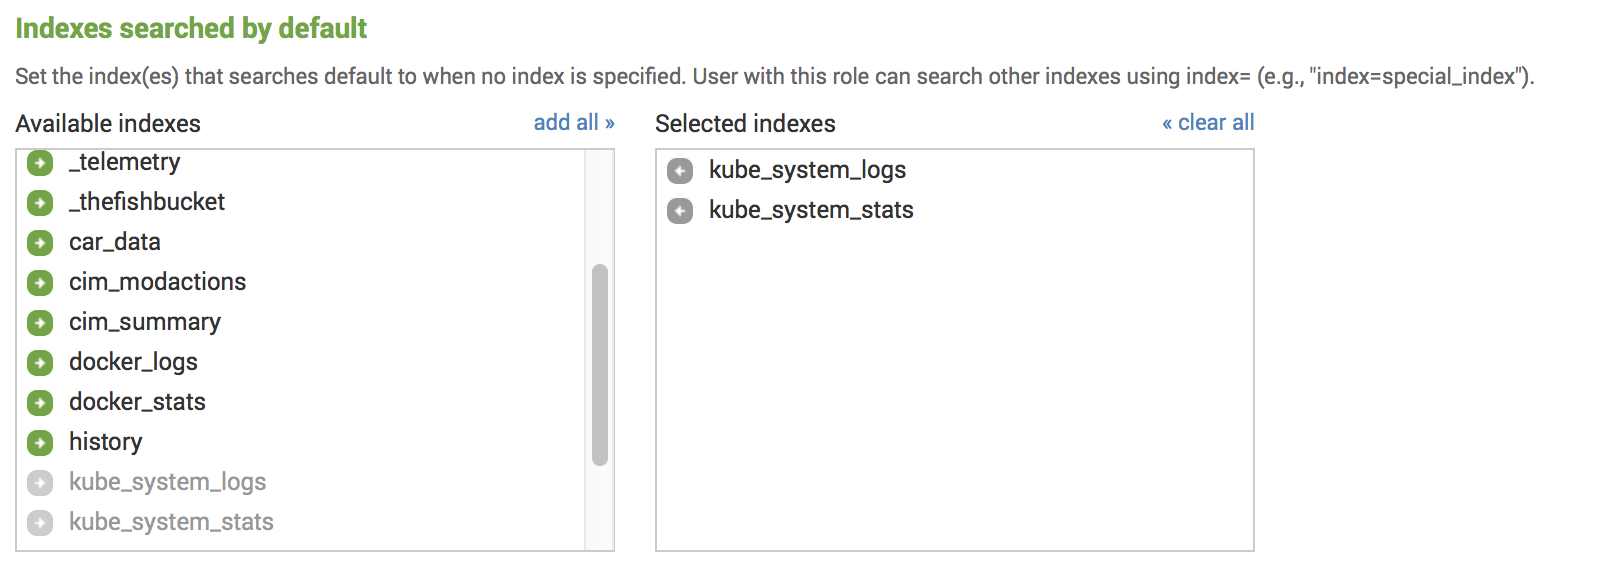
To fix that, you can include this index to the Indexes searched by default for your role under Settings - Access Control - Roles
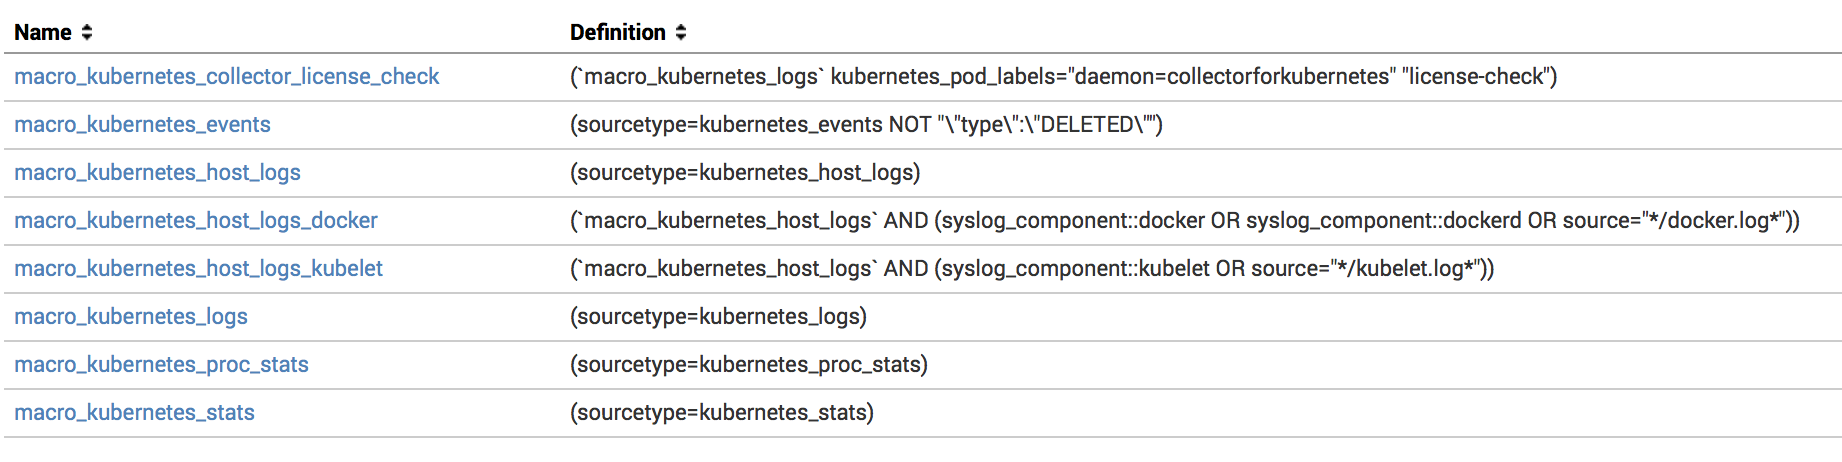
Or you can change Search Macros we use in the application and include a list of indexes you use for the Monitoring Kubernetes
events. You can find search macros in Splunk Web UI under Settings - Advanced search
- Search macros (or by overriding $SPLUNK_HOME/etc/apps/monitoringkubernetes/default/macros.conf with
$SPLUNK_HOME/etc/apps/monitoringkubernetes/local/macros.conf).
Starting from version 5.10 we include a base macro macro_kubernetes_base, where you can include the list of indexes only
once, all other macros will deliver this configuration. For example
macro_kubernetes_base = (index=kubernetes_stats OR index=kubernetes_logs)
If you want to have more precise configurations, you can modify specific macros.
macro_kubernetes_stats = (index=kube_system_stats sourcetype=kubernetes_stats)
You only need to update macros
macro_kubernetes_events- all the kubernetes events.macro_kubernetes_host_logs- host logs.macro_kubernetes_logs- container logs.macro_kubernetes_proc_stats- proc metrics.macro_kubernetes_net_stats- network metrics.macro_kubernetes_net_socket_table- network socket tables.macro_kubernetes_stats- system and container metrics.macro_kubernetes_mount_stats- container runtime storage usage metrics.macro_kubernetes_prometheus_metrics- metrics from prometheus format
Using dedicated indexes for different types of data
Considering the application access patterns and the content of the events, we recommend to split logs with metrics
and use dedicated indexes. For example kube_system_logs for events, container and host logs; kube_system_stats for
proc and system metrics; and kube_prometheus for prometheus metrics.
You can also specify dedicated index for every type of the data collector forwards.
Using dedicated indexes allows you also to specify different retention policies for logs and the metrics.
You can do that by using Configuration Reference file and set the values of the indexes you want to use as the destination.
1 2 3 4 5 6 7 8 9 10 11 12 13 14 15 16 17 18 19 20 21 22 23 24 25 26 27 28 29 30 31 32 33 34 35 36 37 38 39 40 41 42 43 44 45 46 47 48 49 50 51 52 53 54 55 56 57 58 59 60 61 62 63 64 65 66 67 68 69 70 71 72 73 74 75 76 77 78 79 80 81 82 83 84 | data: collector.conf: | ... [input.system_stats] ... # specify Splunk index index = ... [input.proc_stats] ... # specify Splunk index index = ... [input.net_stats] ... # specify Splunk index index = ... [input.net_socket_table] ... # specify Splunk index index = ... [input.mount_stats] ... # specify Splunk index index = ... [input.files] ... # specify Splunk index index = ... [input.files::syslog] ... # specify Splunk index index = ... [input.files::logs] ... # specify Splunk index index = ... [input.kubernetes_events] ... # specify Splunk index index = ... |
Configuring dedicated indexes, source and sourcetype for Namespaces
You can also override targeted indexes for namespaces in Kubernetes. Collector watches for annotations on the namespaces,
workloads, and pods. For example, if you want to specify that you want to index all container logs, metrics and events in specific
namespace namespace1 to index kubernetes_namespace1 you can annotate this namespace with
kubectl annotate namespaces namespace1 \
  collectord.io/index=kubernetes_namespace1
You can learn more about available annotations at Annotations
Links
-
Installation
- Start monitoring your Kubernetes environments in under 10 minutes.
- Automatically forward host, container and application logs.
- Test our solution with the embedded 30 days evaluation license.
-
Collector Configuration
- Collector configuration reference.
-
Annotations
- Changing index, source, sourcetype for namespaces, workloads and pods.
- Forwarding application logs.
- Multi-line container logs.
- Fields extraction for application and container logs (including timestamp extractions).
- Hiding sensitive data, stripping terminal escape codes and colors.
- Forwarding Prometheus metrics from Pods.
-
Audit Logs
- Configure audit logs.
- Forwarding audit logs.
-
Prometheus metrics
- Collect metrics from control plane (etcd cluster, API server, kubelet, scheduler, controller).
- Configure collector to forward metrics from the services in Prometheus format.
-
Configuring Splunk Indexes
- Using not default HTTP Event Collector index.
- Configure the Splunk application to use not searchable by default indexes.
-
Splunk fields extraction for container logs
- Configure search-time fields extractions for container logs.
- Container logs source pattern.
-
Configurations for Splunk HTTP Event Collector
- Configure multiple HTTP Event Collector endpoints for Load Balancing and Fail-overs.
- Secure HTTP Event Collector endpoint.
- Configure the Proxy for HTTP Event Collector endpoint.
-
Monitoring multiple clusters
- Learn how you can monitor multiple clusters.
- Learn how to set up ACL in Splunk.
-
Streaming Kubernetes Objects from the API Server
- Learn how you can stream all changes from the Kubernetes API Server.
- Stream changes and objects from Kubernetes API Server, including Pods, Deployments or ConfigMaps.
-
License Server
- Learn how you can configure remote License URL for Collectord.
- Monitoring GPU
- Alerts
- Troubleshooting
- Release History
- Upgrade instructions
- Security
- FAQ and the common questions
- License agreement
- Pricing
- Contact


