How to submit a support request?
If you have a support contract, send an email to support@outcoldsolutions.com. When you sign the contract, you nominate the people in your organization authorized to open requests - contact your procurement department to add more.
Include the following in every request:
- LicenseID (not the License Key). You can find it in our applications under Setup -> Collectord usage, or in the Collectord logs - for example,
INFO 2023/05/24 05:36:48.834659 outcoldsolutions.com/collectord/license/license_check_pipe.go:158: license-check openshiftBG5183Q89IE2G0 0 .... - The customer name, if you’re a partner or contractor opening a request on someone else’s behalf.
- A short incident description in the email subject.
- Incident details in the body. The more you include up front, the faster we can help - we won’t have to come back asking for more. In 99% of cases we’ll ask for diagnostic information from the Collectord instance running on the node where the issue is happening; that archive contains most of what we need, including the Collectord version and basic usage. Run all 4 steps for your platform:
- If you can’t share diagnostic information, describe the issue in as much detail as possible and include the Collectord version you’re running.
A few things that help us help you faster:
- Email is our primary support channel. We’ll follow up with a phone call or web meeting if it’s useful.
- You can keep your team in CC, but please respect the contract and keep that list small - we can’t respond to people who aren’t covered.
- One support request per email thread. If you have multiple issues, open multiple requests.
I do not see IO metrics on host dashboards
We source IO metrics from the blkio-controller, which isn’t always enabled. As a workaround, sum the proc metrics - we collect those per process.
I received a license. How do I apply it?
Collectord reads the license key from its configuration file.
Collectord for Kubernetes and Collectord for OpenShift
Set the license in the ConfigMap shipped with our yaml manifests. Find the line license = and paste your key as the value (no spaces). Starting with version 5.0, Collectord picks up the change within a few moments - no restart needed.
On versions below 5.0 you need to restart the collectors. Editing a ConfigMap doesn’t trigger a Pod restart, so delete the running pods and let the scheduler recreate them.
OpenShift:
oc delete --namespace collectorforopenshift pods --allKubernetes:
kubectl delete --namespace collectorforkubernetes pods --allIf you’re on version 3 of our Monitoring OpenShift and Kubernetes solution, Collectord runs in the
defaultnamespace - delete the pods manually and the DaemonSet will reschedule them.
Collectord for Docker
Edit the collector.yaml configuration file if you already maintain your own, or set the license through an environment variable: --env "COLLECTOR__LICENSE=general__license=...".
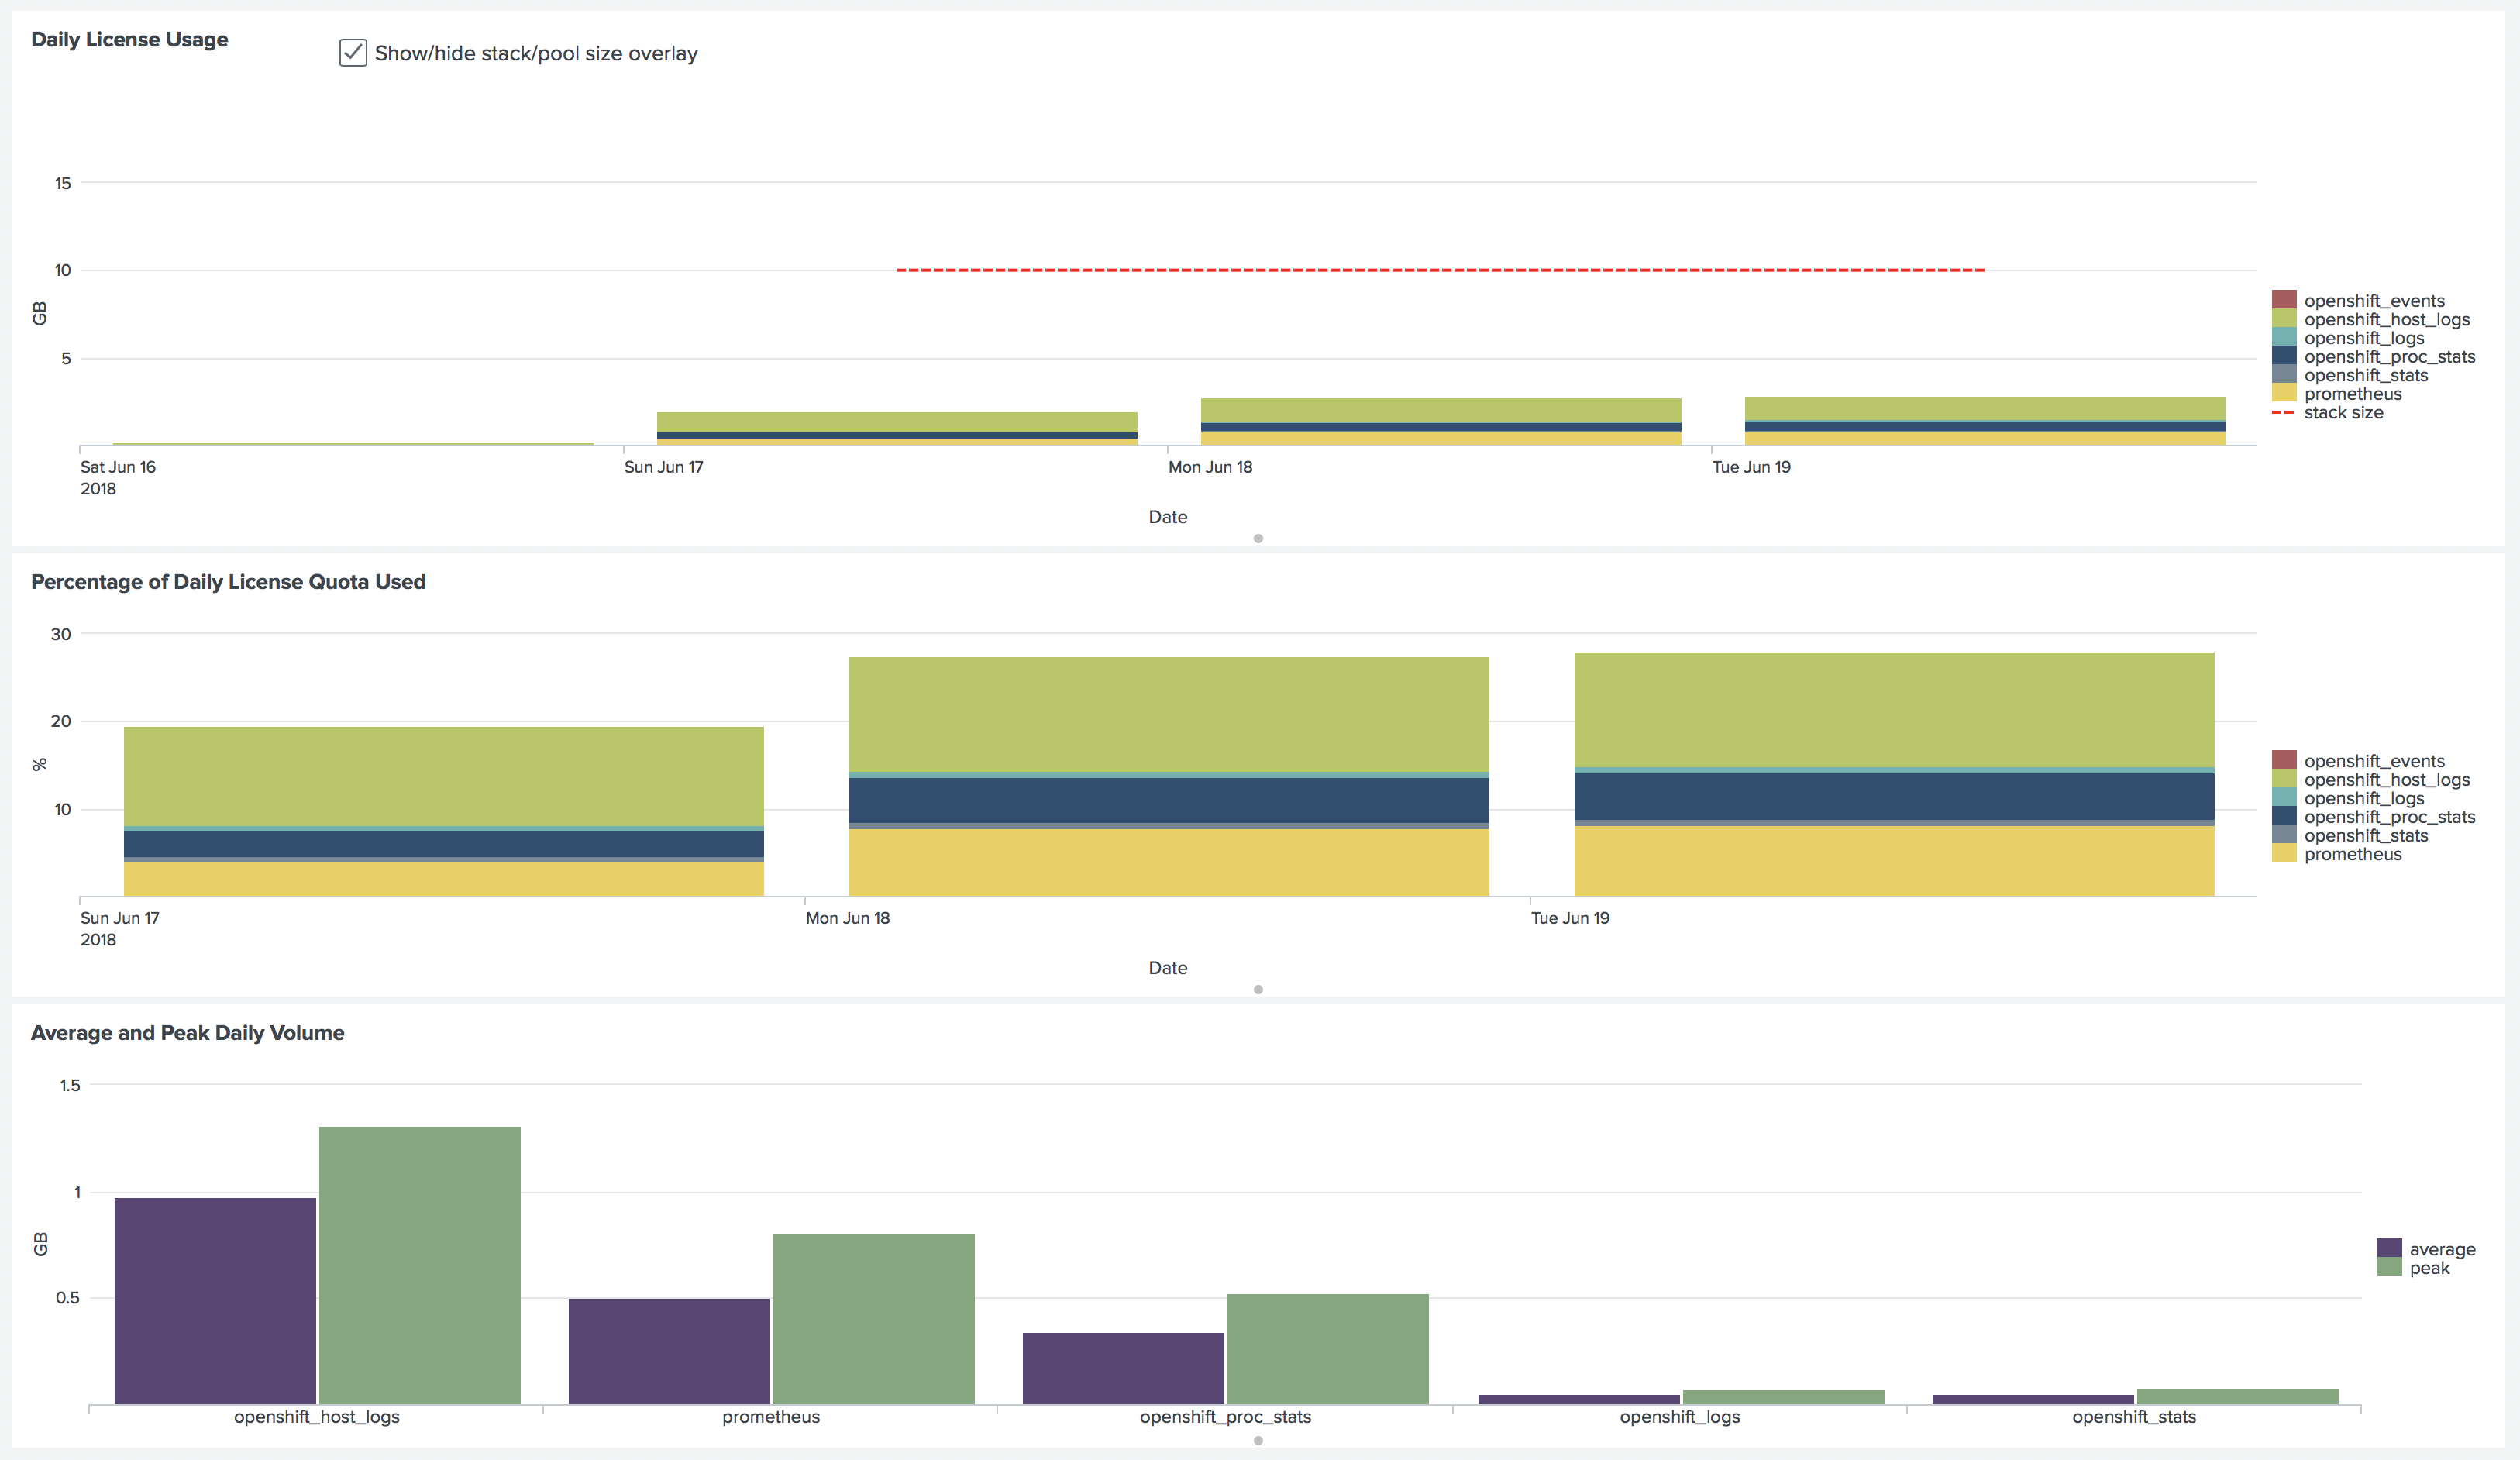
How much data does your application generate?
In version 5.3 and above, the Splunk Usage dashboard under Setup shows current usage at a glance.
Because we use indexed field extractions on the HTTP Event Collector, our tests show less than a 5% increase in Splunk licensing cost for logs.
You can also check usage per source type directly in Splunk:
1index=_internal source=*metrics.log | eval MB=kb/1024 | search group="per_sourcetype_thruput" | timechart span=1h sum(MB) by seriesFor Kubernetes nodes running 20–30 containers, we typically see around 200 MB per day across kubernetes_stats and kubernetes_proc_stats combined.
Here’s the licensing breakdown from our demo environment - 2 OpenShift clusters, 9 nodes total (1+3 masters, 1+4 workers), 62 pods:
Performance
For numbers on Collectord’s throughput, see our blog post: Forwarding 10,000 1k events generated by containers from a single host with ease.
Do you support a specific version of Kubernetes, OpenShift and Docker?
We continuously test against the most popular Kubernetes providers - Azure AKS, Amazon EKS, and Google Kubernetes Engine - and verify edge versions on self-provisioned clusters built with Kubeadm. Our OpenShift monitoring solution is Red Hat certified. For Docker, we test on a variety of Linux distributions and ship configurations for the common orchestrations, including Docker Swarm and Amazon ECS.
Why is it called Outcold Solutions?
Outcold Solutions takes its name from our founder’s recognized industry handle “outcoldman,” which became synonymous with expertise in Docker and Splunk integration during the early adoption phase of containerization. Our founder’s deep technical knowledge and early adoption of containerization made them a trusted voice in the enterprise monitoring community, establishing the technical foundation that drives our solutions today.
Our founder’s industry contributions include developing the original Docker images for Splunk that became the official Splunk Docker images, contributing to the Splunk logging driver for Docker, and serving as a technical authority through speaking engagements at Splunk Conferences. This proven track record of innovation and enterprise-grade solutions continues to guide our commitment to delivering reliable, scalable monitoring platforms for mission-critical environments.