
Prometheus Metrics
By default collector for docker does not collect any metrics in Prometheus format. But it has capabilities to do so.
Configuration
The generic Prometheus configuration section is
[input.prometheus::ANYNAME]

# disable input
disabled = false

# specify the type for current input
type = docker_prometheus

# specify Splunk index for current input
index =

# specify the host for current input
host =

# specify the source
source =

# how often to collect prometheus metrics
interval = 60s

# Prometheus endpoint, multiple values can be specified, collector tries them in order till finding the first
# working endpoint.
# At first trying to get it through proxy
endpoint.1 =
# endpoint.2 =

# token for "Authorization: Bearer $(cat tokenPath)"
tokenPath =

# server certificate for certificate validation
certPath =

# client certificate and key for authentication
clientCertPath =
clientKeyPath =

# Allow invalid SSL server certificate
insecure = false

# include metrics help with the events
includeHelp = false
You can find variety of the services, exporting metrics in Prometheus format.
Example. Collecting metrics from nginx service.
For this example we will use sophos/nginx-prometheus-metrics image.
The image
sophos/nginx-prometheus-metricsis not an official nginx image. We use it only for demo purposes.
We use a command from the image example to run it
docker run -d --rm -it -p 80:80 -p 1314:1314 -p 9527:9527 sophos/nginx-prometheus-metrics
For this input we define configuration with 002.conf. The most important part of configuration is to specify how collector
can get to the endpoint with metrics. We use simple approach by publishing port in outside world, and accessing it with the
hostname of the host.
[general]
acceptLicense = true

[output.splunk]
url = https://hec.example.com:8088/services/collector/event/1.0
token = B5A79AAD-D822-46CC-80D1-819F80D7BFB0
insecure = true

[input.prometheus::nginx-example]
disabled = false
type = docker_prometheus
index =
host =
source = docker_nginx_example
interval = 60s
endpoint.1 = http://host.docker.internal:9527/metrics
tokenPath =
certPath =
clientCertPath =
clientKeyPath =
insecure = false
includeHelp = true
Build the image with the embedded configuration.
FROM outcoldsolutions/collectorfordocker:5.22.422

COPY 002.conf /config/002.conf
Run it with provided installation guidance.
Metrics format
Prometheus defines several types of metrics.
Each metric value in Splunk has fields:
metric_type- one of the types from the Prometheus metric types.metric_name- the name of the metric.metric_help- only ifincludeHelpis set totrue<, you will see definition of this metric.metric_label_XXX- if the metric has labels, you will be able to see them attached to the metric values.seed- unique value from the host for specific metric collection.
Based on the metric type you can find various values for the metrics.
-
counterv- current counter valued- the difference with a previous valuep- period for which this difference is calculated (in nanoseconds)
-
summaryandhistogramv- valuec- counter specified for thissummaryorhistogrammetric
-
All others
v- value
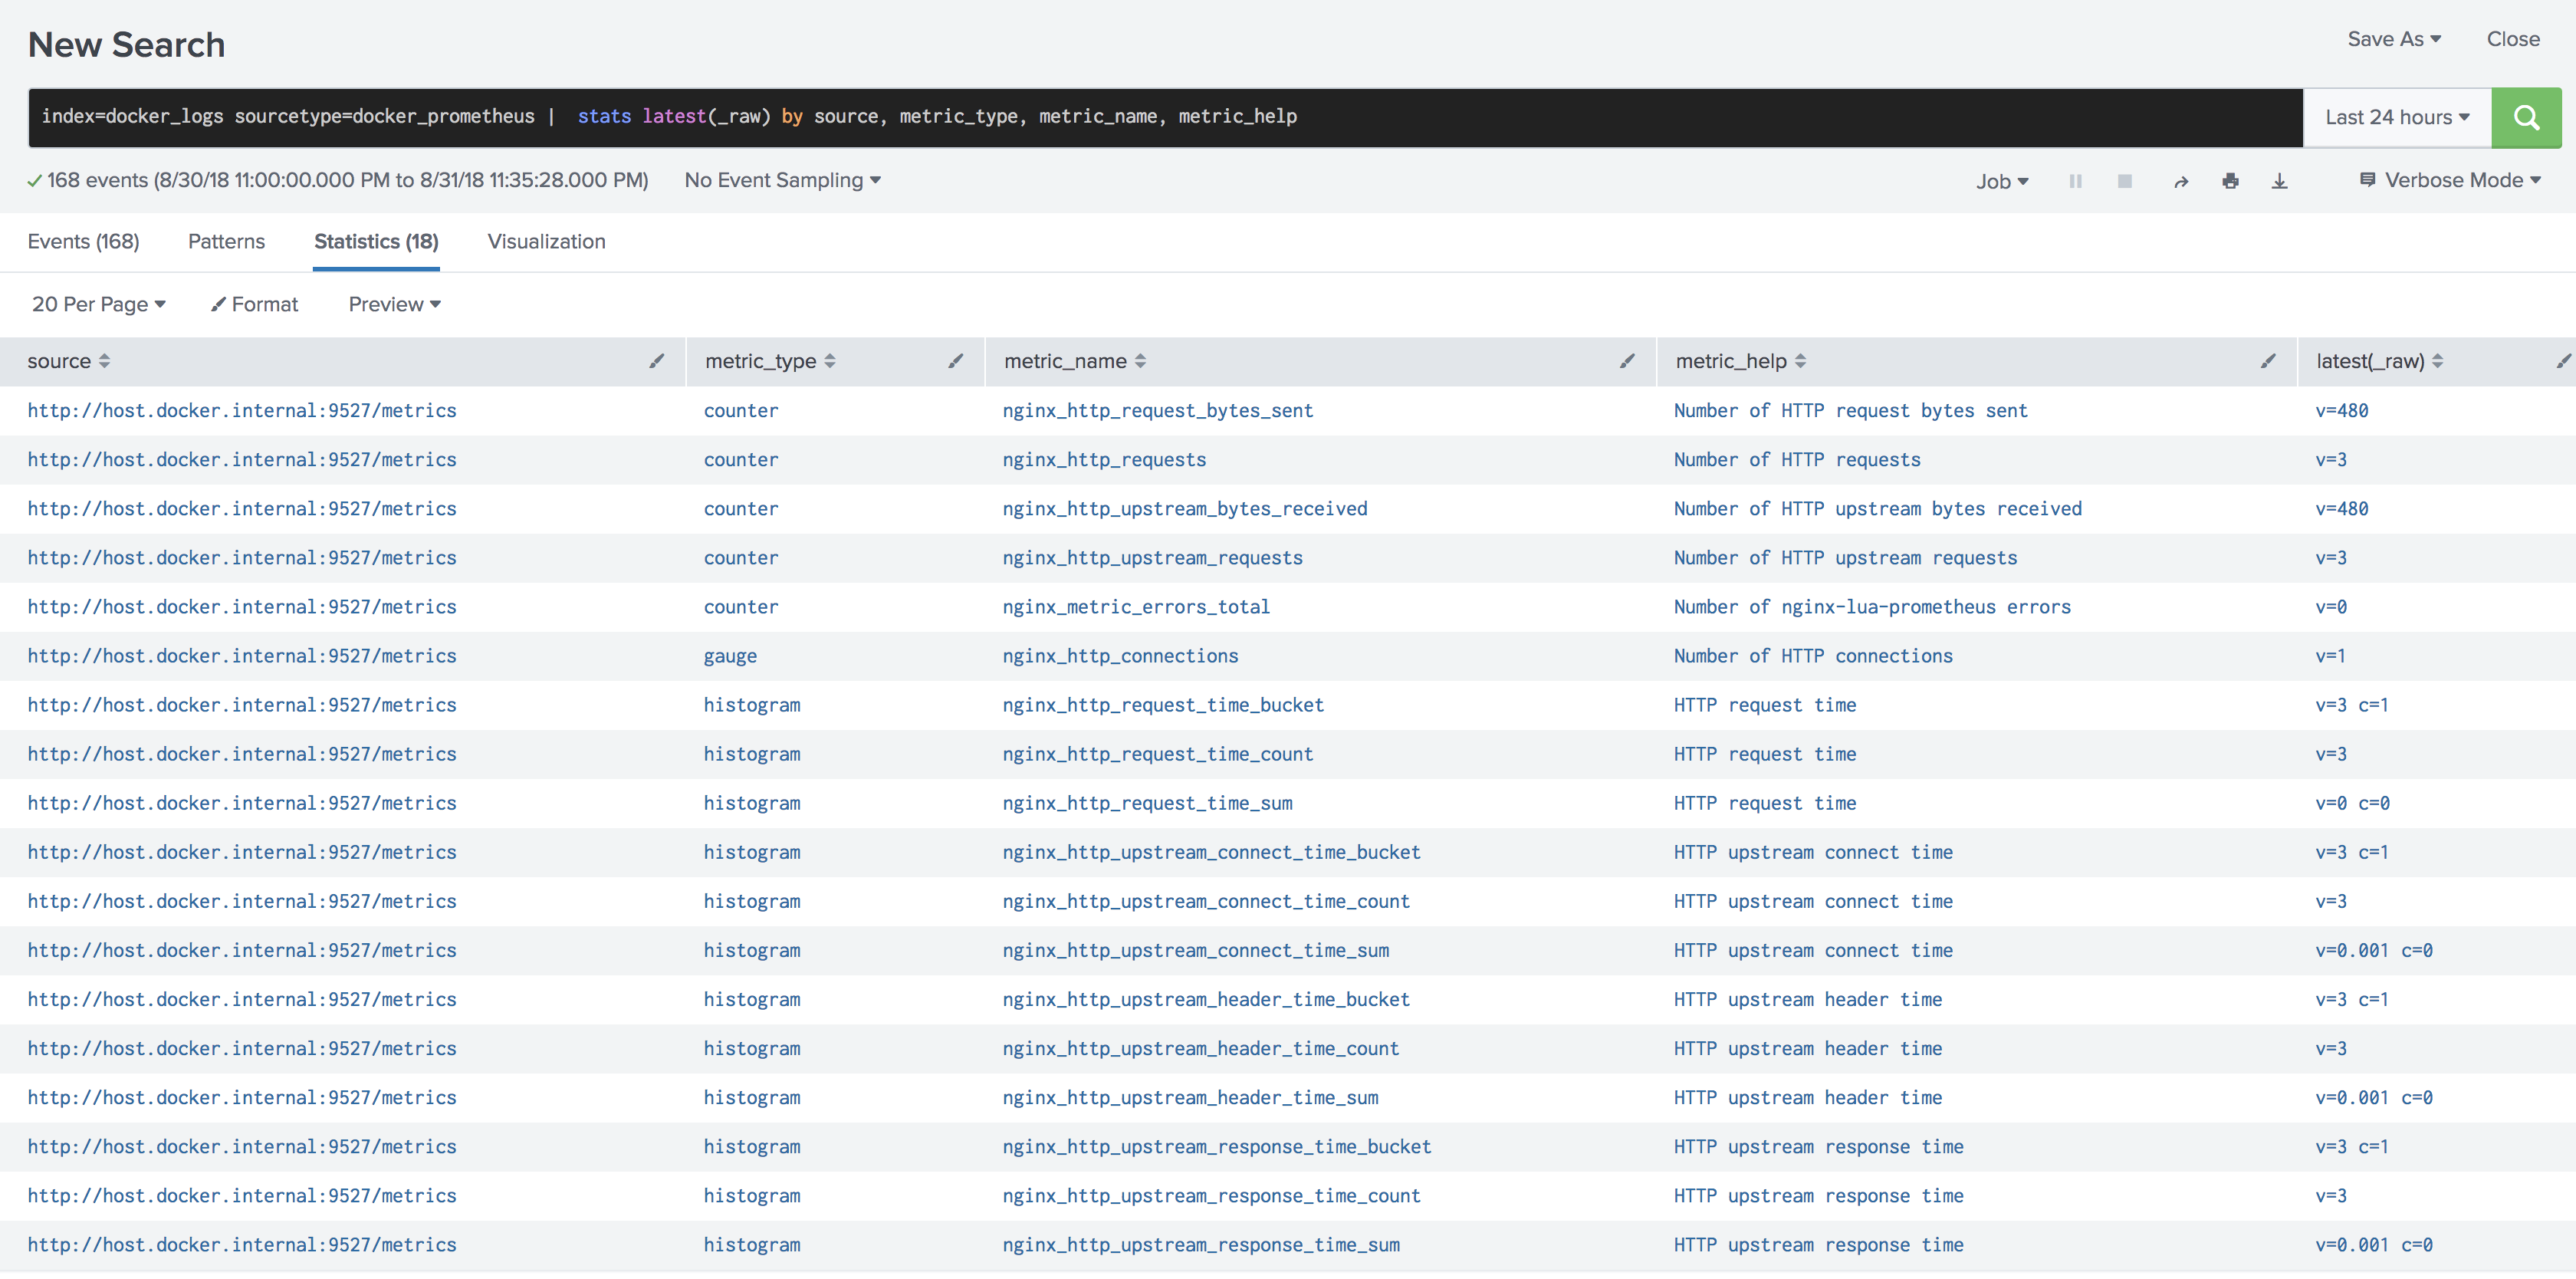
If you have specified to include help with the metrics, you can explore all available metrics with the search.
sourcetype="docker_prometheus"
|  stats latest(_raw) by source, metric_type, metric_name, metric_help
Links
-
Installation
- Start monitoring your docker environments in under 10 minutes.
- Automatically forward host, container and application logs.
- Test our solution with the embedded 30 days evaluation license.
-
Collector Configuration
- Collector configuration reference.
- Build custom image on top collector image with embedded configuration.
-
Container Annotations
- Forwarding application logs.
- Multi-line container logs.
- Fields extraction for application and container logs (including timestamp extractions).
- Hiding sensitive data, stripping terminal escape codes and colors.
-
Configuring Splunk Indexes
- Using not default HTTP Event Collector index.
- Configure the Splunk application to use not searchable by default indexes.
-
Splunk fields extraction for container logs
- Configure search-time fields extractions for container logs.
- Container logs source pattern.
-
Configurations for Splunk HTTP Event Collector
- Configure multiple HTTP Event Collector endpoints for Load Balancing and Fail-overs.
- Secure HTTP Event Collector endpoint.
- Configure the Proxy for HTTP Event Collector endpoint.
-
Collecting metrics from Prometheus format
- Configure collector to forward metrics from the services in Prometheus format.
-
Monitoring multiple clusters
- Learn how you can monitor multiple clusters.
- Learn how to set up ACL in Splunk.
-
Streaming Docker Objects from API Engine
- Learn how you can poll docker containers and images and forward them to Splunk.
-
License Server
- Learn how you can configure remote License URL for Collectord.
- Alerts
- Troubleshooting
- Release History
- Upgrade instructions
- Security
- FAQ and the common questions
- License agreement
- Pricing
- Contact


