Blog
Monitoring Docker, OpenShift and Kubernetes - Version 5.20
Version 5.20 of our applications, configurations, and Collectord is now available. In this blog post, we will cover some highlights of the release.
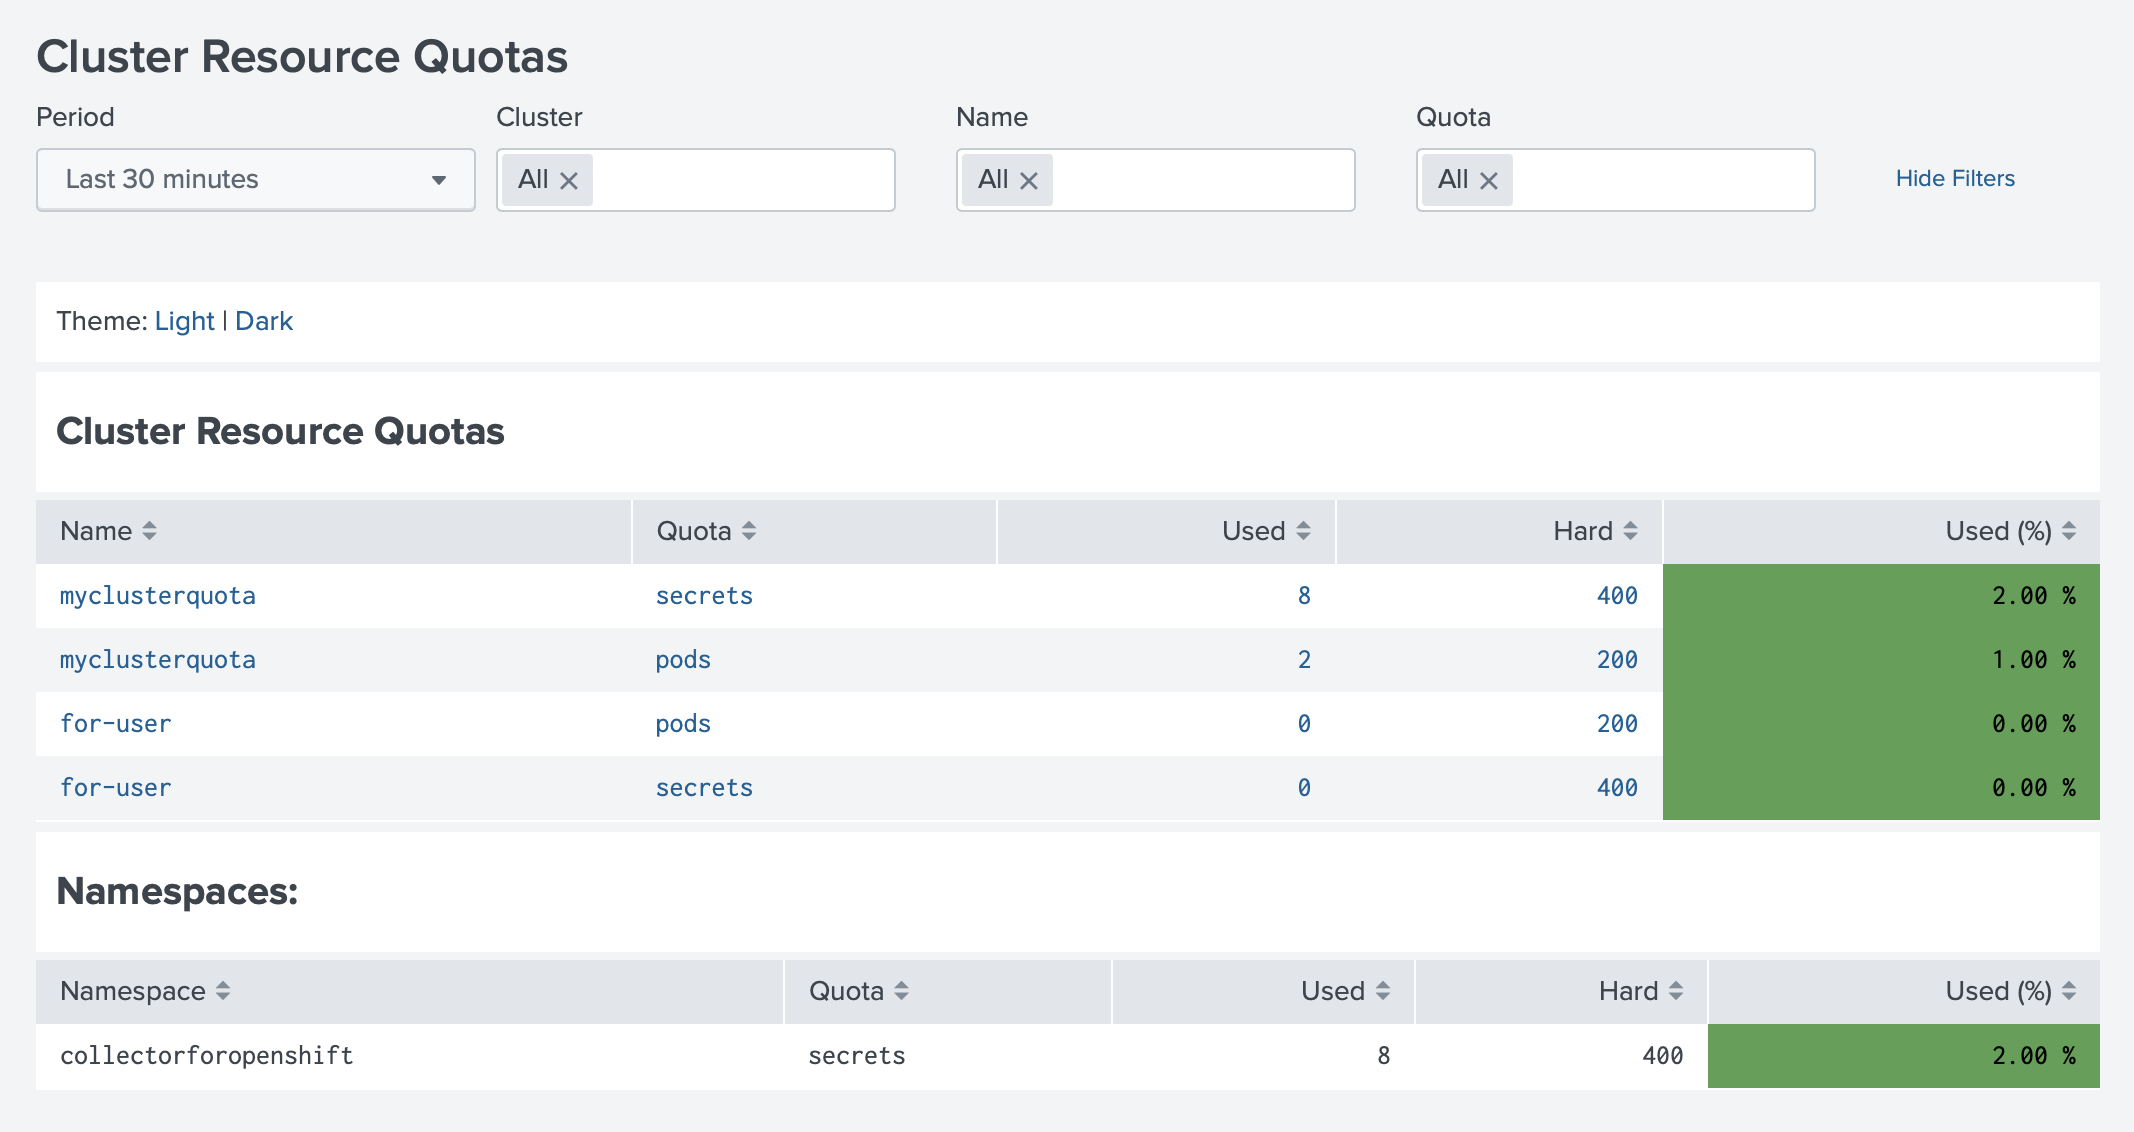
(OpenShift) Cluster Resource Quotas Dashboard
The Cluster Resource Quotas dashboard provides a high-level overview of the resource quotas for all namespaces in your cluster. The dashboard shows the current usage of CPU, memory, and storage for each namespace, as well as the total quota for each resource. The dashboard also shows the percentage of the quota that is currently in use.
When selecting a quota, the dashboard shows a drill-down by namespace.
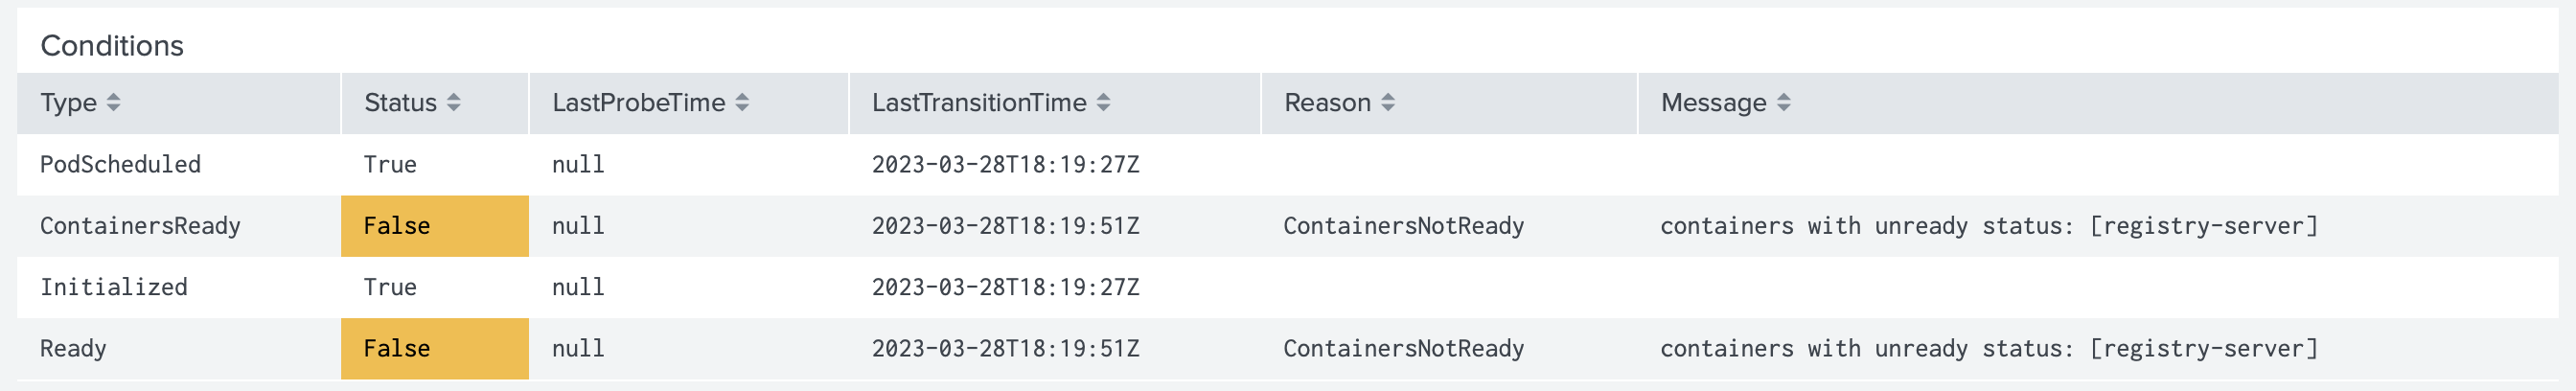
(Kubernetes and OpenShift) Pod conditions
In both applications, Monitoring Kubernetes and OpenShift, a new table is added to the Pod dashboard to show the Pod conditions.
(Kubernetes and OpenShift) Event duplication for multiple Splunk HTTP Event Collector endpoints
Collectord has supported multiple Splunk HTTP Event Collector endpoints since version 5.9, but with the possibility to only send events to a single endpoint. This was a limitation for users who wanted to send events to multiple Splunk HEC endpoints. In this version, we have added support for sending events to multiple Splunk HEC endpoints at the same time. This version only supports forwarding container logs and volume logs to multiple Splunk HEC endpoints at the same time.
With annotation collectord.io/logs-output you can configure multiple Splunk HEC endpoints, for example splunk::apps and splunk::security
using the comma-separated list: collectord.io/logs-output=splunk::apps,splunk::security.
Assuming you have them defined in the ConfigMap like [output.splunk::apps] and [output.splunk::security].
Additionally, you can configure indexes for the endpoints in square brackets, for example
collectord.io/logs-output=splunk::apps[kubernetes_logs],splunk::security[kubernetes_security].
In that case, each event will be sent to both Splunk HEC endpoints.
(Kubernetes and OpenShift) Improvements for forwarding logs from Persistent Volumes
Collectord supports forwarding logs from Persistent Volumes since version 5.11. The main purpose of supporting forwarding logs from persistent volumes is to support the use case when you want to forward logs from the applications running as Stateful Sets, like databases.
The weak point of the current implementation is that the Collectord stores acknowledgment information for each file on the host where the Persistent Volume is mounted. This means that if the Persistent Volume is remounted on a different host, the Collectord will start sending logs from the beginning, as it will not be able to find the acknowledgment information.
In this version, we have added support for storing acknowledgment information on the volume itself. You can add an
annotation collectord.io/volume.{N}-logs-onvolumedatabase=true to the Pod to enable this feature. In that case Collectord
creates a database file in volume root .collectord.db that stores information about all the files already sent to Splunk.
So when the volume is getting attached to a different host, another Collectord instance will be able to find the database file
and start forwarding logs from the last acknowledged position.
Important details about this feature, you need to mount the /rootfs directory in the Collectord container with write access.
By default, the /rootfs directory is mounted as read-only.
(Kubernetes and OpenShift) Support for placeholders in the glob configuration for Persistent Volumes
If you are mounting the same volume to multiple Pods and you want to differentiate the logs, you can now
specify placeholders in the glob configuration. For example, if you have a volume mounted to the Pod with the name
my-pod and to the Pod with the name my-pod-2, you can specify the glob configuration like this:
{{kubernetes_pod_name}}.log, so Collectord will be able to
identify that files my-pod.log and my-pod-2.log are coming from different Pods.
(Kubernetes, OpenShift and Docker) multi-architecture images
Collectord was available with multi-architecture images for amd64 and arm64 architectures since version 5.16.361, but
the arm64 image was always available as a separate image with the prefix -arm64. Since version 5.20.400, we are providing
multi-platform images for amd64 and arm64 architectures.
This simplifies the installation process for users with multi-architecture clusters.
(Kubernetes and OpenShift) Support for sending logs to Elasticsearch and OpenSearch
Large teams might have different requirements for the log management system. Some teams might prefer to use Elasticsearch or OpenSearch for log management. In this version, we have added support for sending logs to Elasticsearch and OpenSearch.
You can install Collectord with Elasticsearch or OpenSearch support and run it in the same cluster as Collectord for Splunk. In that case, you can configure Collectord to send logs to both Splunk and Elasticsearch or OpenSearch.
Please read the blog post for more details.
Links
You can find more information about other minor updates by following the links below.
Release notes
- Monitoring OpenShift - Release notes
- Monitoring Kubernetes - Release notes
- Monitoring Docker - Release notes


