Blog
Forwarding logs to ElasticSearch and OpenSearch with Collectord
Large teams might have different requirements for the log management system. Some teams might prefer to use Elasticsearch or OpenSearch for log management. In this version of Collectord, we have added support for sending logs to Elasticsearch and OpenSearch.
You can install Collectord with Elasticsearch or OpenSearch support and run it in the same cluster as Collectord for Splunk. In that case, you can configure Collectord to send logs to both Splunk and Elasticsearch or OpenSearch.
Collectord version 5.20 and later supports sending logs to Elasticsearch and OpenSearch.
Our installation instructions for Elasticsearch and OpenSearch provide dedicated configuration files for Elasticsearch and OpenSearch. The main difference is pre-configured mappings and templates for Elasticsearch and OpenSearch.
You can find installation instructions on our website: Forwarding logs to Elasticsearch and OpenSearch with Collectord
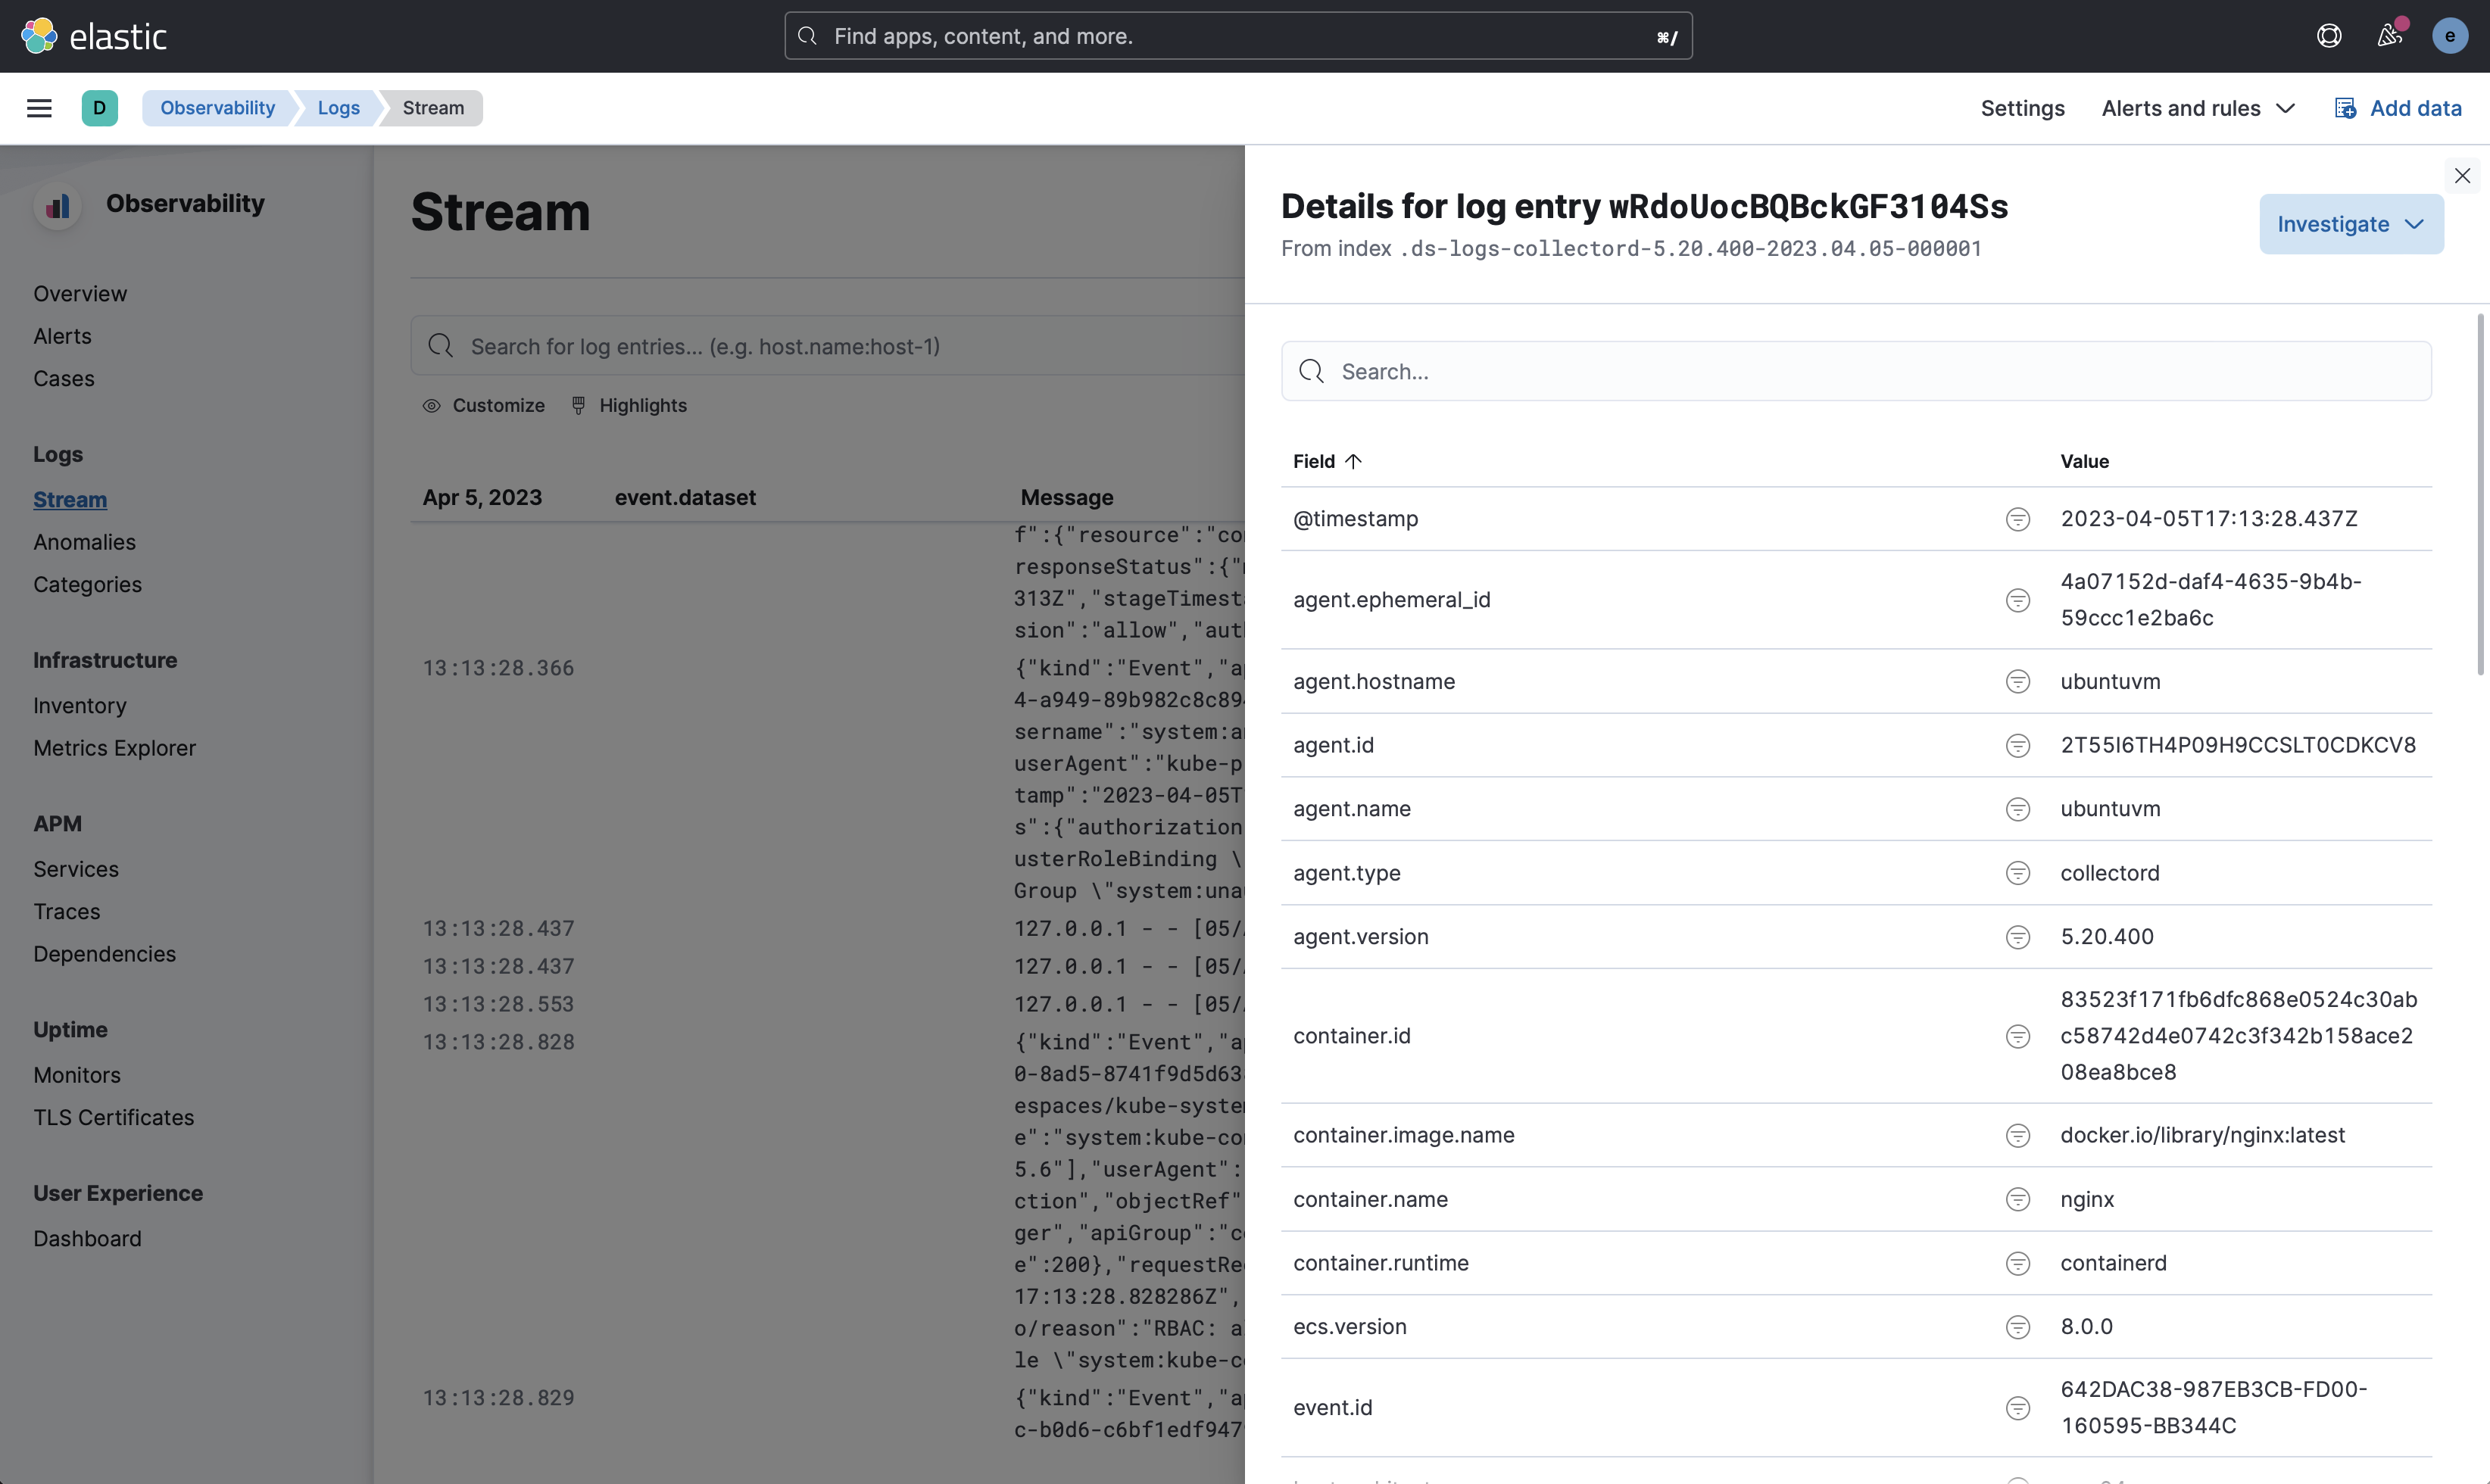
Preview of the Elasticsearch Observability Dashboard with logs ingested by Collectord
Collectord ingests logs with the Elastic Common Schema (ECS) format.
The following screenshot shows the Elasticsearch Observability Dashboard with logs ingested by Collectord.
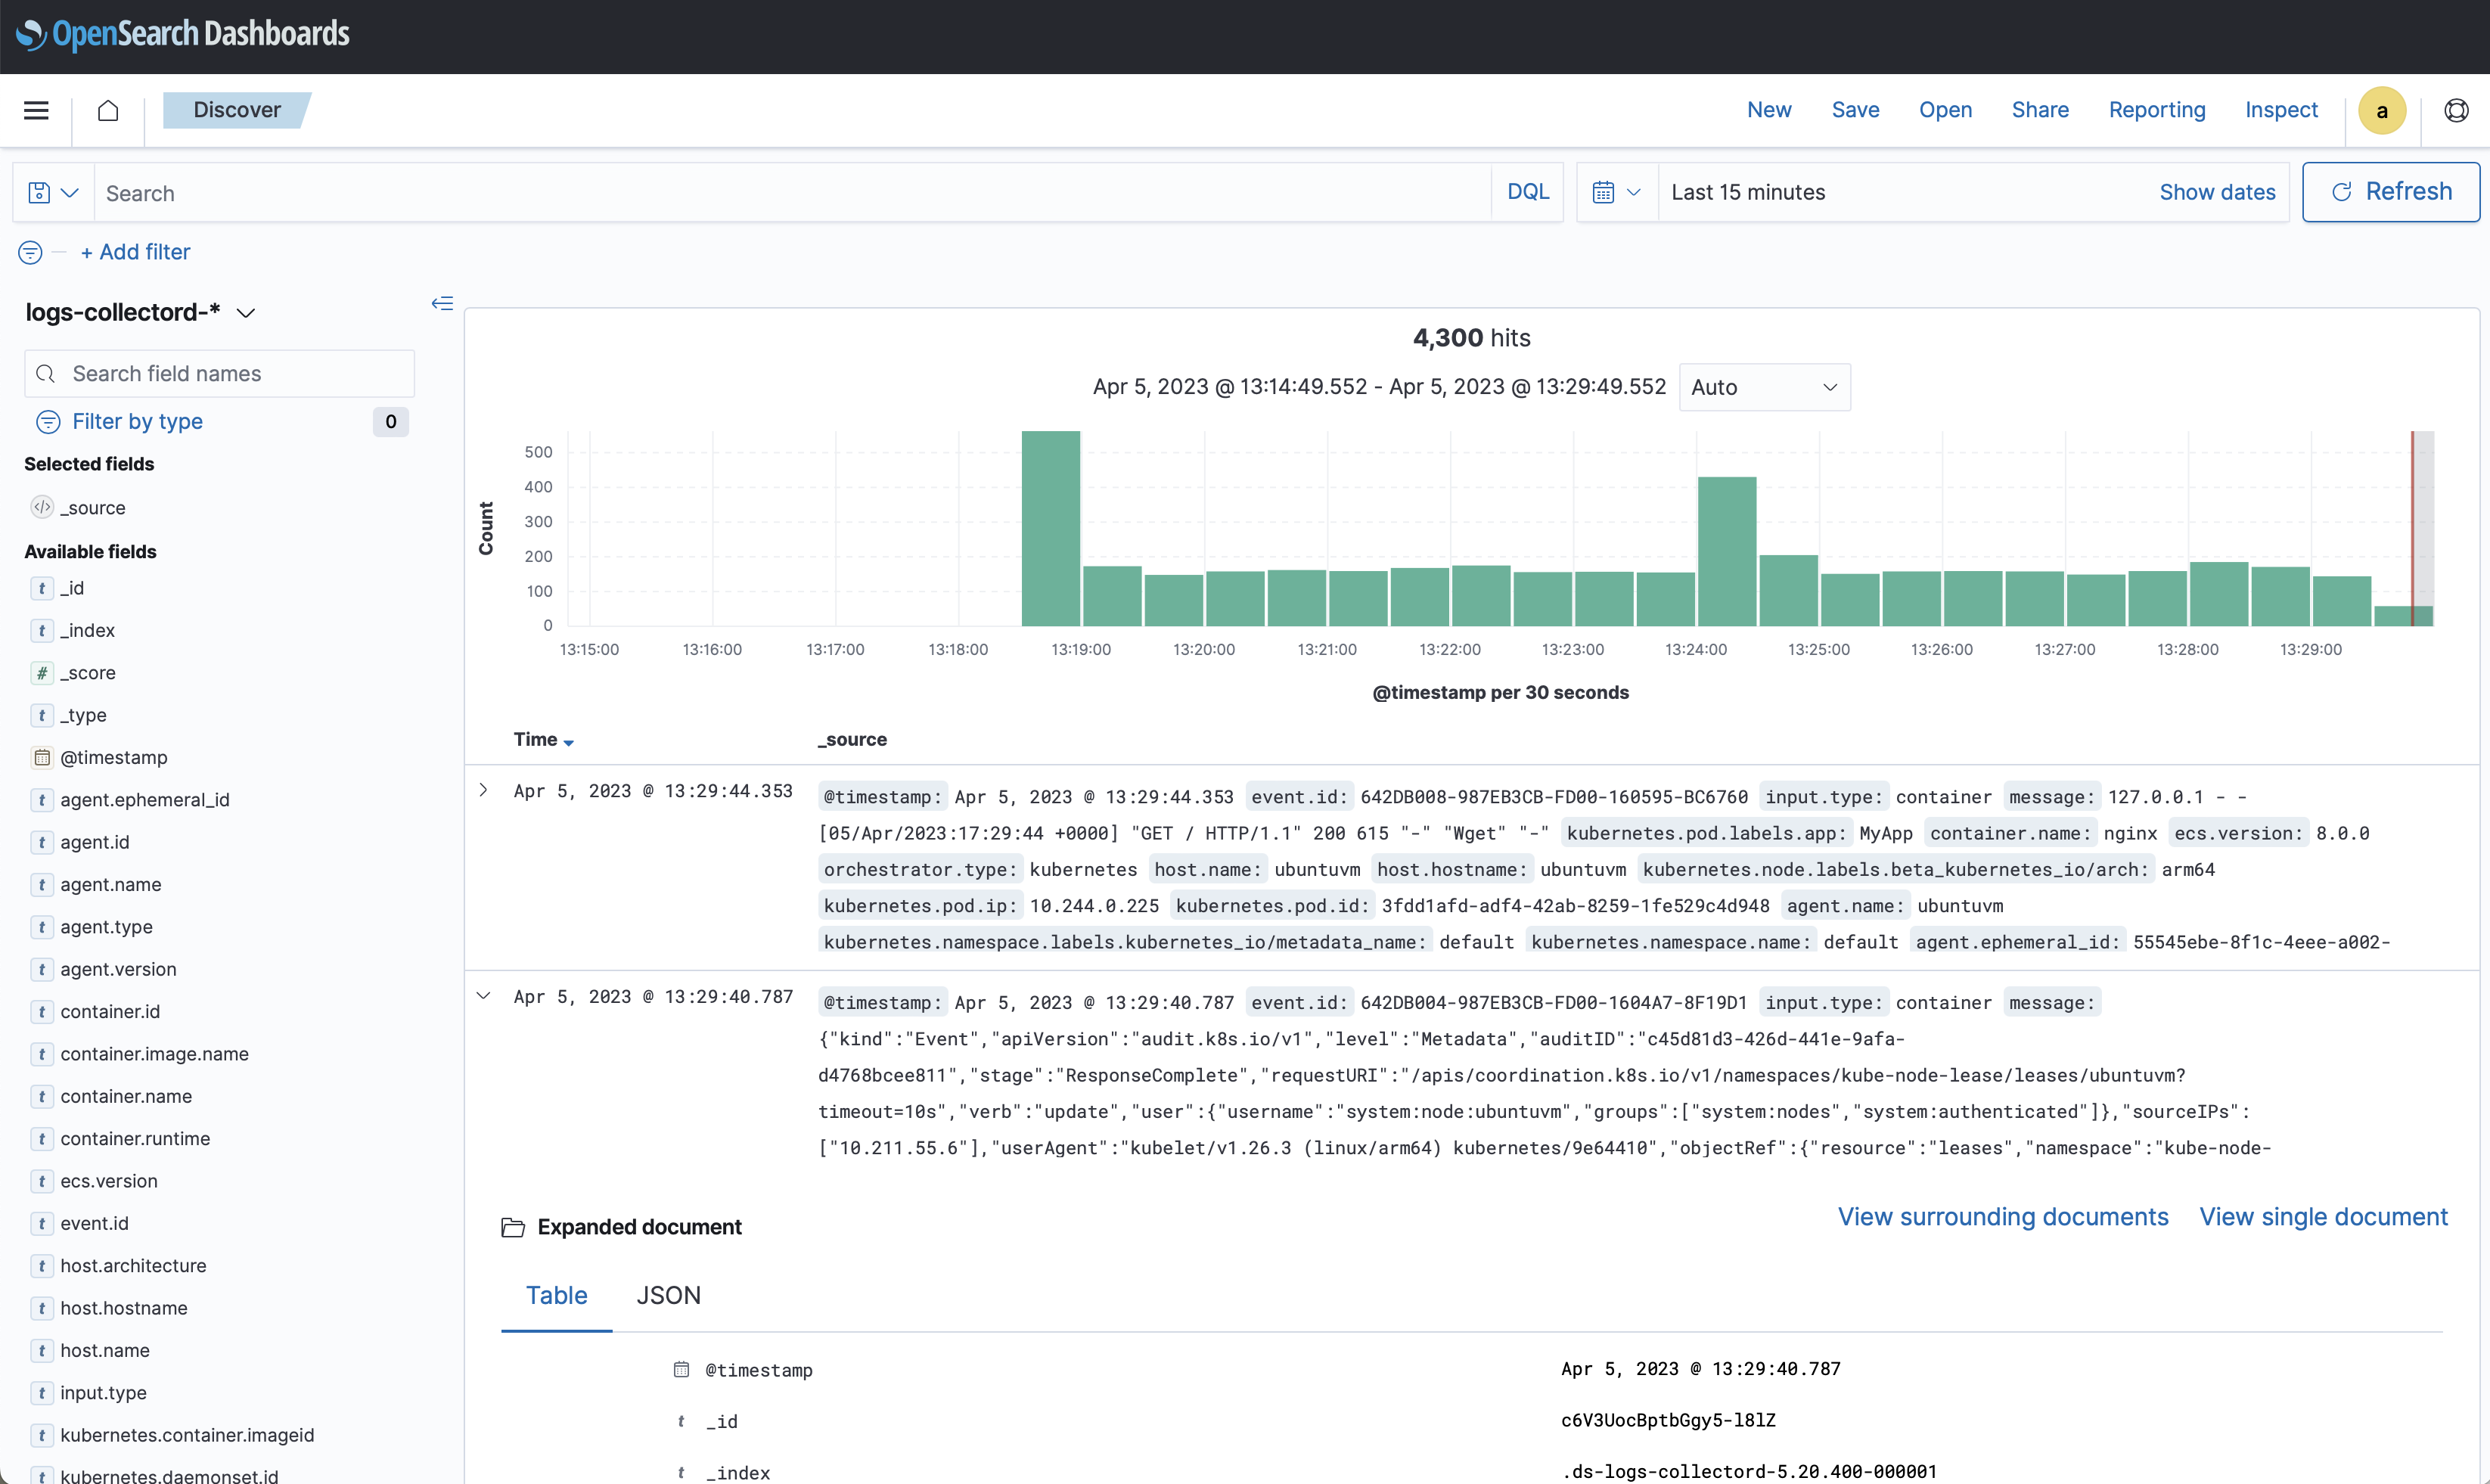
Preview of the OpenSearch Dashboards with logs ingested by Collectord
The following screenshot shows the OpenSearch Dashboards with logs ingested by Collectord.
Extracting fields from the logs and redirecting to custom data streams
With Collectord annotations you can configure field extractions and redirect logs to a different data stream.
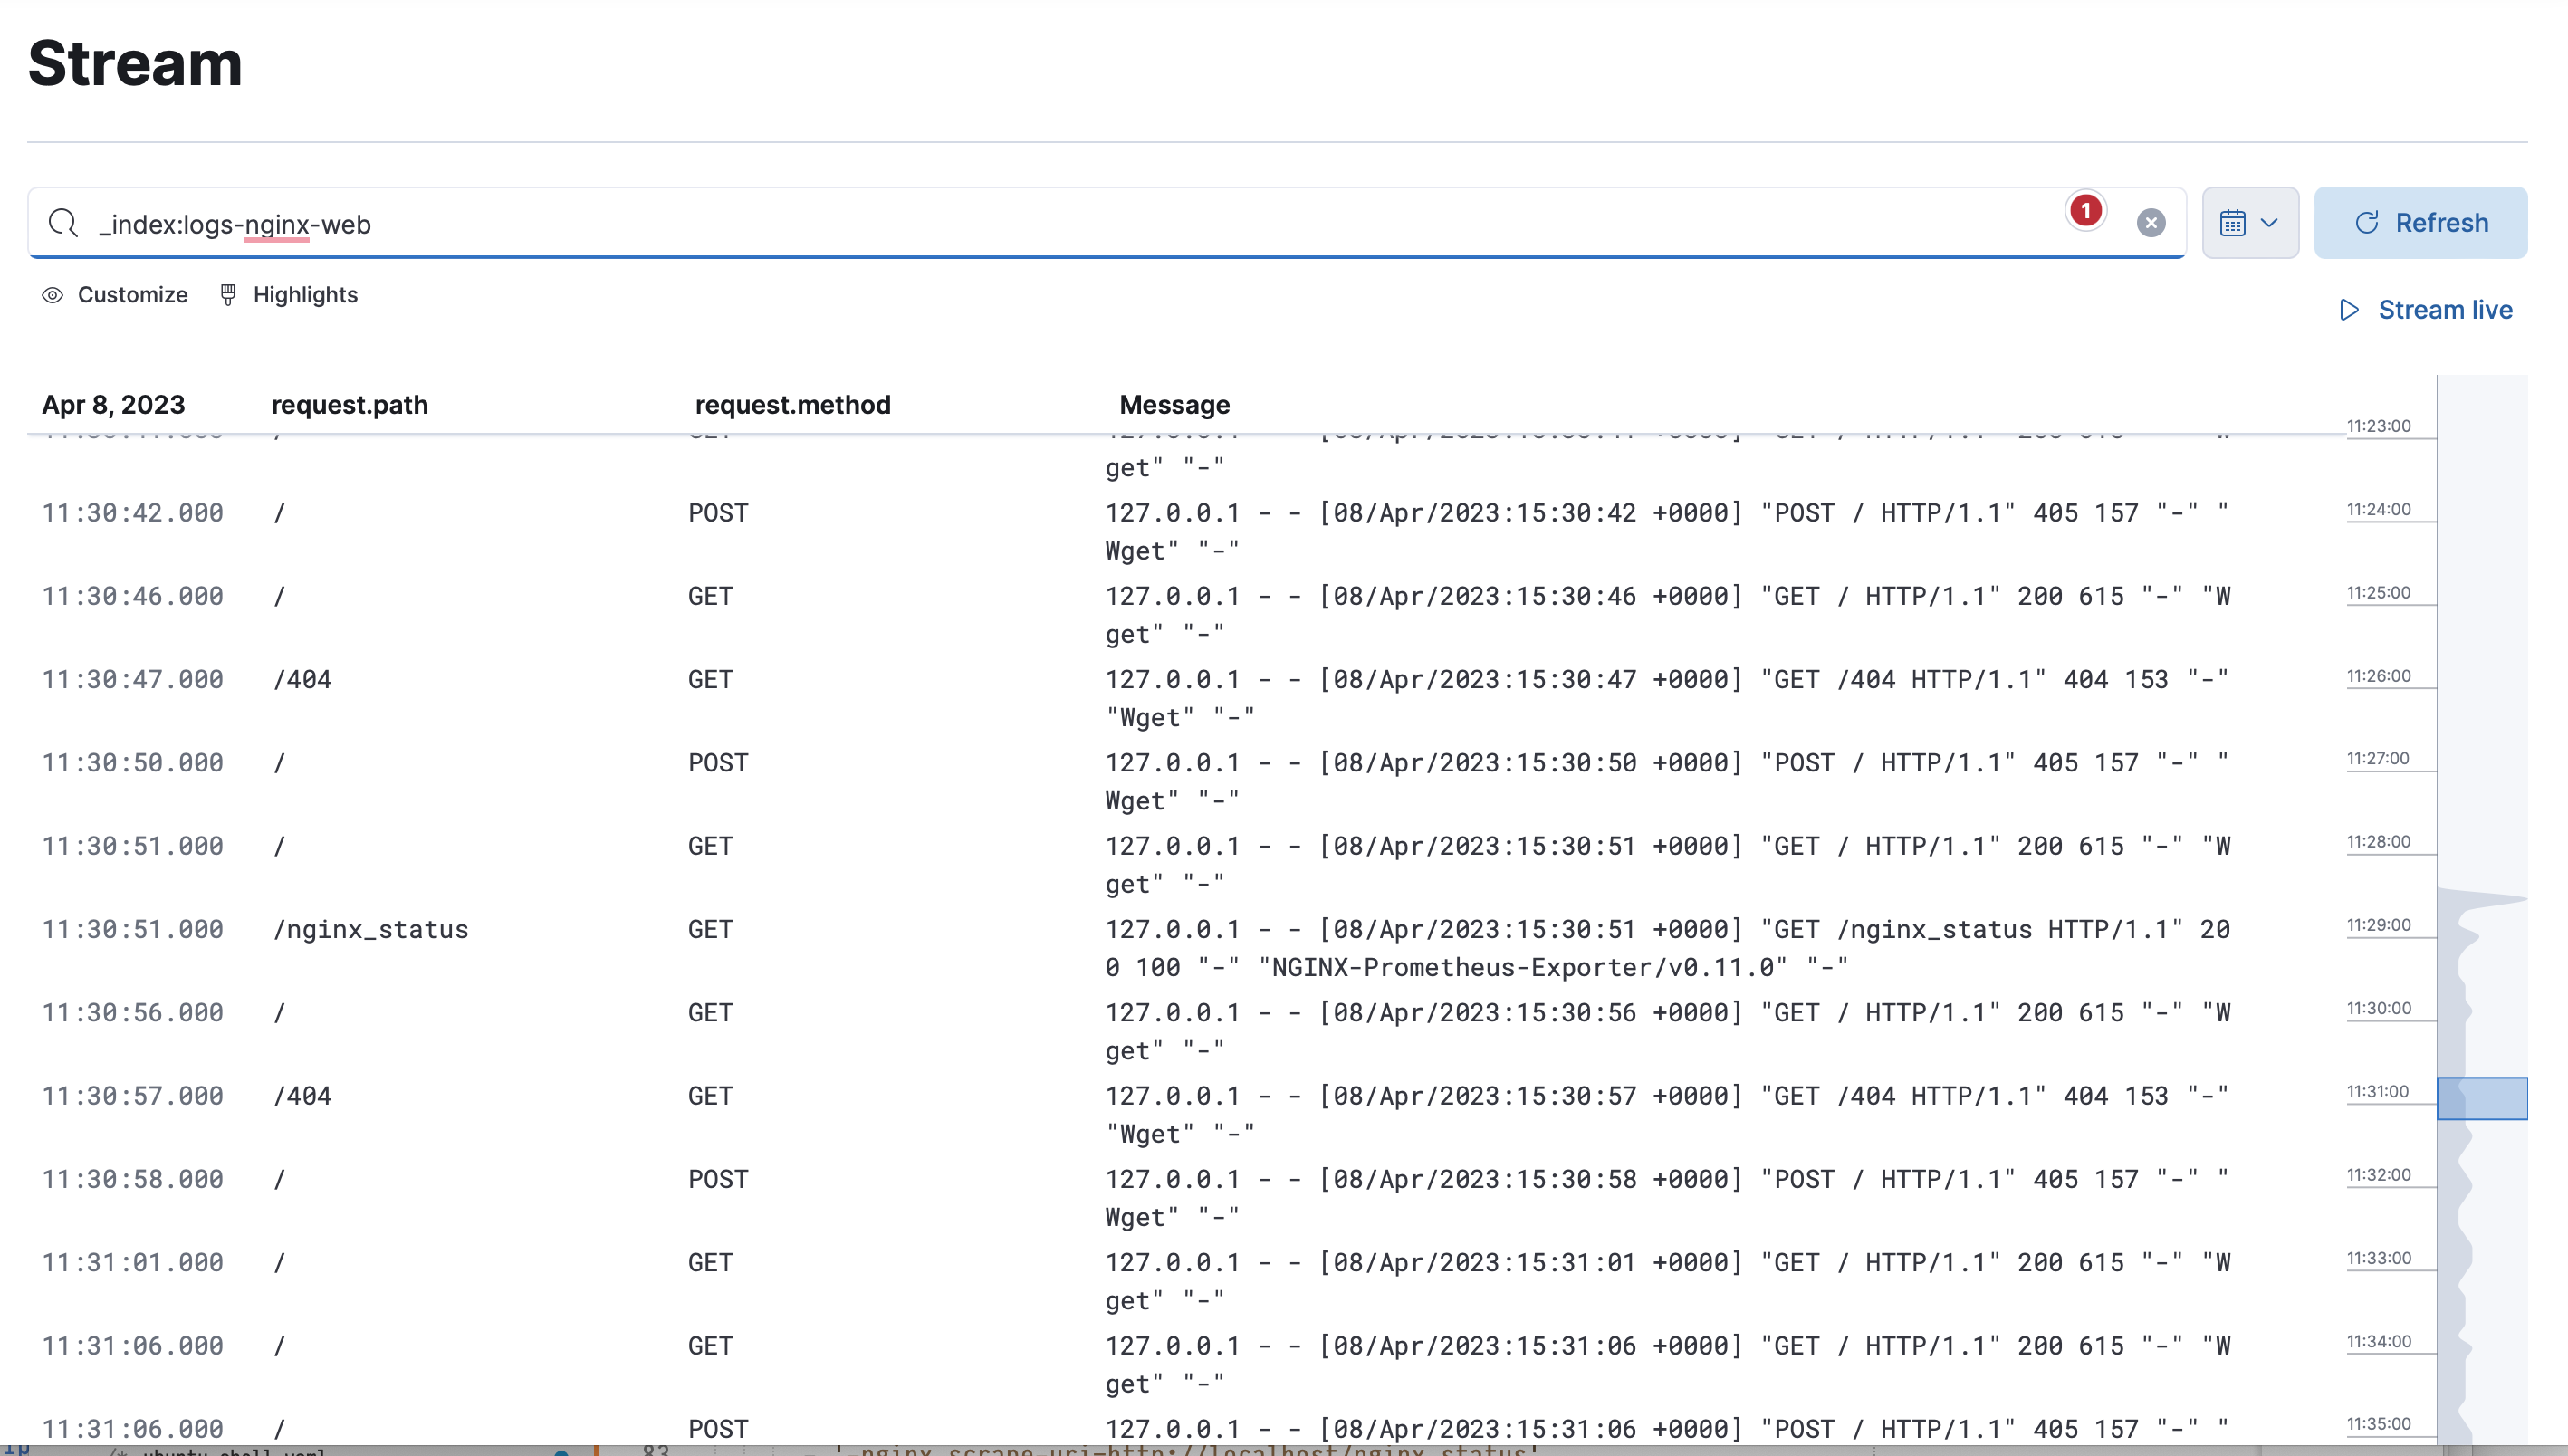
In our example, we have configured an nginx pod running.
First, since we will extract some additional fields, we will create a new data stream called logs-nginx-web.
To do that, first we will download the default index template created by Collectord and add additional fields.
1curl -k -u elastic:elastic https://localhost:9200/_index_template/logs-collectord-5.20.400 | jq '.index_templates[].index_template' > default.jsonIn the default.json file we will change the index_patterns to logs-nginx-web and add additional fields to the mappings.properties section.
 1"request": {
 2  "properties": {
 3    "remote_addr": {"type": "ip"},
 4    "remote_user": {"ignore_above": 1024, "type": "keyword"},
 5    "method": {"ignore_above": 1024, "type": "keyword"},
 6    "path": {"ignore_above": 1024, "type": "keyword"},
 7    "http_referer": {"ignore_above": 1024, "type": "keyword"},
 8    "http_user_agent": {"ignore_above": 1024, "type": "keyword"}
 9  }
10},
11"response": {
12  "properties": {
13    "status": {"type": "long"},
14    "body_bytes": {"type": "long"}
15  }
16}
For the Pod we will add the following annotations:
Important detail:
__is used to create nested fields in Elasticsearch, so therequest__remote_addrwill be converted torequest.remote_addrin Elasticsearch.
 1apiVersion: v1
 2kind: Pod
 3metadata:
 4  name: nginx-pod
 5  annotations:
 6    elasticsearch.collectord.io/stdout-logs-extraction: '^((?P<request__remote_addr>[\d.]+)\s+(?P<request__remote_user>-|\w+) -\s+\[(?P<timestamp>[^\]]+)\]\s+"(?P<request__method>[^\s]+)\s(?P<request__path>[^\s]+)\s(?P<request__type>[^"]+)"\s+(?P<response__status>\d+)\s+(?P<response__body_bytes>\d+)\s+"(?P<request__http_referer>[^"]*)"\s+"(?P<request__http_user_agent>[^"]*)" "-")$'
 7    elasticsearch.collectord.io/stdout-logs-timestampfield: timestamp
 8    elasticsearch.collectord.io/stdout-logs-timestampformat: '02/Jan/2006:15:04:05 -0700'
 9    elasticsearch.collectord.io/stdout-logs-index: 'logs-nginx-web'
10# ...
After that we can review the logs in the Elasticsearch Dashboards.
If you define a mapping incorrectly, the events that could not be indexed will be redirected to the data stream defined
under [output.elasticsearch] in the field dataStreamFailedEvents and you will see WARN in Collectord logs similar to
1WARN 2023/04/08 11:53:16.679396 outcoldsolutions.com/collectord/pipeline/output/elasticsearch/output.go:322: thread=1 datastream="logs-nginx-broken"  first error from bulk insert: item create failed with status 400 (failed to parse field [request.remote_addr] of type [long] in document with id 'iwySYYcB8kxjWZpbYyHp'. Preview of field's value: '127.0.0.1')
2WARN 2023/04/08 11:53:16.679426 outcoldsolutions.com/collectord/pipeline/output/elasticsearch/output.go:333: thread=1 datastream="logs-nginx-broken"  response contains errors, 3 events failed to be indexed, posting to logs-collectord-failed-5.20.400
Forwarding logs from Persistent Volumes
Collectord can forward logs from Persistent Volumes without any additional deployments on the cluster.
To do that you can just add a simple annotation to the Pod
elasticsearch.collectord.io/volume.1-logs-name: 'logs' where logs is the name of the volume. In the example
below we also use some existing features of Collectord to extract fields from the logs, especially the proper timestamp.
Additionally we use some new features of Collectord to match files by a glob pattern, where we use the {{kubernetes.pod.name}} variable,
and store the acknowledgement database on the Persistent Volume, so when it is getting attached to other host, the logs will be forwarded
from the last acknowledged position.
 1apiVersion: v1
 2kind: Pod
 3metadata:
 4  name: postgres-pod0
 5  annotations:
 6    elasticsearch.collectord.io/volume.1-logs-name: 'logs'
 7    elasticsearch.collectord.io/volume.1-logs-glob: '{{kubernetes.pod.name}}/*.log'
 8    elasticsearch.collectord.io/volume.1-logs-extraction: '^(?P<timestamp>\d{4}-\d{2}-\d{2} \d{2}:\d{2}:\d{2}\.\d{3} [^\s]+) (.+)$'
 9    elasticsearch.collectord.io/volume.1-logs-timestampfield: 'timestamp'
10    elasticsearch.collectord.io/volume.1-logs-timestampformat: '2006-01-02 15:04:05.000 MST'
11    elasticsearch.collectord.io/volume.1-logs-timestamplocation: 'Europe/Oslo'
12    elasticsearch.collectord.io/volume.1-logs-onvolumedatabase: 'true'
13spec:
14  containers:
15  - name: postgres
16    image: postgres
17    env:
18      - name: POSTGRES_HOST_AUTH_METHOD
19        value: trust
20    command:
21      - docker-entrypoint.sh
22    args:
23      - postgres
24      - -c
25      - logging_collector=on
26      - -c
27      - log_min_duration_statement=0
28      - -c
29      - log_directory=/var/log/postgresql/postgres-pod0/
30      - -c
31      - log_min_messages=INFO
32      - -c
33      - log_rotation_age=1d
34      - -c
35      - log_rotation_size=10MB
36    volumeMounts:
37      - name: data
38        mountPath: /var/lib/postgresql/data
39      - name: logs
40        mountPath: /var/log/postgresql/
41  volumes:
42  - name: data
43    emptyDir: {}
44  - name: logs
45    persistentVolumeClaim:
46      claimName: myclaim0


