Blog
Monitoring Docker, OpenShift, Kubernetes and Linux - Version 5.21
Version 5.21 of our applications, configurations, and Collectord is now available. In this blog post, we will cover some highlights of the release.
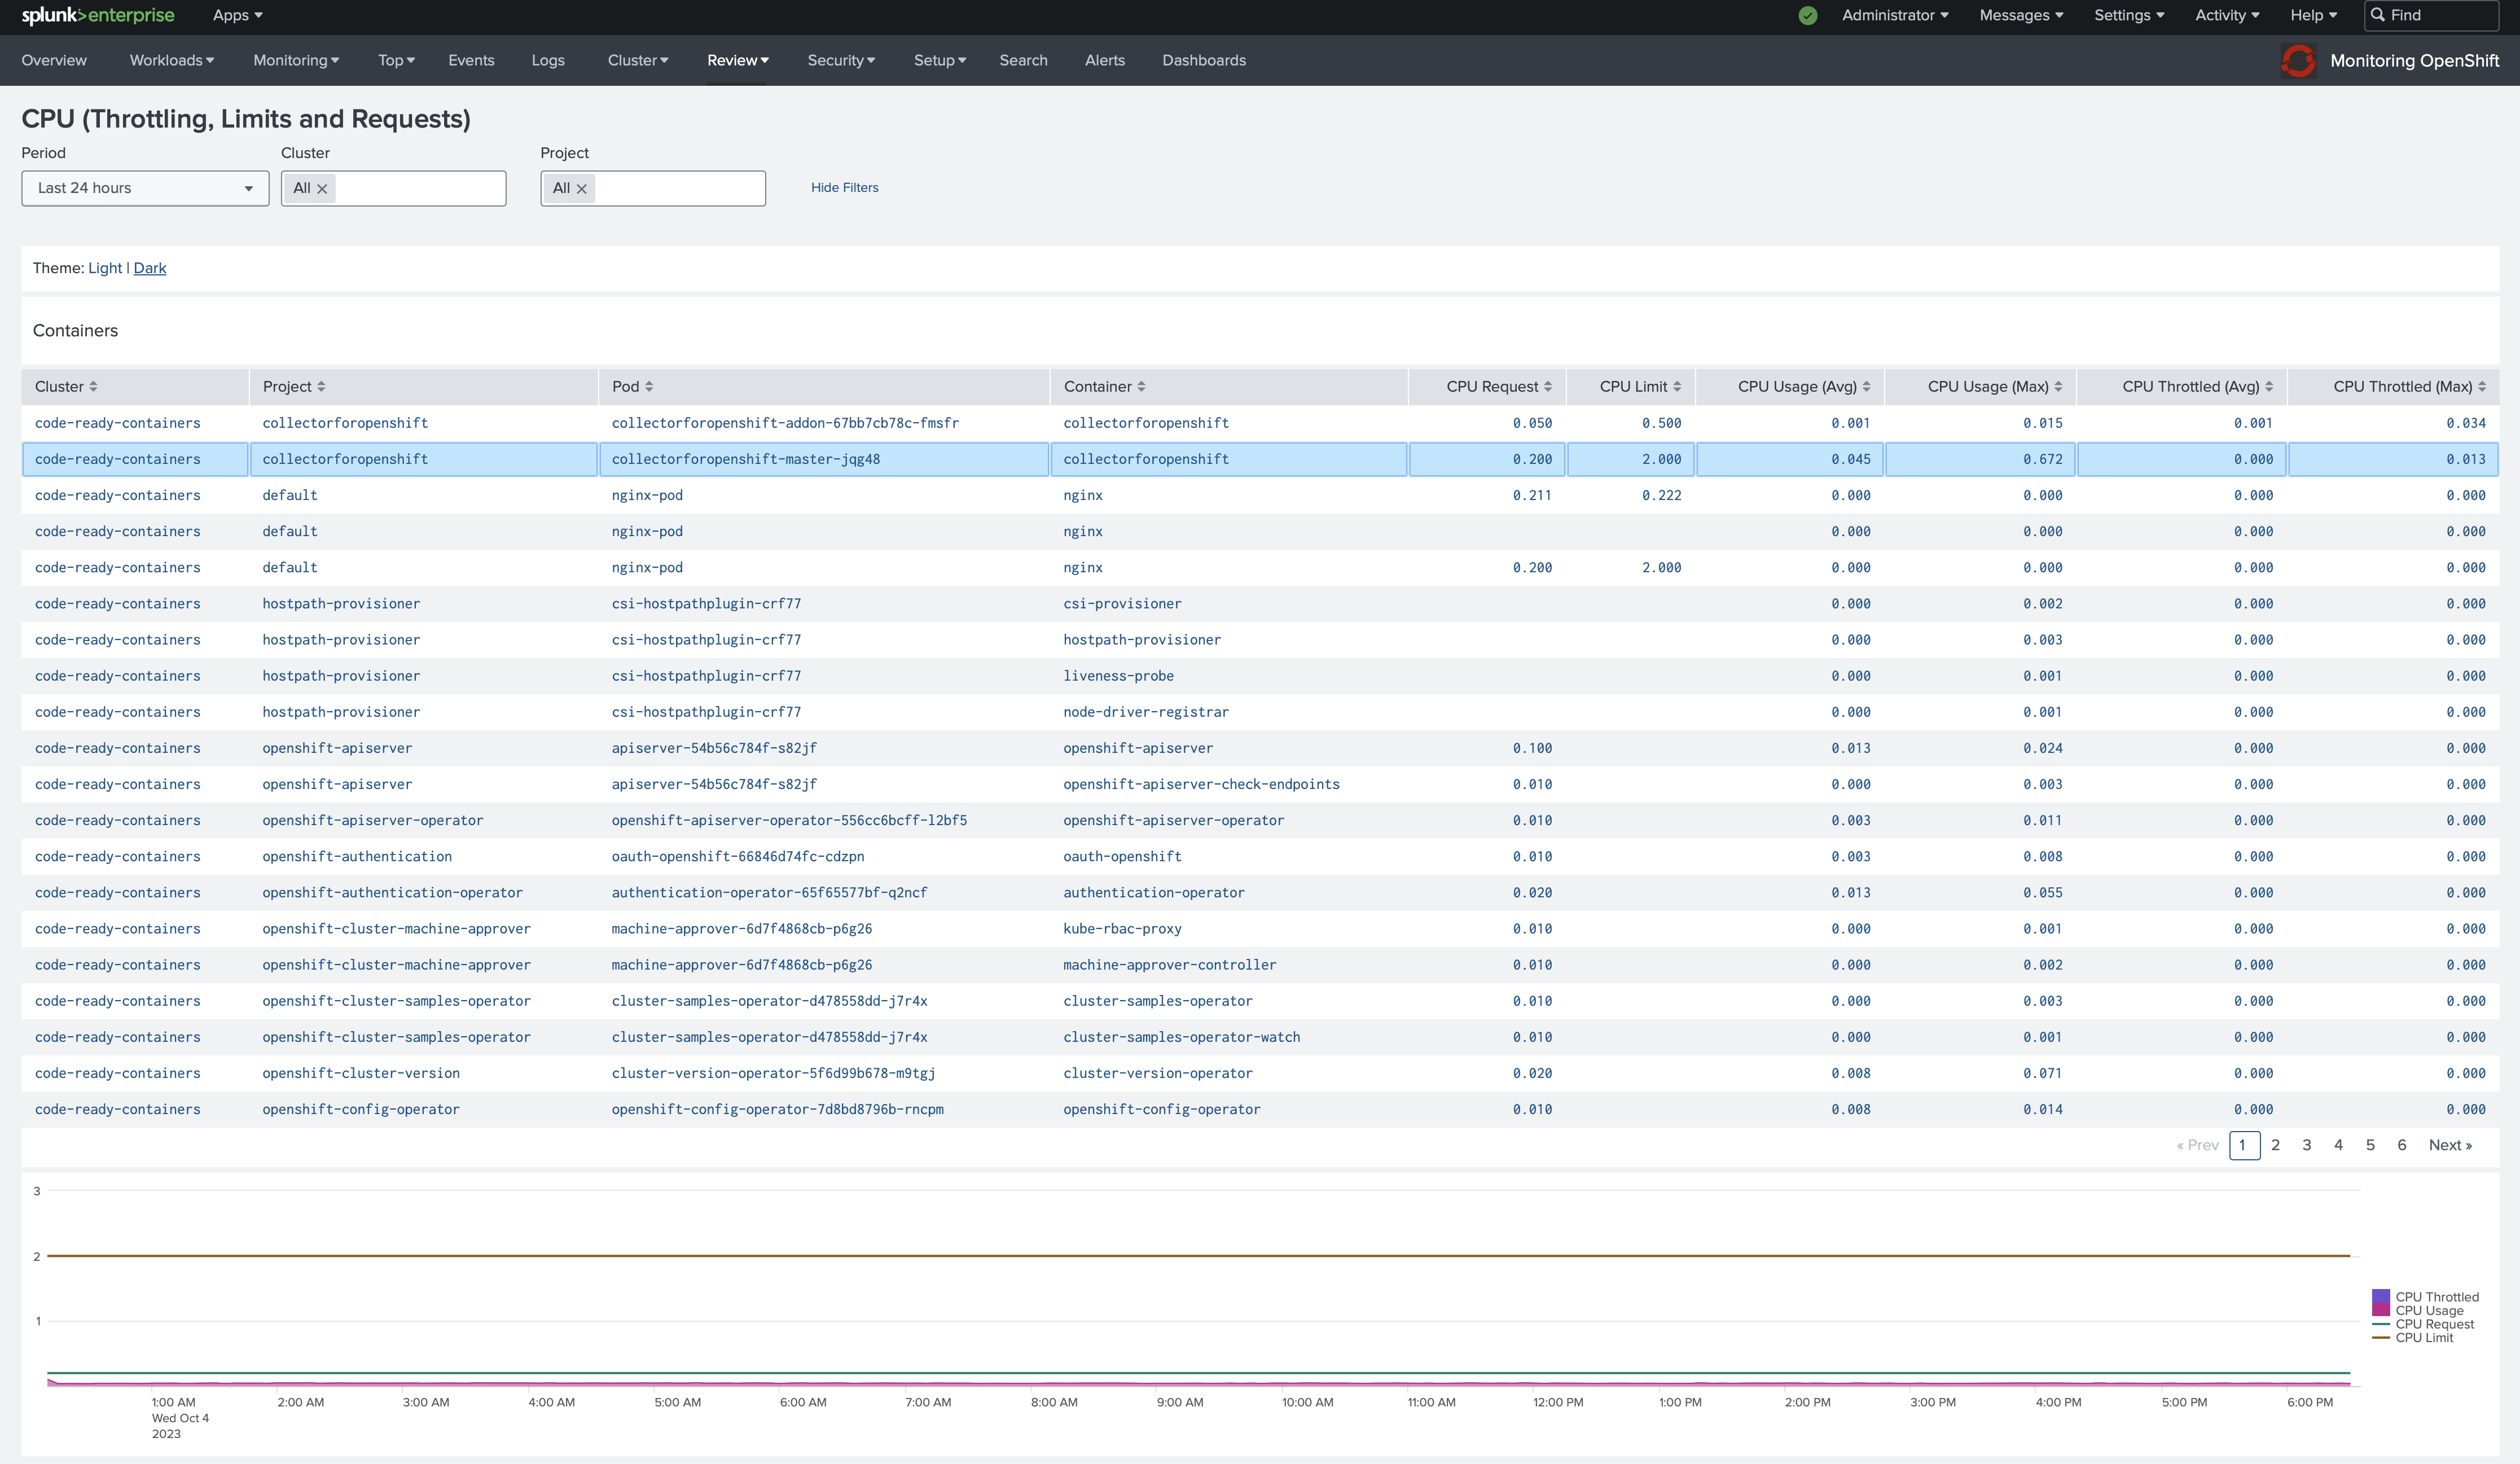
CPU (Throttled, Limits, Requests) dashboard
We have added a new dashboard to the Review dashboards family. This dashboard shows the CPU usage of the containers in the cluster, including configured Limits and Requests and the throttled CPU usage.
This dashboard will help you to properly configure the CPU limits and requests for your containers.
Global sanitization of forwarded logs and events
In this release, we have added a new feature to sanitize the logs and events before forwarding them to the backend. You can configure a global replacement pipe for all the host logs, container logs, and events that are forwarded to the backend.
For example, you can configure searching for all mentions of password= and replace it with password=******** in all the logs and events.
1[pipe.replace::passwords]
2patternRegex = (password=)([^\s]+)
3replace = $1********
Improvements for streaming objects from API Server
Collectord has allowed you to stream objects from the API Server for a long time. And it was pretty easy to configure it to forward the objects only from a specific namespace, but it was not simple to stream all namespaces except a few.
This version brings filtering capabilities for streaming objects from the API server.
For example, you can tell Collectord to stream all the pods except the ones from the namespace0 namespace, or stream
only the pods from the namespace1 and namespace2 namespaces.
1[input.kubernetes_watch::pods]
2# You can exclude events by namespace with blacklist or whitelist only required namespaces
3# blacklist.kubernetes_namespace = ^namespace0$
4# whitelist.kubernetes_namespace = ^((namespace1)|(namespace2))$
Podman support
You can use our Monitoring Docker application and collectorfordocker image to monitor your Podman containers.
Currently, we only support journald as a logging driver. As the k8s-file logging driver does not keep rotated files,
we do not suggest using it in production.
 1podman run -d \
 2    --name collectorforpodman \
 3    --volume /:/rootfs:ro \
 4    --volume collector_data:/data/ \
 5    --cpus=2 \
 6    --cpu-shares=1024 \
 7    --memory=512M \
 8    --restart=always \
 9    --env "COLLECTOR__SPLUNK_URL=output.splunk__url=..." \
10    --env "COLLECTOR__SPLUNK_TOKEN=output.splunk__token=..."  \
11    --env "COLLECTOR__SPLUNK_INSECURE=output.splunk__insecure=true"  \
12    --env "COLLECTOR__EULA=general__acceptLicense=true" \
13    --env "COLLECTOR__LICENSE_KEY=general__license=..." \
14    --env "COLLECTOR__GENERALPODMAN_URL=general.docker__url=unix:///rootfs/var/run/podman/podman.sock" \
15    --env "COLLECTOR__GENERALPODMAN_STORAGE=general.docker__dockerRootFolder=/rootfs/var/lib/" \
16    --ulimit nofile=1048576:1048576 \
17    --privileged \
18    outcoldsolutions/collectorfordocker:{{ collectorfordocker_version }}
Other major changes
- Compatibility updates for the latest version of Kubernetes, OpenShift and Docker
- Allows you to configure time precision for events forwarded to Splunk, default is milliseconds, but you can change it to microseconds or nanoseconds
- Automatically refresh Kubernetes API Token if it is expired
- Upgrade libraries to debian:bookworm, Go runtime to 1.21.3, and SQLite to 3.43.1
- Show UDP connections in network socket tables
- Monitoring Linux upgraded to the latest version of Collectord
To review all the changes, you can follow one of the Release notes links below.
Links
You can find more information about other minor updates by following the links below.
Release notes
- Monitoring OpenShift - Release notes
- Monitoring Kubernetes - Release notes
- Monitoring Docker - Release notes


