Blog
Check Splunk search logs, just in case
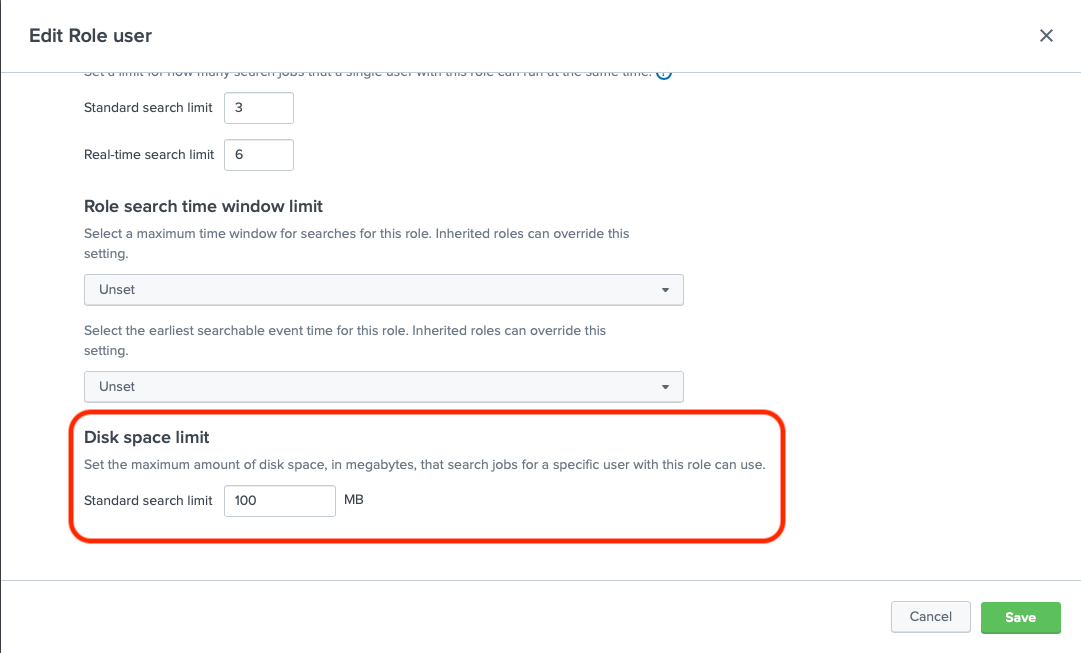
We have been working on an interesting case with one of our customers. Every role in Splunk has a defined disk limit,
and by default the user role has only 100MB.
We are always cautious about how much data we bring to Splunk Dashboards and limit everything to make sure our applications can handle large clusters in our applications.
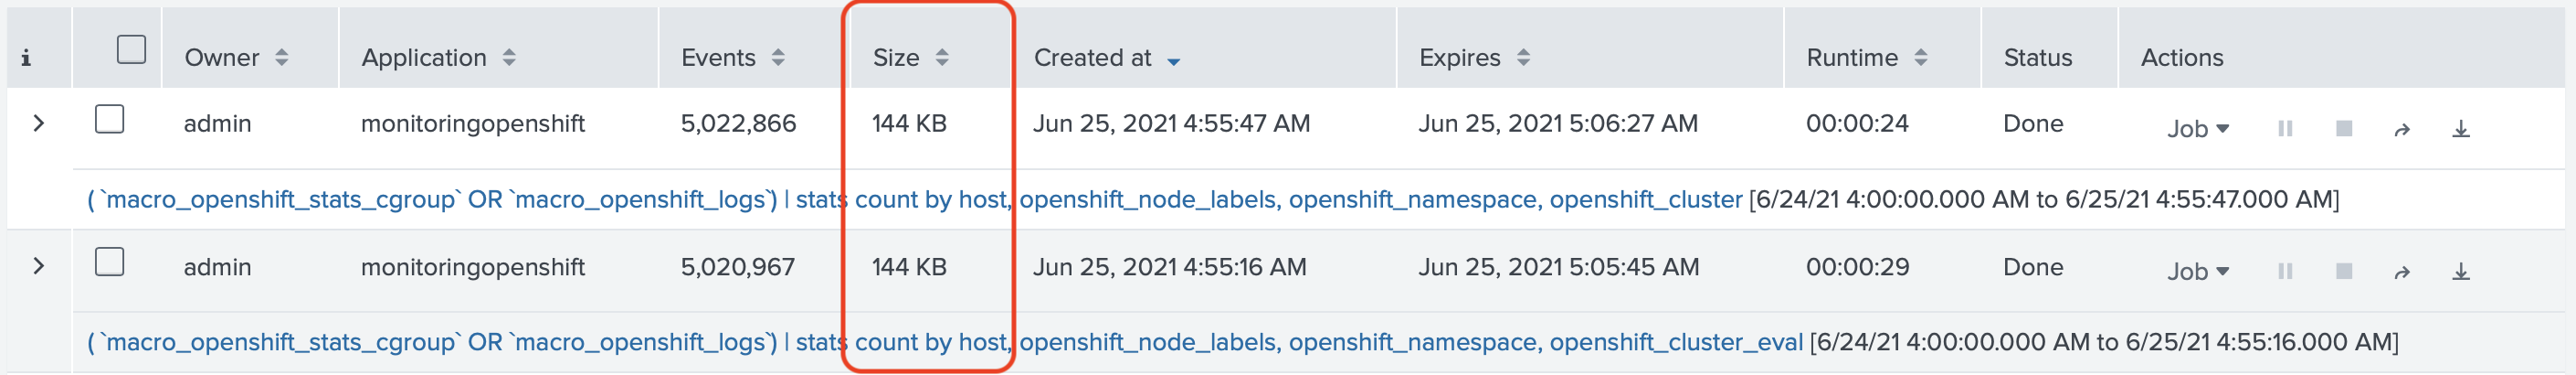
One search that was causing an issue was a search used to populate filters in various places of our “Monitoring OpenShift” application. Depending on the number of nodes, namespaces and labels, we expect this search to return many thousands of values, but should not take a lot of disk space.
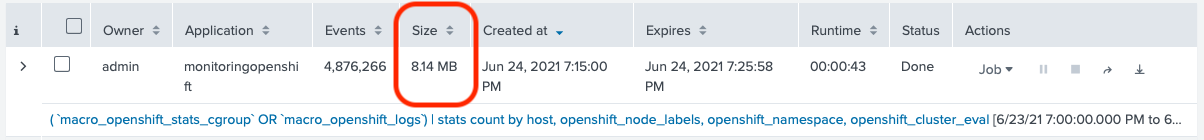
1( `macro_openshift_stats_cgroup` OR `macro_openshift_logs`) |
2stats count by host, openshift_node_labels, openshift_namespace, openshift_cluster_eval
This search generated ~1,000 rows on our test cluster, but took almost 10 MB of disk space. In the customer’s environment,
we were dealing with hundreds of MBs on disk, which is very unusual.
The simple change to a simplified search would bring the disk space to just several MBs, instead of hundreds.
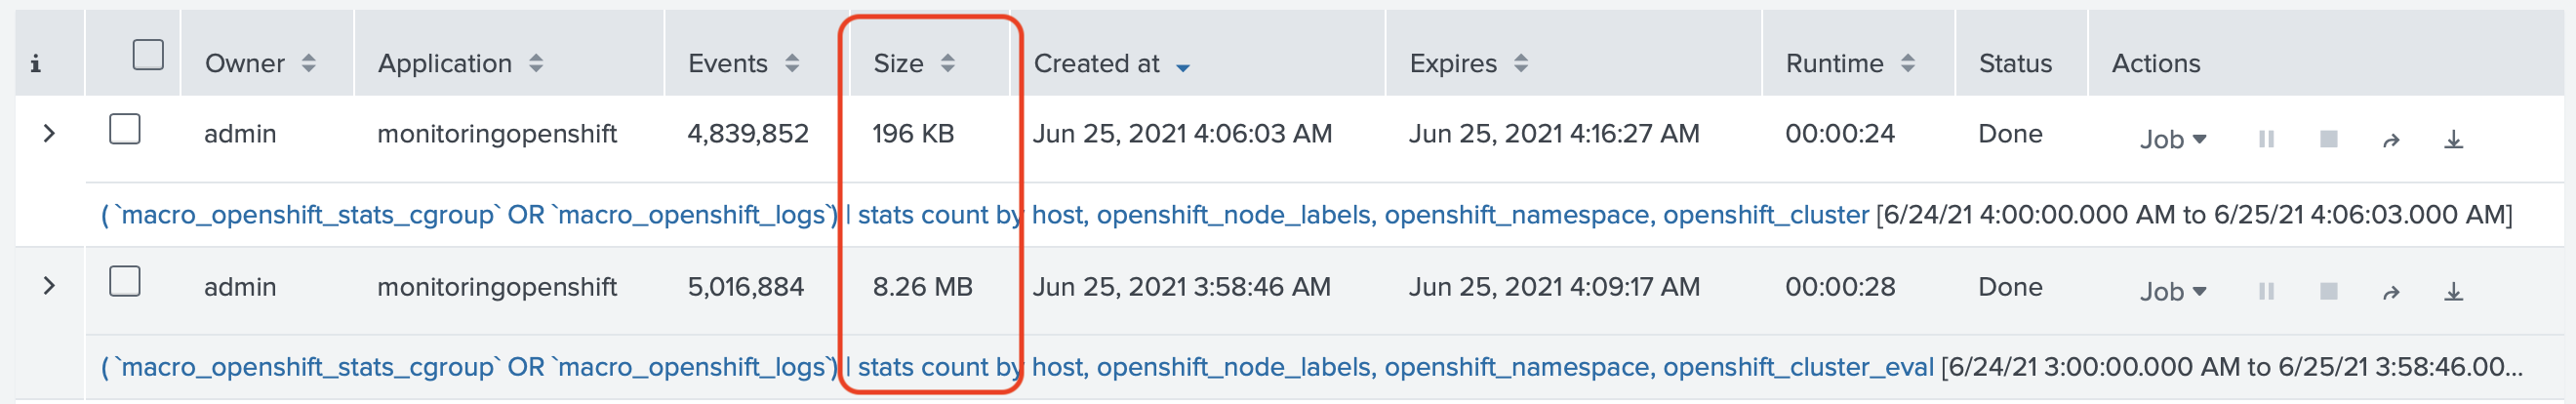
1( `macro_openshift_stats_cgroup` OR `macro_openshift_logs`) |
2stats count by host, openshift_node_labels, openshift_namespace, openshift_cluster
The difference between the first search and the second one is the usage of the openshift_cluster_eval field, which is
a calculated field that looks first at an indexed field openshift_cluster and if there is no value there, it will look
in openshift_node_labels for the cluster field (for backward compatibility).
Considering that those searches return the same results, something was very odd about that. On our test cluster
one search would take 8.26MB and another 196KB (the difference is 42 times)
When you inspect the Job (Search), you can find a Job ID
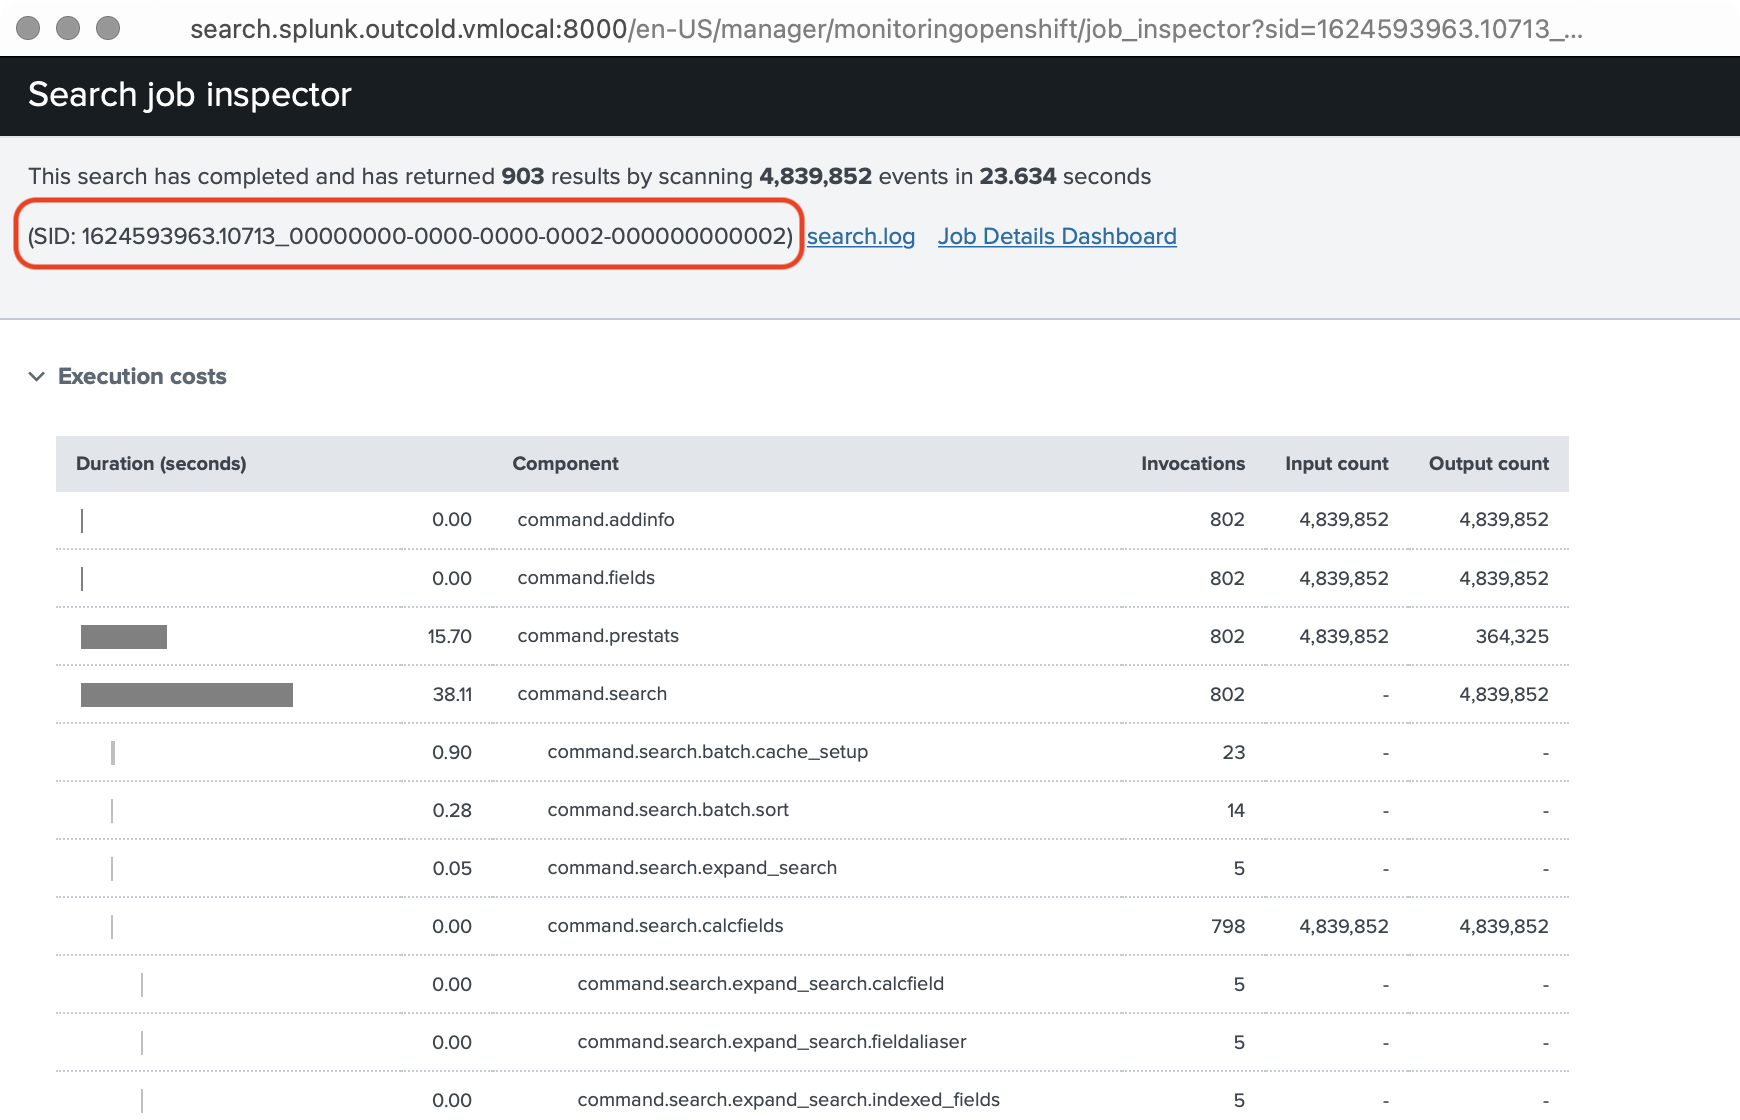
Using this SID, you can find a folder on the Search Head, that represents it. It will be under $SPLUNK_HOME/var/run/splunk/dispatch,
so we looked into it
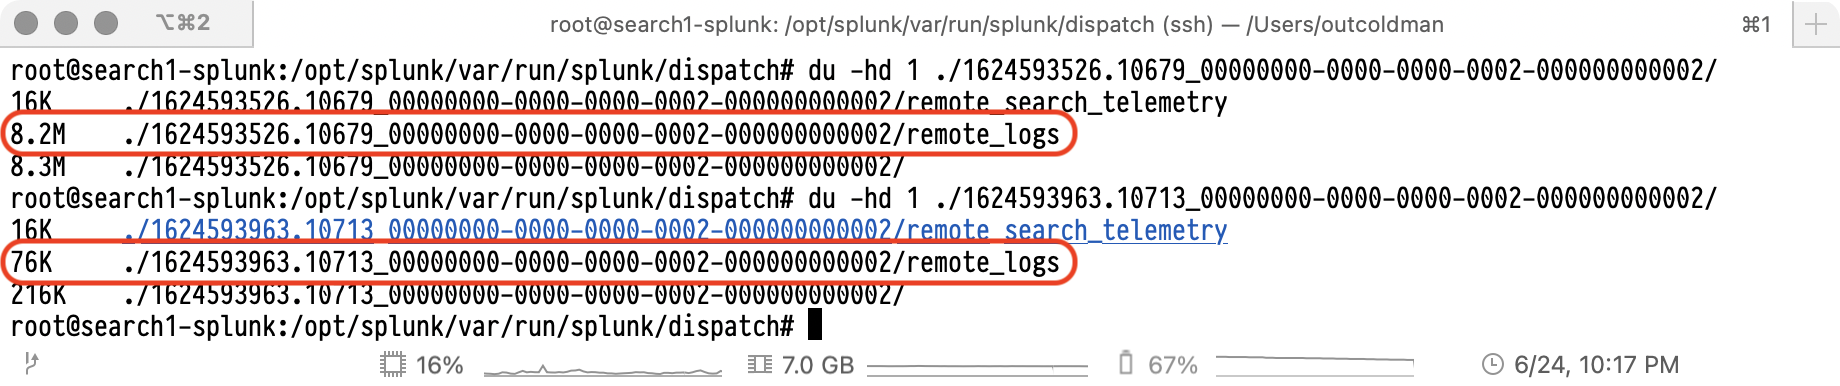
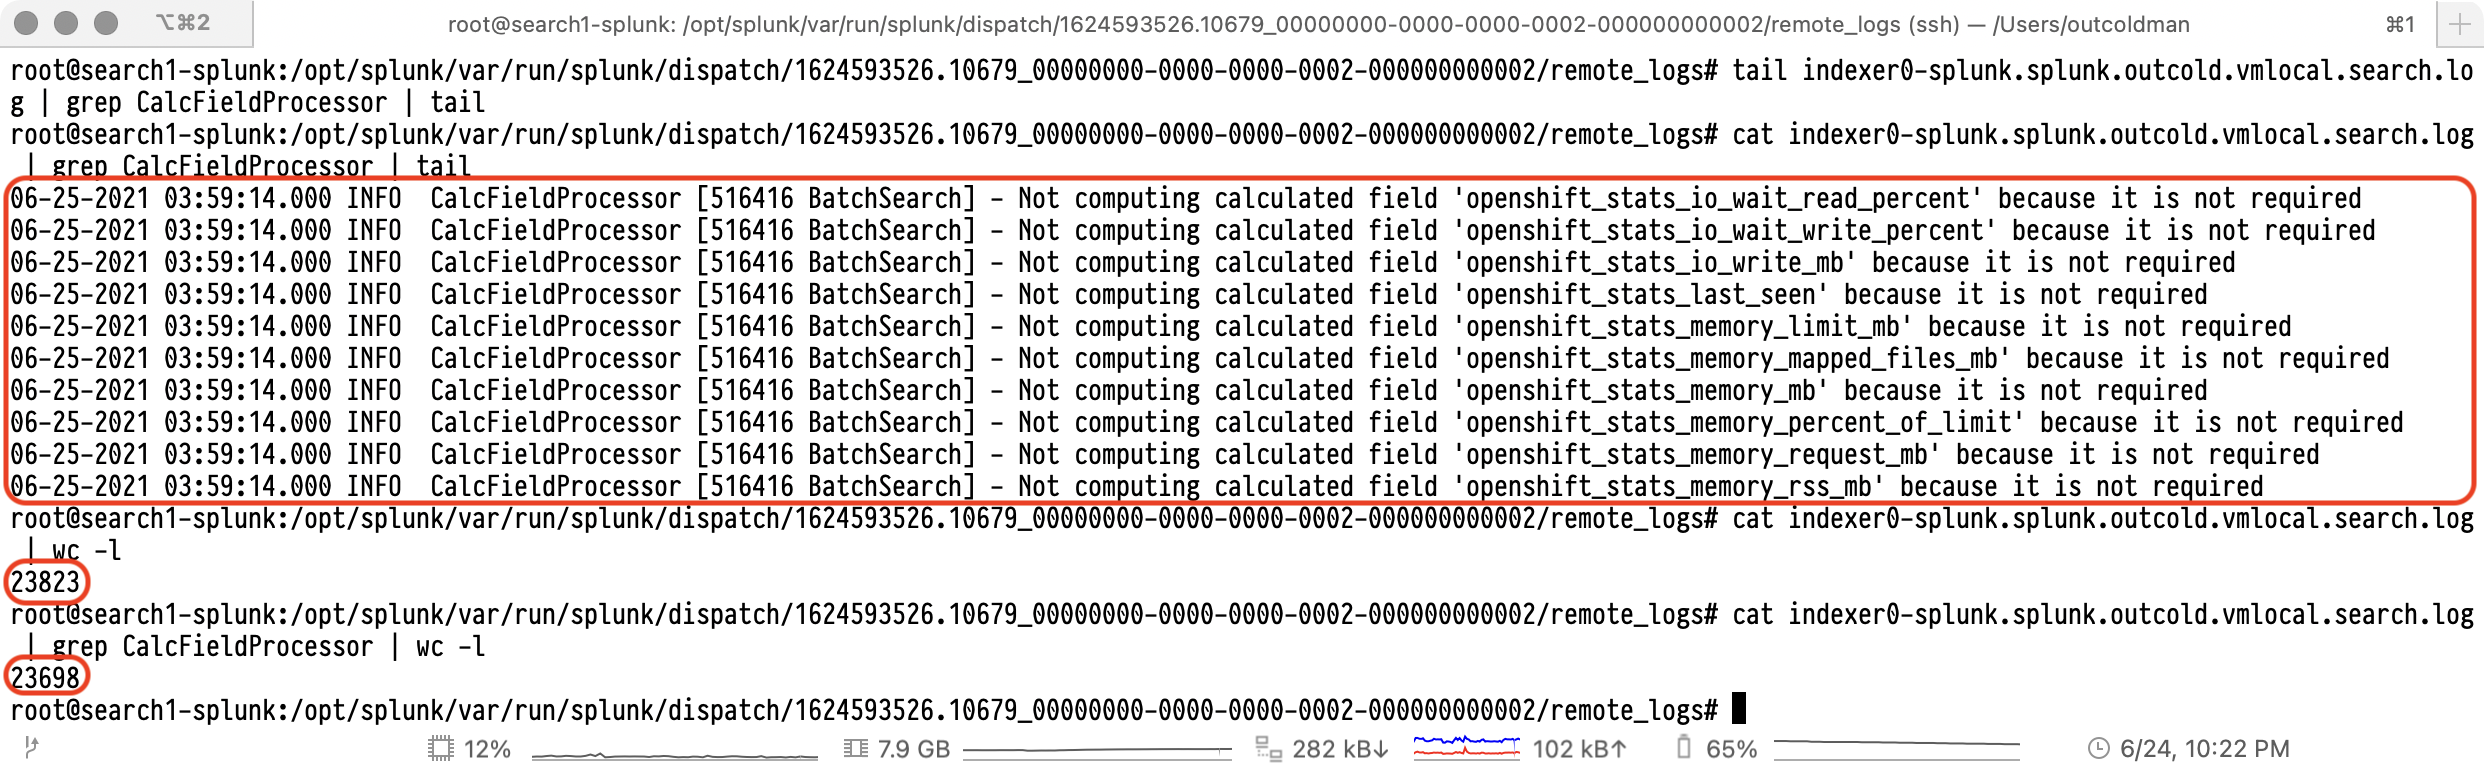
As you can see the difference between those two searches is just the size of the remote_logs folder. After some digging
in those logs, we saw many repeating INFO messages that some of the calculated fields will be ignored, which is
expected, but we definitely did not expect that it would clog the search logs.
If you look at the Splunk documentation, you will find some information about Splunk logging, see
Troubleshooting Manual-Enable debug logging.
The logs we are looking at are part of the search process, not the Splunk daemon, so the configurations would be in
the $SPLUNK_HOME/etc/log-searchprocess.cfg. Considering that in our case we have a Splunk cluster with a Search Head
cluster and an Indexer cluster, the searches are scheduled on indexers, so if we want to remove those INFO messages, we need
to modify the configuration on the indexers.
If you look at the default configuration on the $SPLUNK_HOME/etc/log-searchprocess.cfg you will find
1rootCategory=INFO,searchprocessAppender
2appender.searchprocessAppender=RollingFileAppender
3appender.searchprocessAppender.fileName=${SPLUNK_DISPATCH_DIR}/search.log
4appender.searchprocessAppender.maxFileSize=10000000 # default: 10MB (specified in bytes).
5appender.searchprocessAppender.maxBackupIndex=3
This means that all non-overridden categories will get by default a value INFO. The maximum size of the logs would
be 30 MB (3 files of the maximum size of 10 MB each). So if you have 10 indexers, those logs could grow for each
search up to 300 MB.
There are two ways to fix this. First, we can override the values for a specific category, in our case it was CalcFieldProcessor,
so we can create a file $SPLUNK_HOME/etc/log-searchprocess-local.cfg with a content
1category.CalcFieldProcessor=WARNThe second option is to override the default log level for all categories with the file $SPLUNK_HOME/etc/log-searchprocess-local.cfg
and content
1rootCategory=WARN,searchprocessAppenderAfter we applied those changes, we saw that searches are not taking so much space on the disk.
One important detail: if you are using Splunk Cloud, you would not have access to the Splunk File System. To find if you are affected by the same issue, you can run the search, go to the Job Inspector, scroll to the very bottom and expand Search Job Properties, scroll all the way down, and at the bottom of that page you can find log files from the indexers, so you can download them and see if there is anything that clogs the search logs.
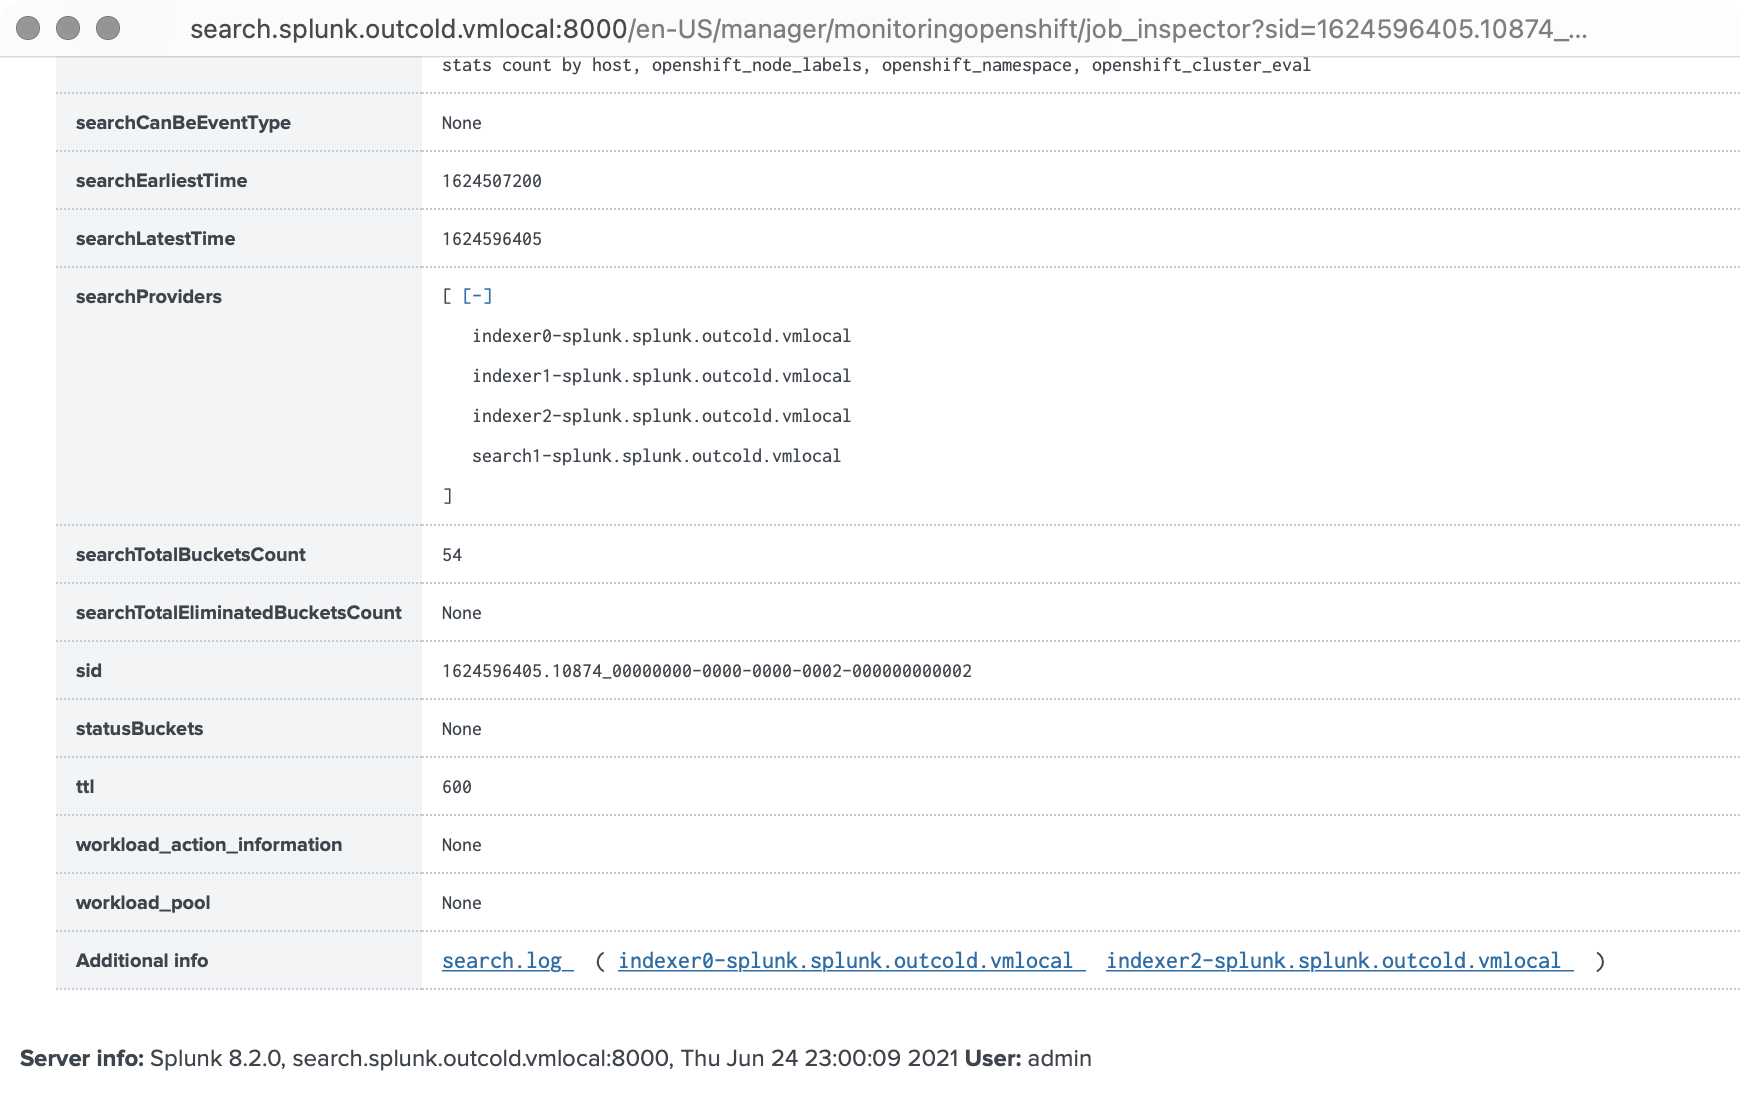
If you see that those logs take a lot of space, talk to Splunk Support and ask them to make the configurations on the indexers in your Splunk Cloud cluster.


