Blog
Configuring Splunk HTTP Event Collector for performance
In this blog post, we will show you how you can configure your ingesting pipeline with Splunk HTTP Event Collector to get the best performance of your Splunk Configuration. We will focus on which metrics to monitor and suggestions about when you need to Scale your Splunk deployments.
UPDATE:
The amount of data forwarded by day was incorrect (we lost multiplier of 60). It should be
~2.5TiB/day,~5TiB/day,~10TiB/day.The official name is Splunk Heavy Forwarder (Splunk HF), not a Splunk Heavy-Weight Forwarder (Splunk HWF)
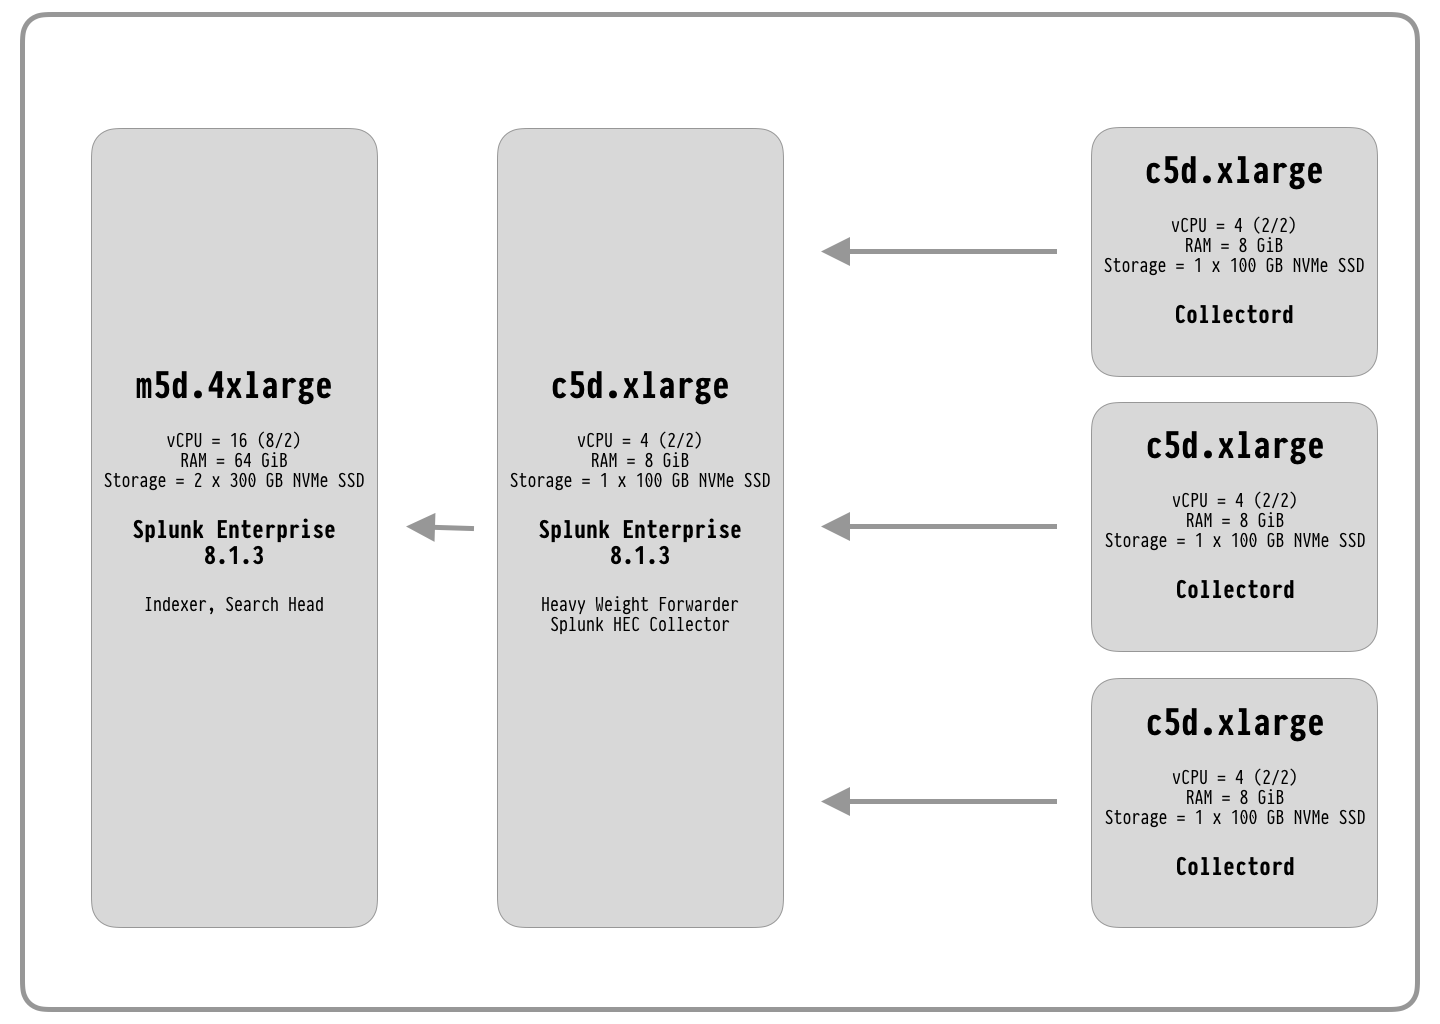
This test will use Splunk Enterprise (the latest version at the current moment, 8.1.3)
as a single Splunk instance that will perform as an indexer and search head. Additionally,
in the beginning, we will install one Splunk Heavy Forwarder with Splunk HTTP Event
Collector configured on this instance. Later we will show you how to scale the Splunk HF tier.
We will perform all our tests on Amazon Web Services, EC2 instances running Amazon Linux 2 (~ CentOS 7).
For ingesting data, we will use Collectord deployed on Docker. In this diagram, we show the architecture that we started working with.
Test Run 1. Default Configurations
We will start with the default configurations. To perform this test, we configured:
- Data receiving on Splunk Indexer
- Data forwarding without storing a copy of the data on Splunk Heavy Forwarder
- Splunk HTTP Event Collector on Splunk Heavy Forwarder
- Installed Docker version 20.10.4 on worker nodes
- Installed Collectord on Worker nodes with the default configurations
- To perform the test, we run on each Worker node ten copies of the following container.
1docker run --rm -d docker.io/mffiedler/ocp-logtest:latest python ocp_logtest.py --line-length=1024 --num-lines=600000 --rate 60000 --fixed-lineThis test runs for about 10 minutes.
A single container with this configuration generates 1,000 events per second with a size of
1KiB each. In total, we are forwarding approximately 10MiB/sec of data from a single worker.
In total, Splunk receives 30MiB/sec of data (~2.47TiB/day).
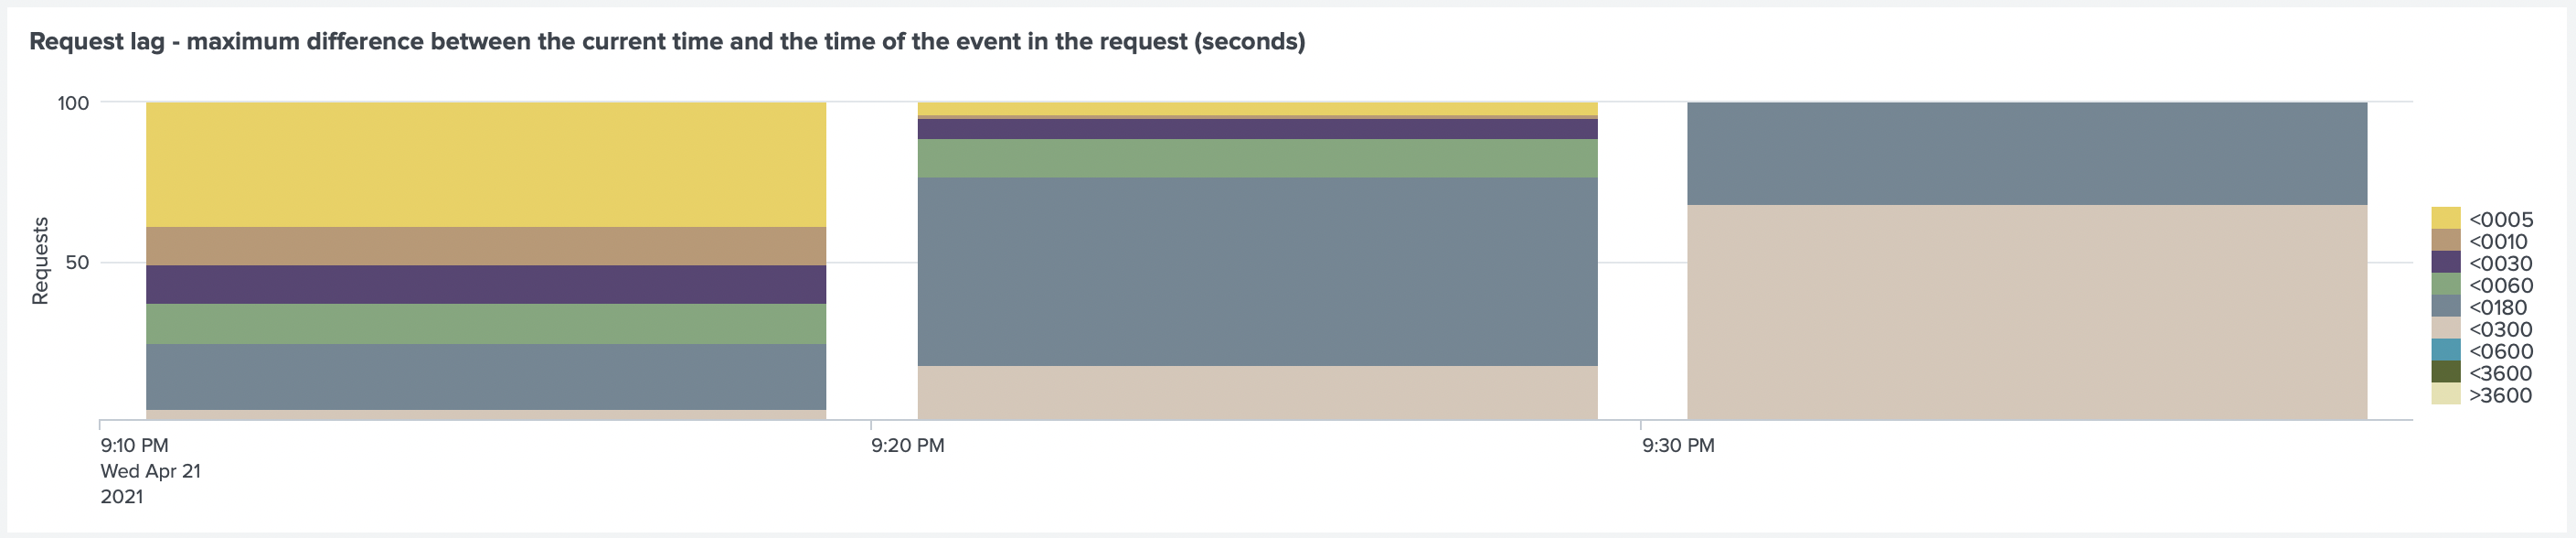
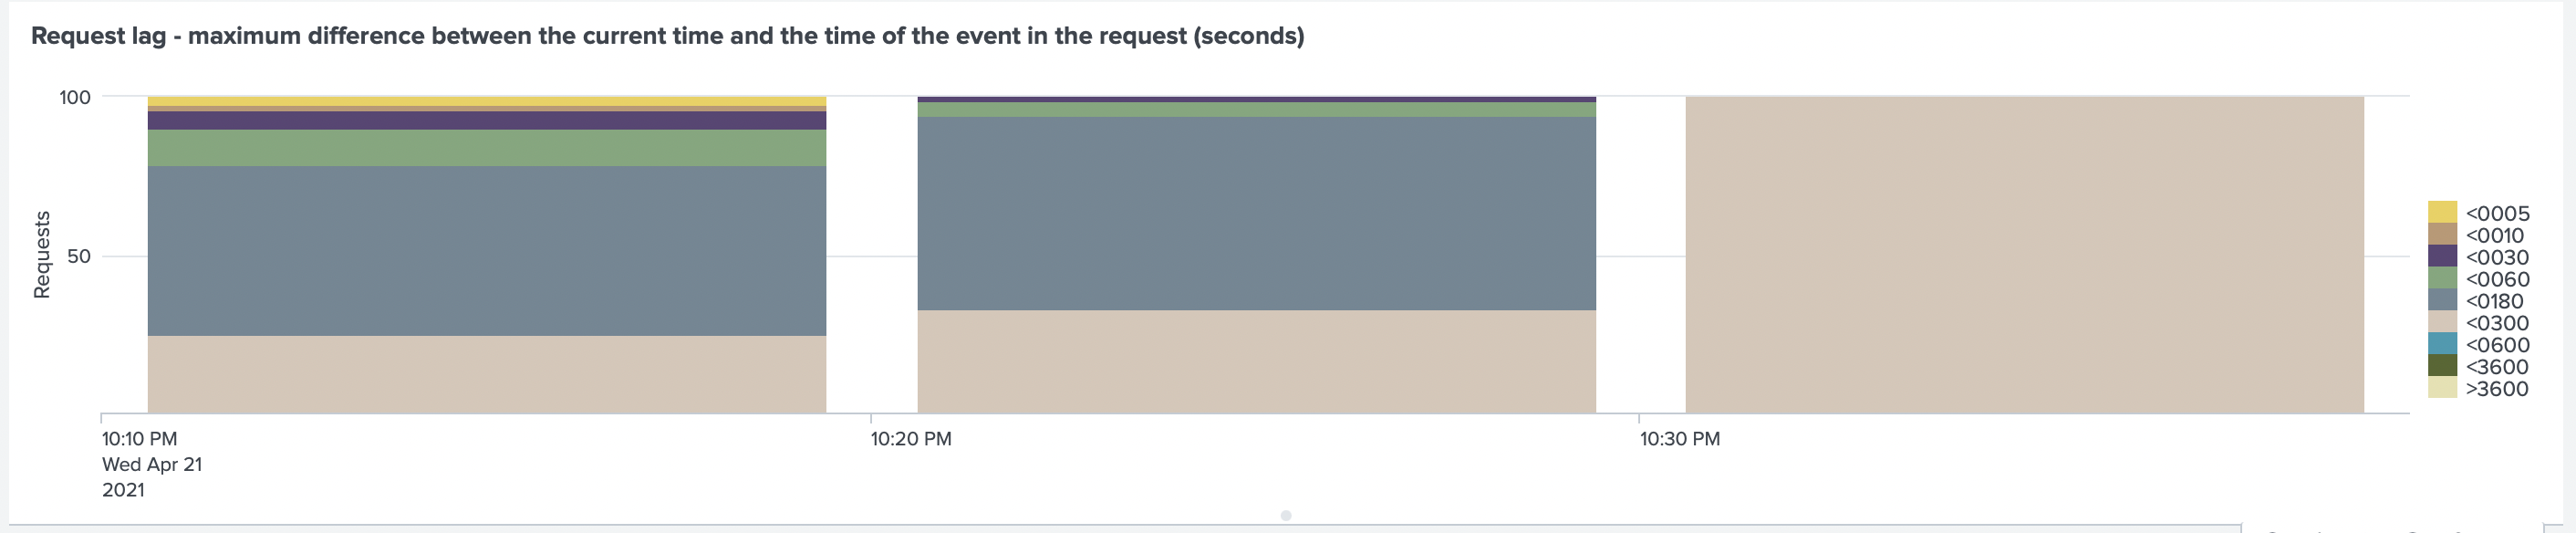
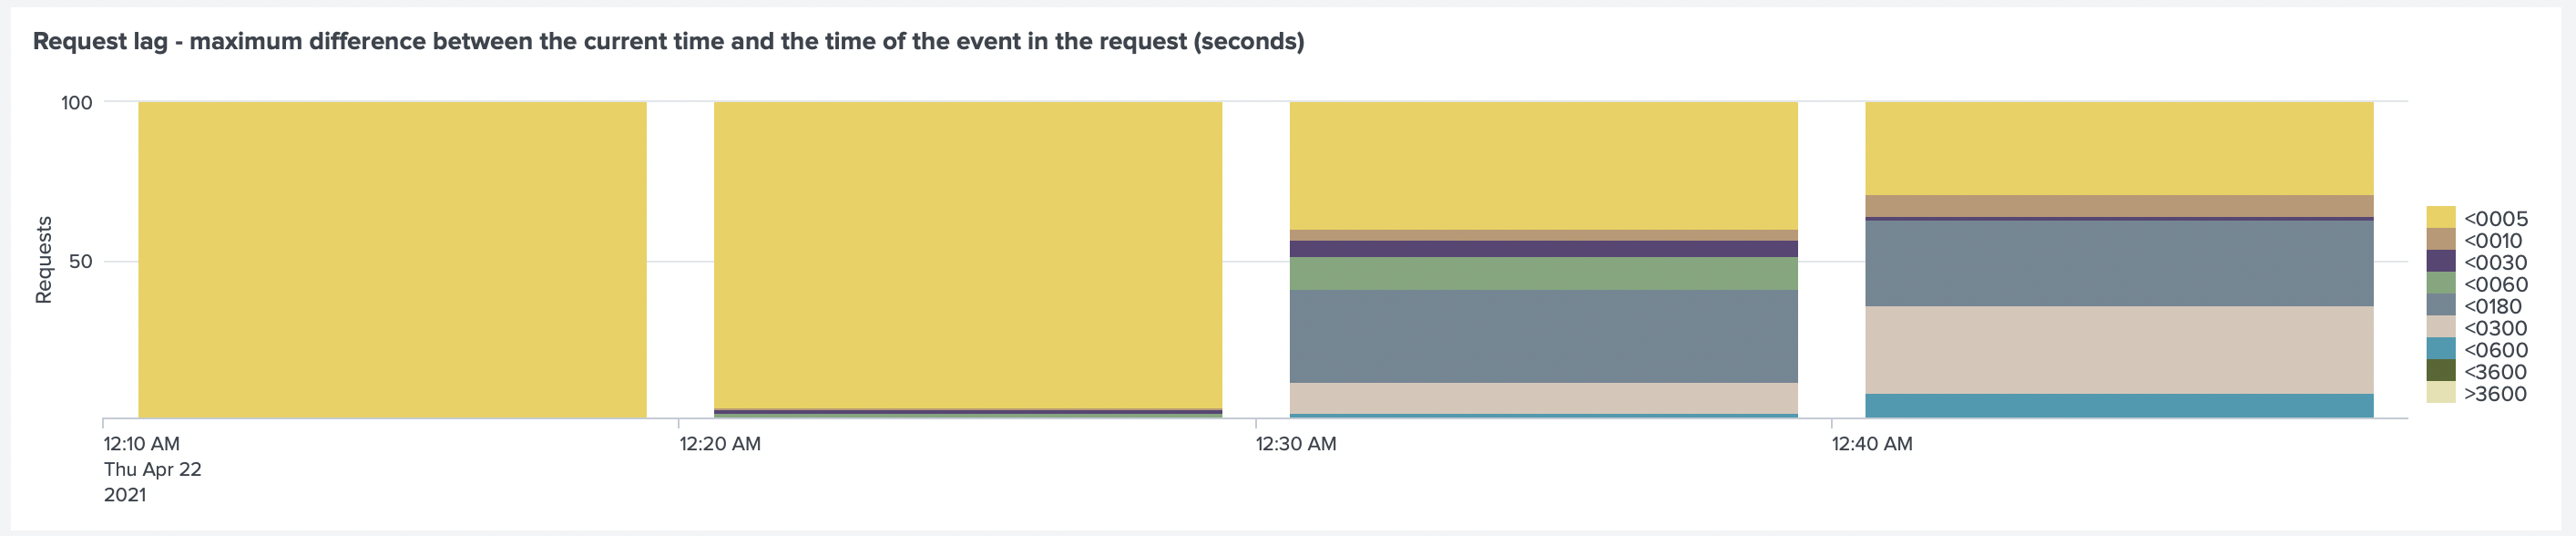
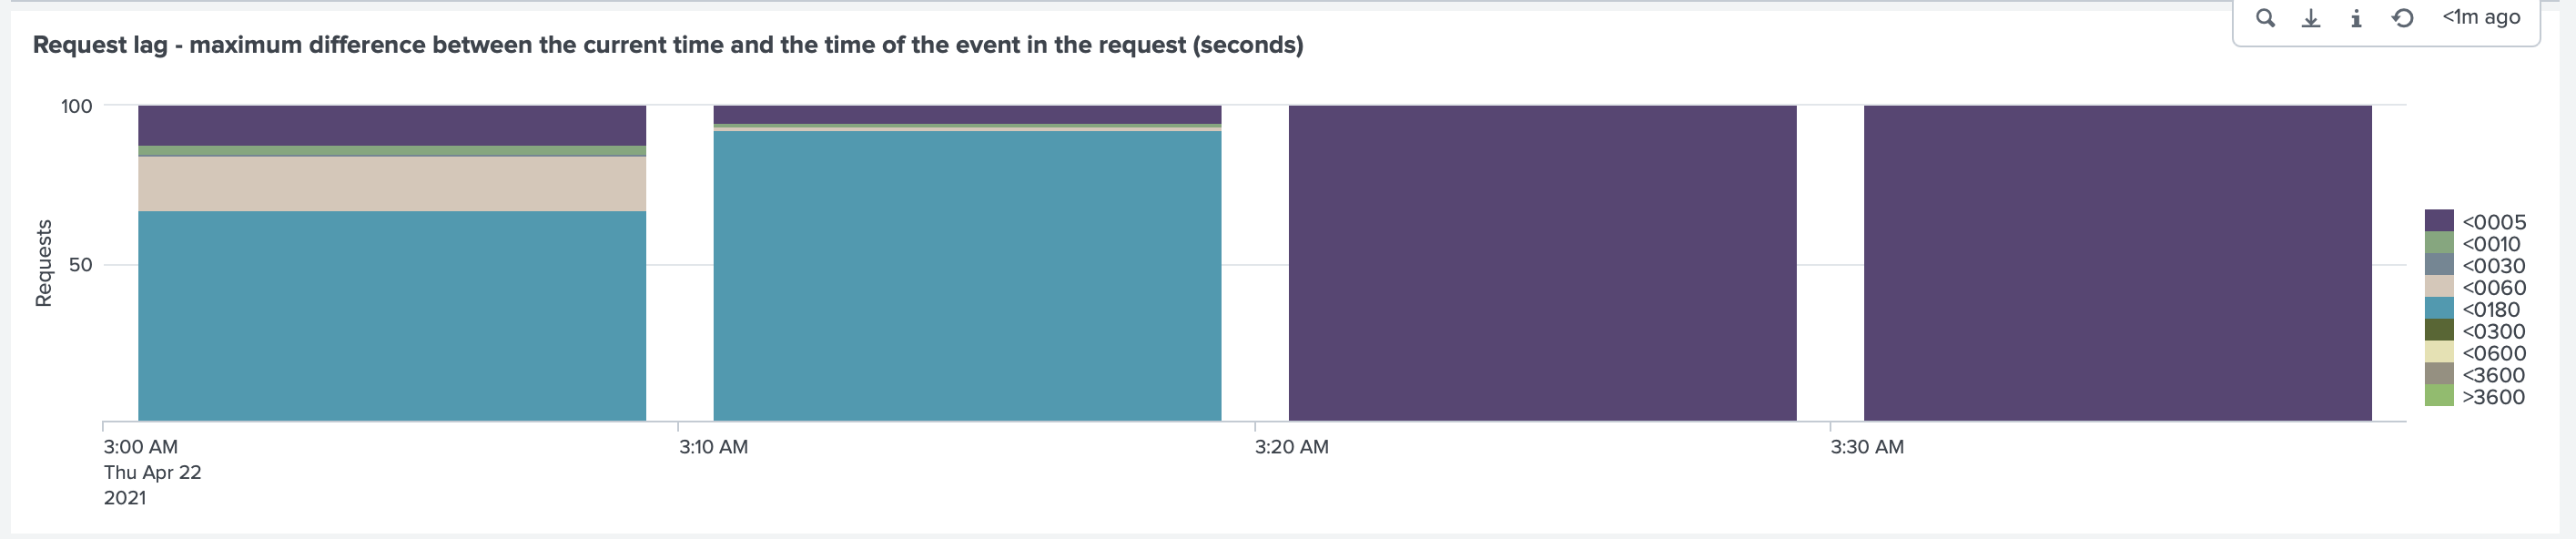
After the test finished, we looked at the Request Lag, where we found a delay in sending events.
The lag is between 180-300 seconds (up to 5 minutes).
This dashboard is a default dashboard that we provide with our Monitoring Solutions for Kubernetes, OpenShift and Docker.
When we looked at the Overview dashboard of our solution Monitoring Docker, we found three raised alerts.
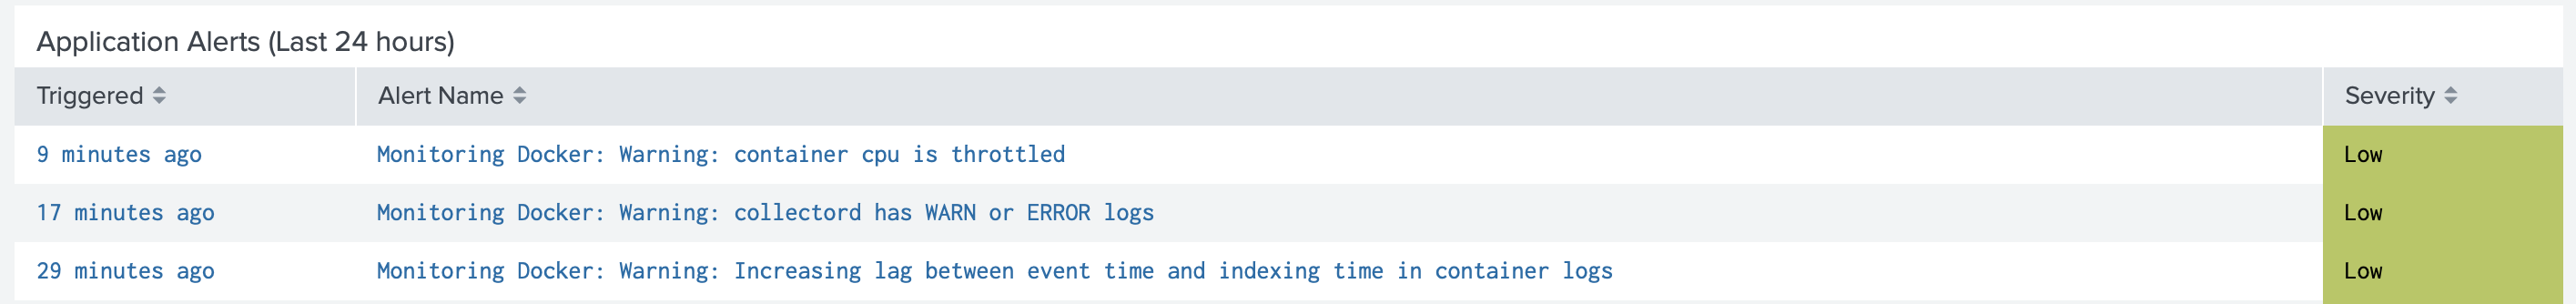
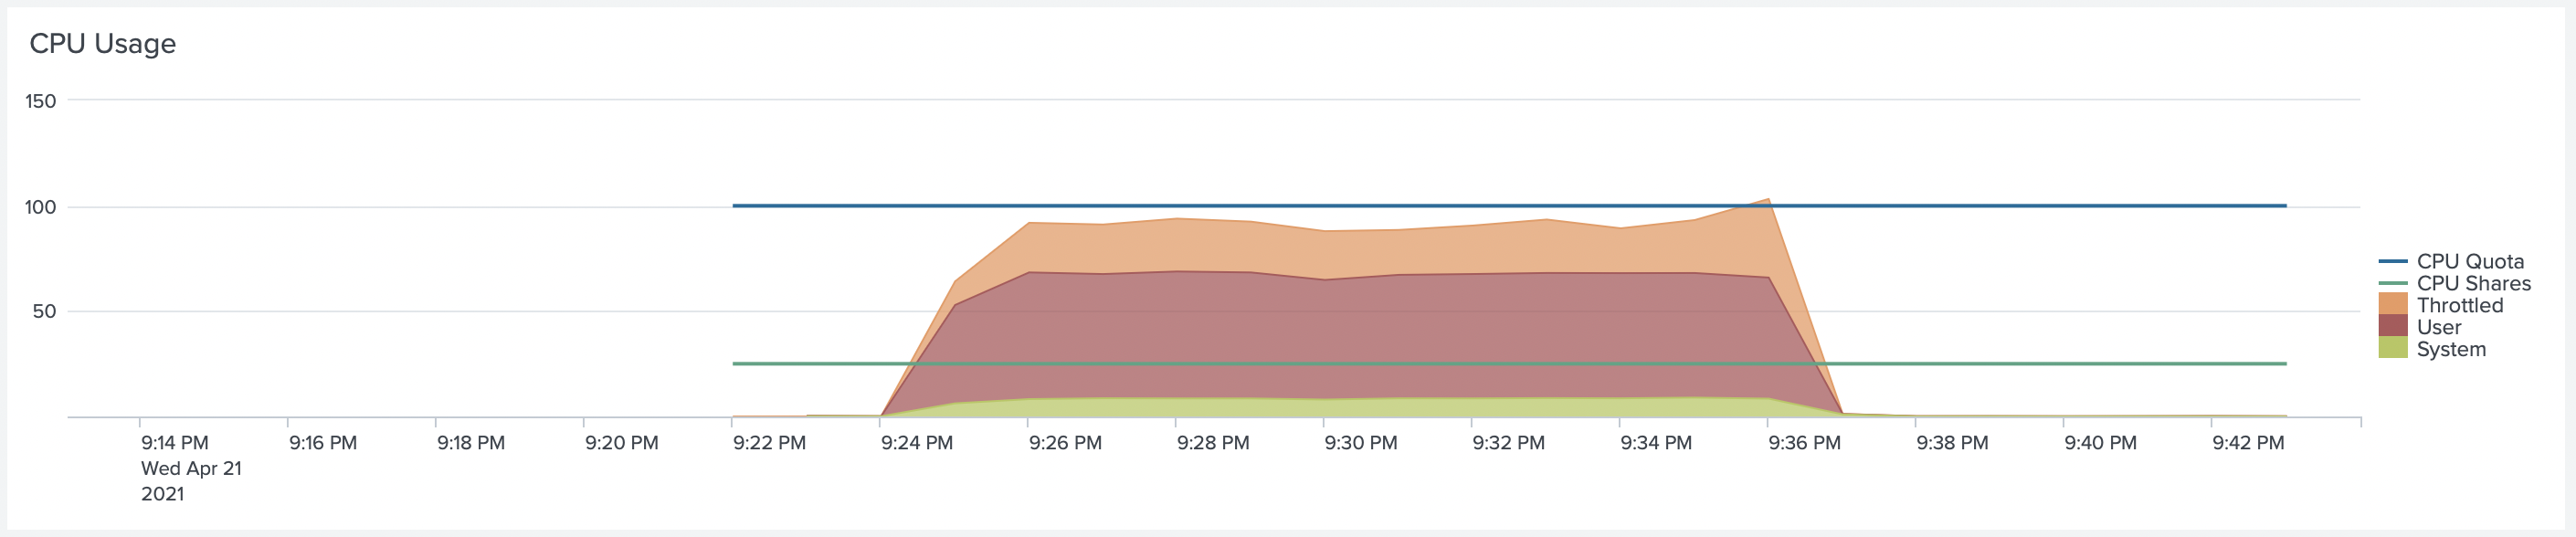
We can confirm that the Collectord container was throttled by looking at the detailed metrics from the Container dashboard.
By looking at the Request Lag, we can confirm that lag of container logs kept increasing.
Collectord reports request lag. It is a difference between the time of the event and when it was sent to Splunk. If the difference is too high, that means that events are getting delayed in the pipeline. The most common reason for that is that Splunk’s HEC configuration cannot handle the amount of data forwarded by Collectord. Or, as we saw previously, that Collectord does not have enough resources.
For the next test, we will increase the resources for Collectord to deal with the CPU throttling.
Test Run 2. Increasing CPU resources for Collectord
To deal with CPU throttling, we needed to increase CPU resources for the container.
the CPU limit to two CPU Cores (--cpus=2), and changed CPU shares to 1024 (--cpu-shares=1024).
We reran the same test and saw that Collectord was not throttled anymore.
But request lag was still there
Test Run 3. Increasing number of Splunk client threads
Collectord provides the ability to increase the number of sending Splunk client threads.
Under [splunk.output] in the configuration for Collectord, you can find the flag threads.
In the case of Collectord deployed on Docker, you can simply change that by using an environment
variable --env "COLLECTOR__SPLUNK_THREADS=output.splunk__threads=20".
By default, it uses one thread for Collectord deployed in the Monitoring Docker solution.
We set the number of threads to a small value because if the value is too high and you have too many workers sending data with too few Splunk HEC endpoints, this can result in a lot of connections from the Collectord side. When you change this value, calculate the total number of connections established from the Collectord side by multiplying the number of threads by the number of workers.
Considering that we have ten independent Containers on each host, and each container produces a high number of events, Collectord can use a dedicated pipeline for each of them, from reading the logs files to combining a batch of events and sending them to Splunk HEC.
After applying this change and rerunning the test, we saw an improvement, but still a lag
for some events for about 180 seconds.
Test Run 4. Recommended configurations for Splunk HTTP Event Collector
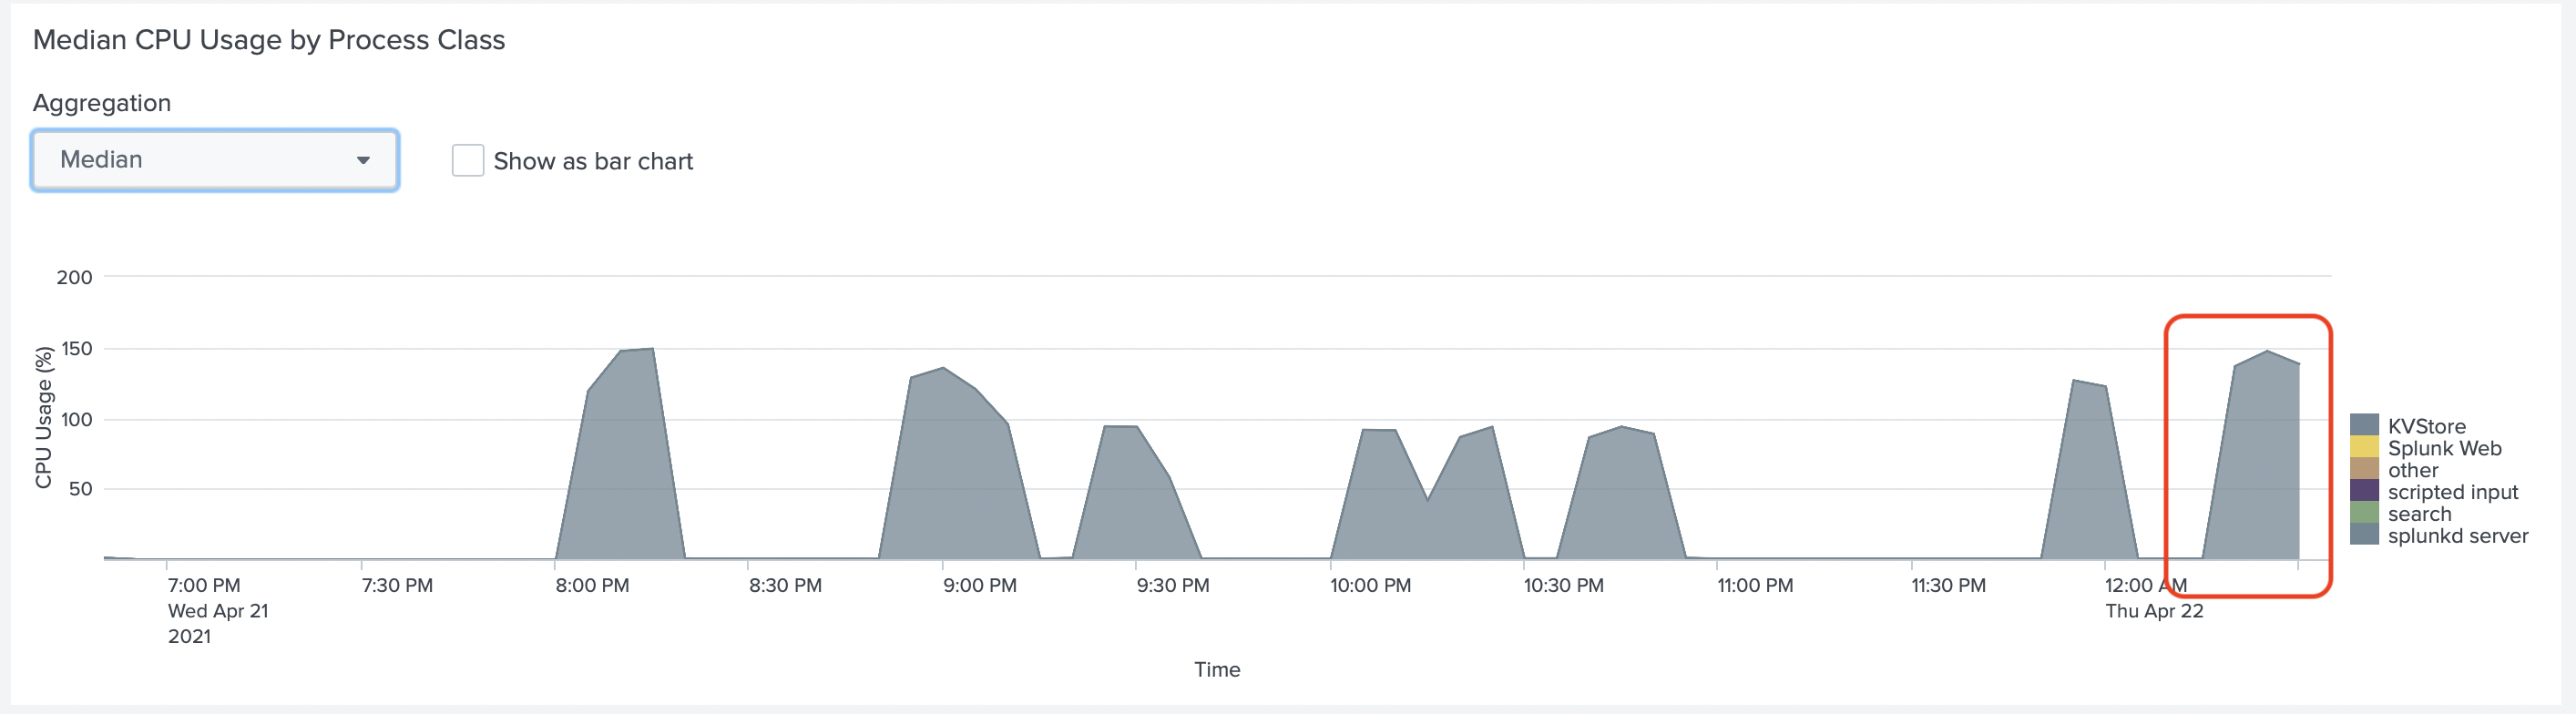
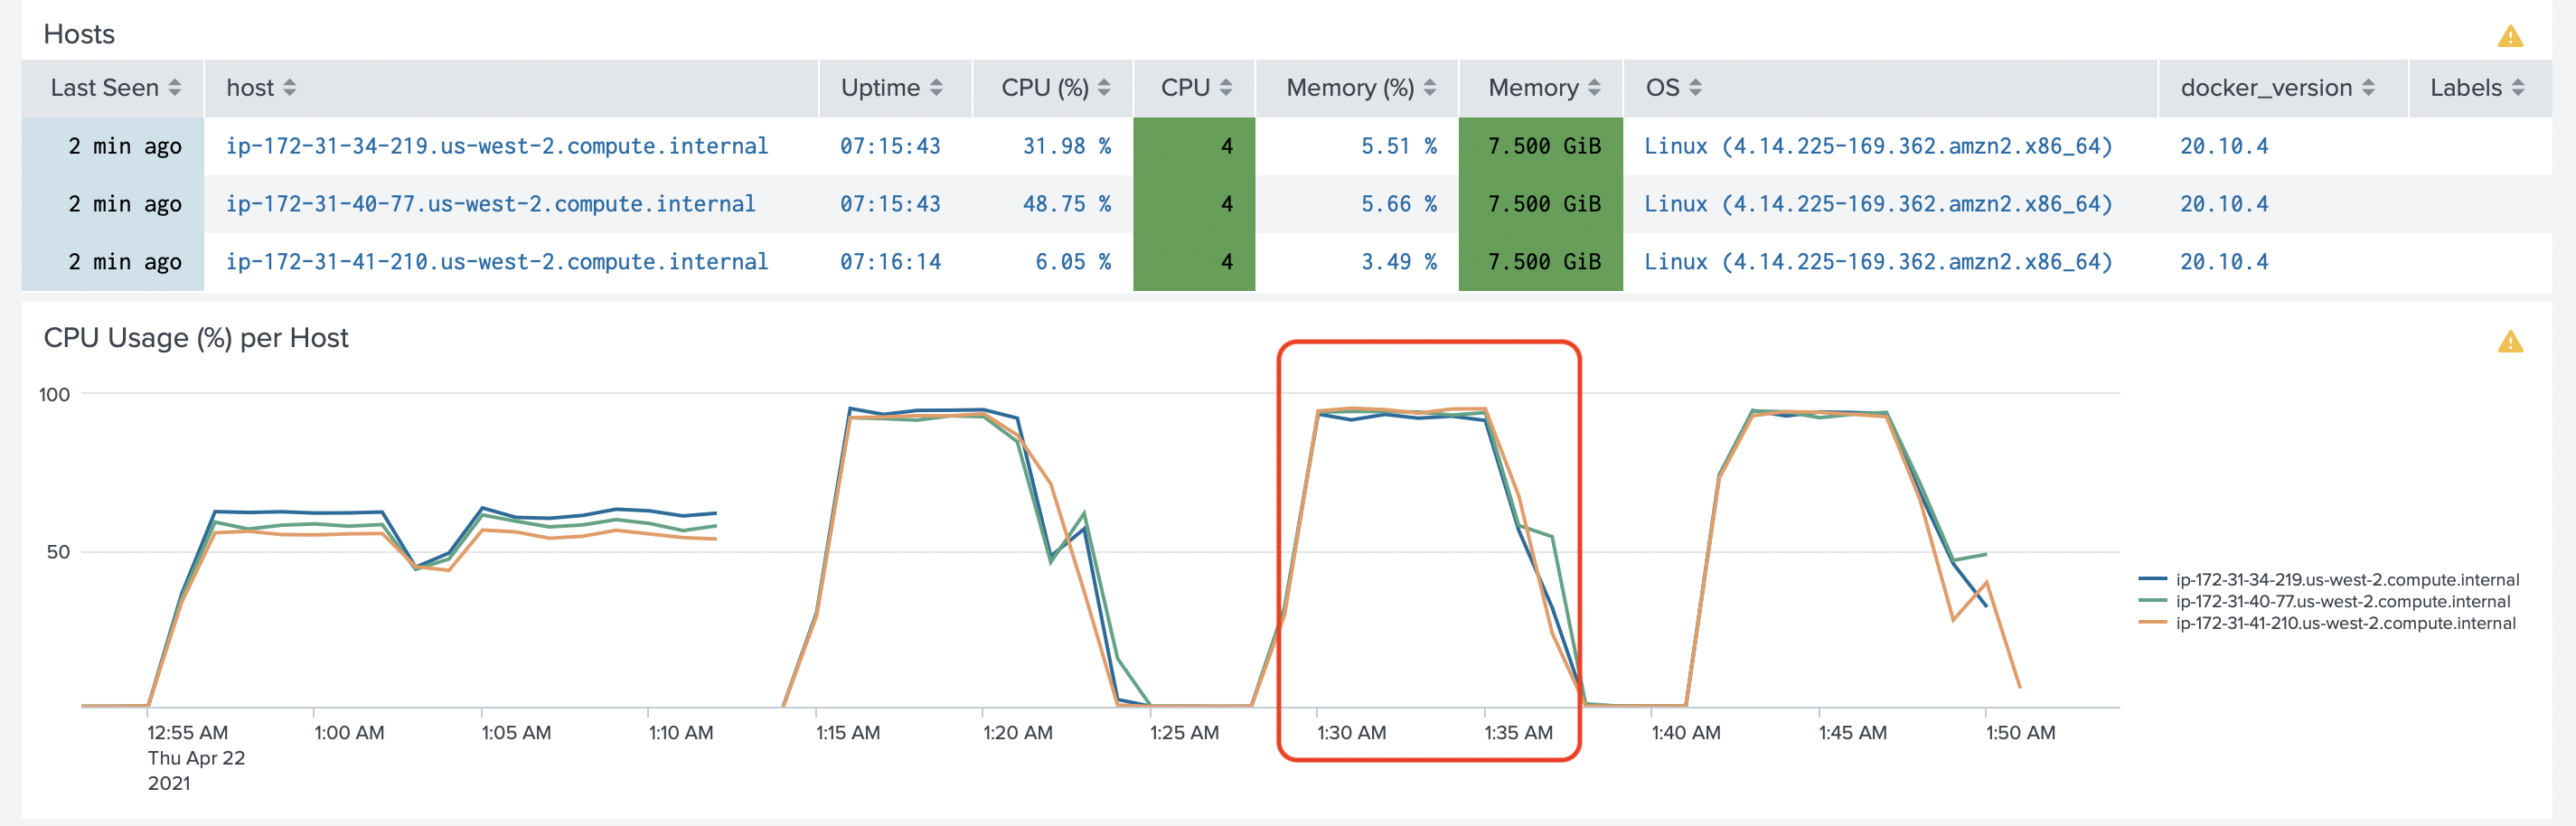
In the Splunk Monitoring Console, we looked at the CPU usage of Splunk Indexer (highlighted period)
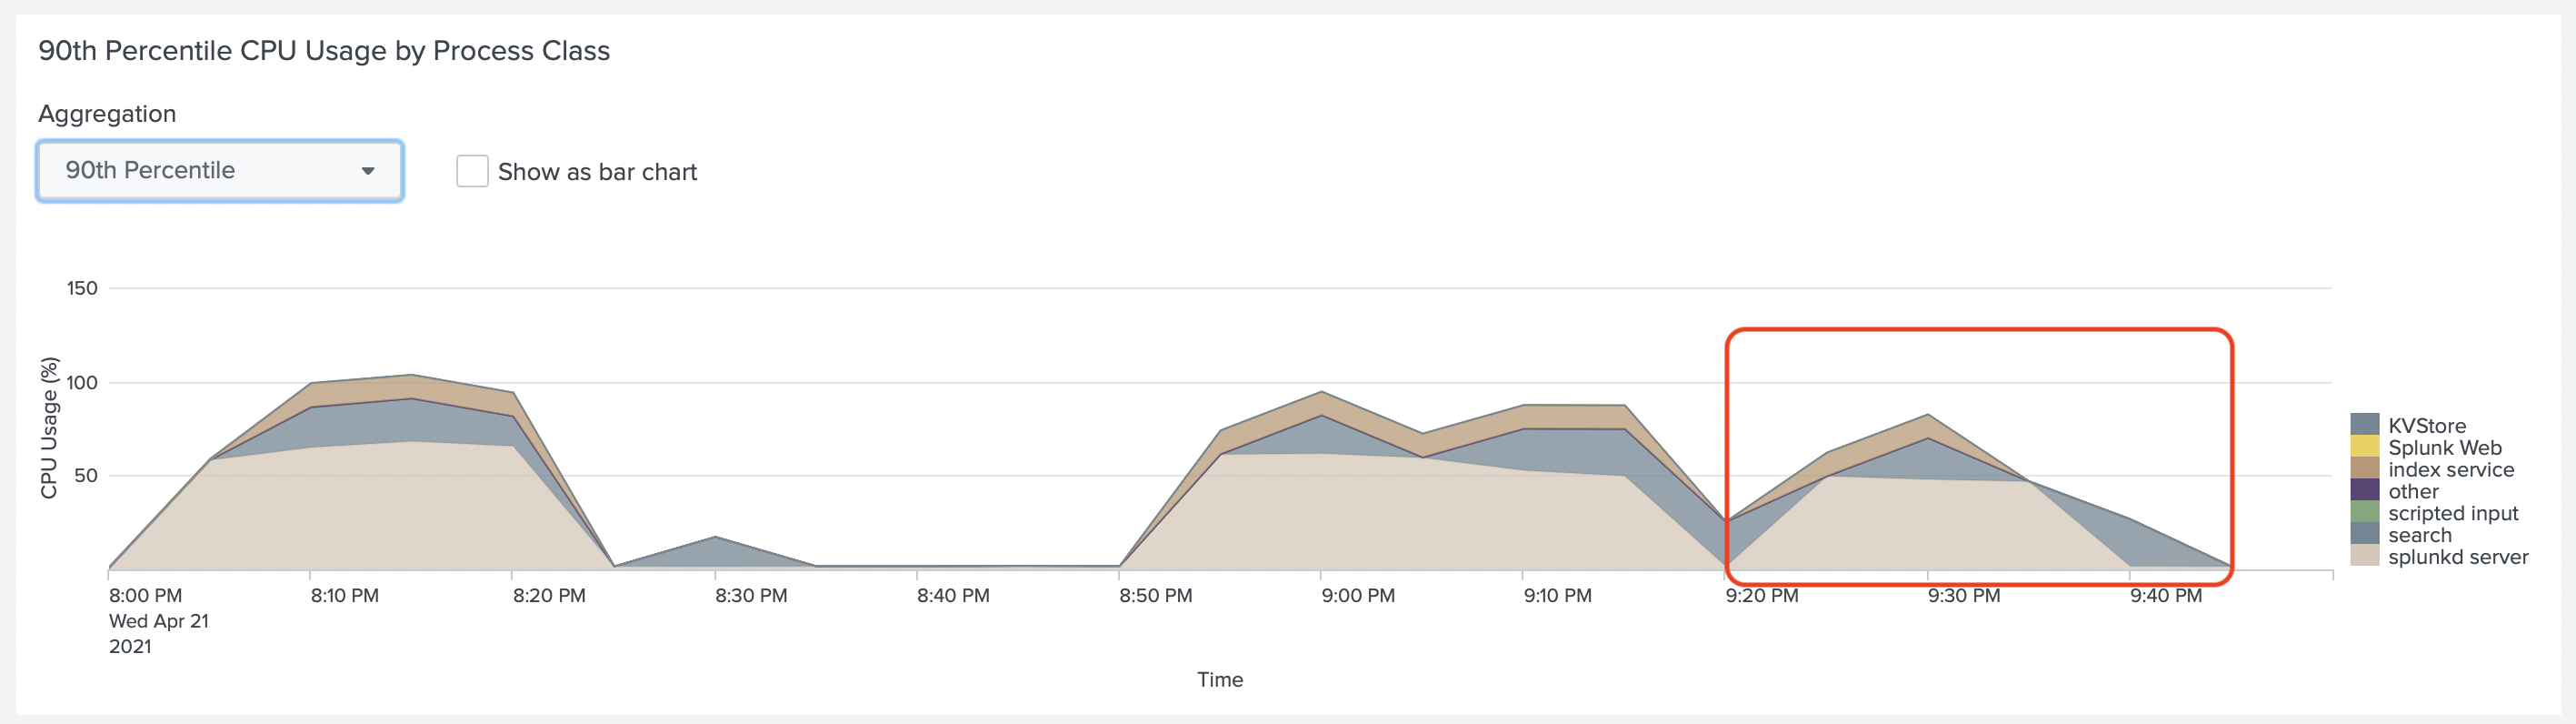
And at the CPU Usage of Splunk Heavy Forwarder with Splunk HEC
In both graphs, we don’t see yet, that Splunk uses all CPUs of this EC2 instance.
But if you look at the Splunk configuration file inputs.conf
under [http] (HEC Configuration), you can find the following configuration.
1dedicatedIoThreads = <number>
2* The number of dedicated input/output threads in the event collectord input.
3* Default: 0 (The input uses a single thread)
That tells us that by default, this input is using only one thread.
We highly recommend reviewing the .conf2017 talk Measuring HEC Performance For Fun and Profit. The most important notes about configuring server-side of data ingesting pipeline:
- Splunk Parallel Ingestion Pipelines - Recommendation: Depends on event type, but typically 2 pipelines
- Splunk Dedicated IO Threads - Recommendation: set to roughly the number of CPU cores on the machine
Collectord already implements client-side recommendations.
We changed the configuration of Splunk Heavy Forwarder to the recommended:
parallelIngestionPipelines = 2inserver.conffor[general]dedicatedIoThreads = 4ininputs.conffor[http]
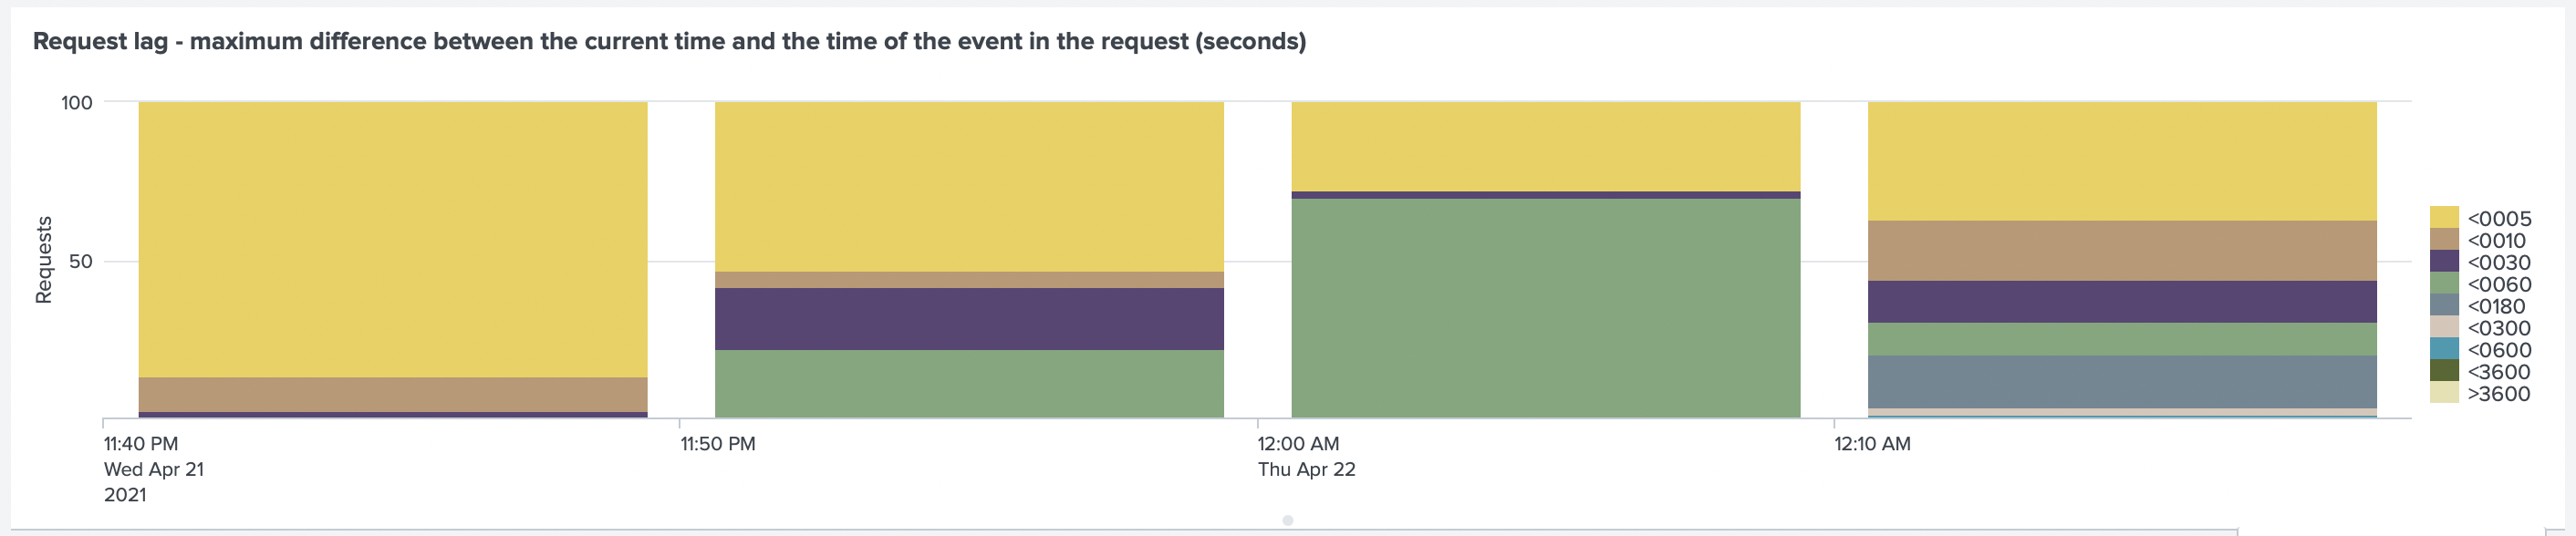
After rerunning the test, we found that the lag is now below 5 seconds.
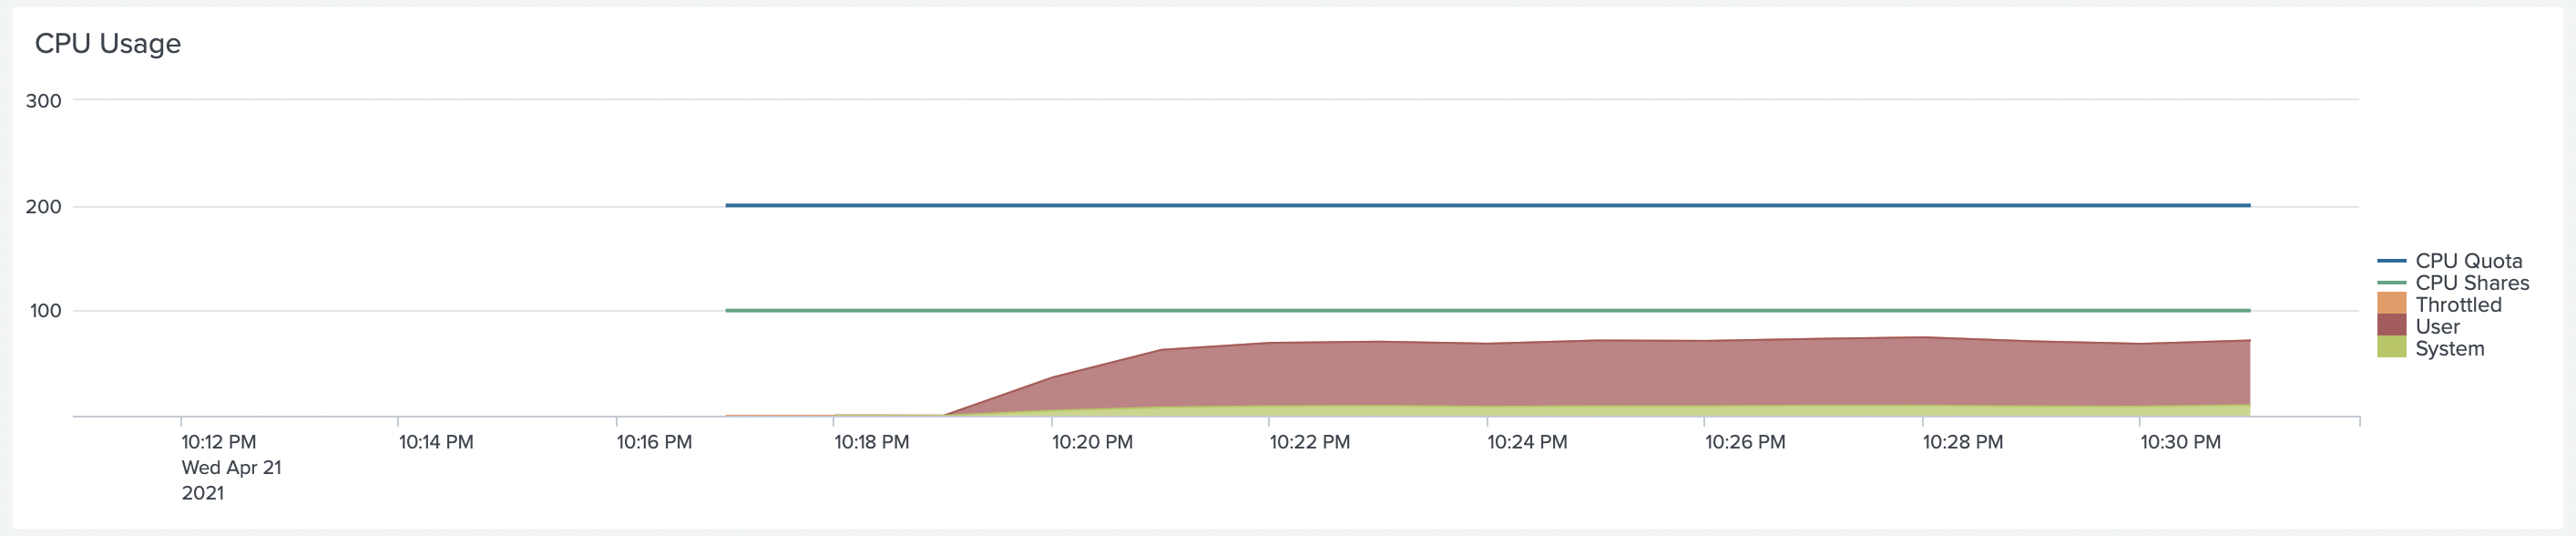
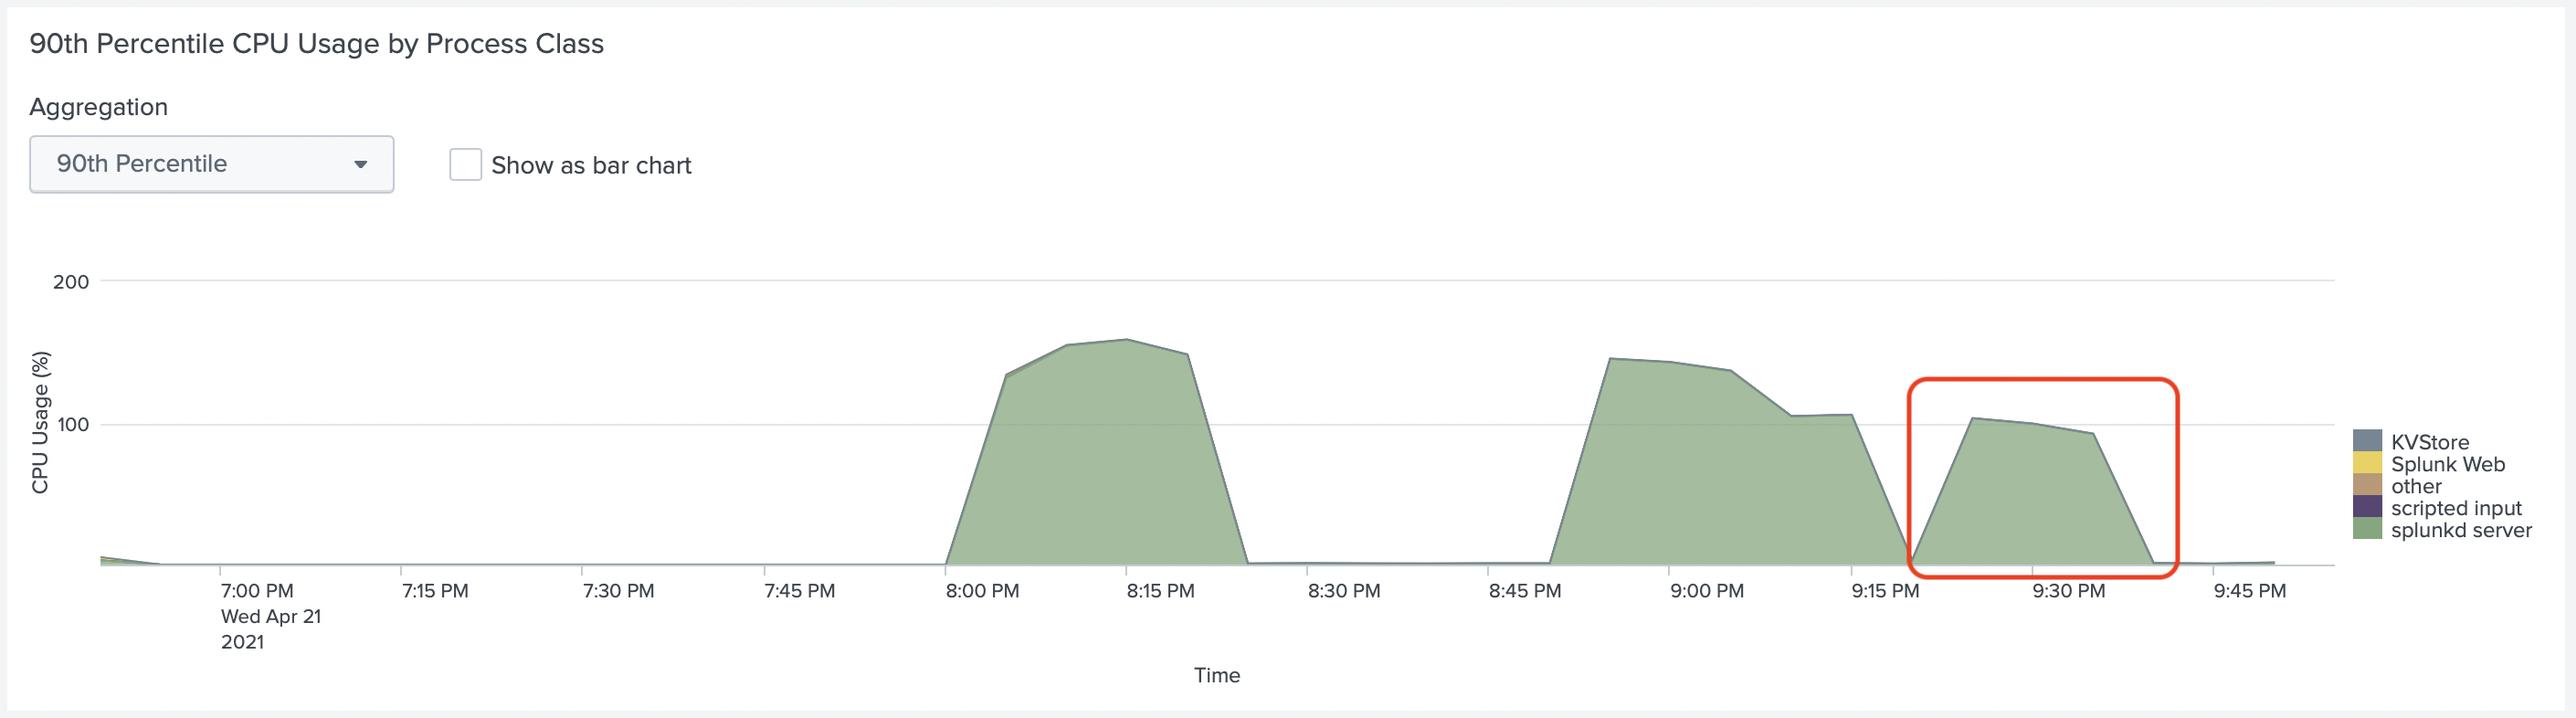
If we look at the CPU usage of Splunk HF, we can see that it uses more CPU now.
The colors of
KVStoreandsplunkd_serverare very close, but thesplunkd_serveruses most CPU.
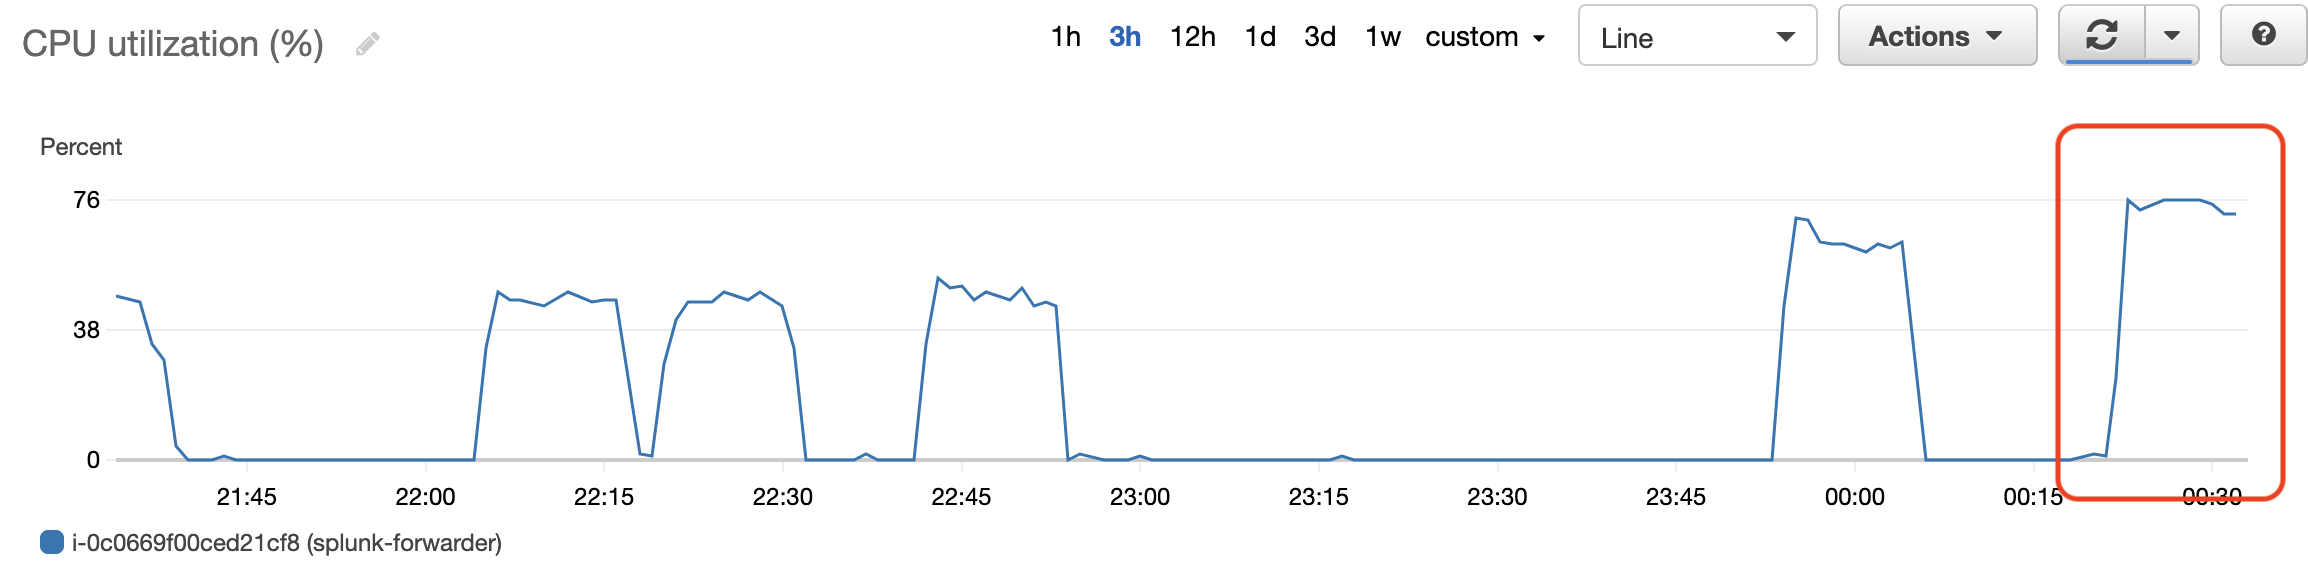
With CloudWatch metrics of EC2 instance it is easier to see that CPU usage went up
Test Run 5. Doubling the amount of data - 5TiB/day
We decided not to stop there but to test how our Splunk configuration would work if we doubled the amount of data. Instead of running ten containers on each worker, we started 20 containers to generate the data. It is essential to support not today’s load in production environments, but the load that you might receive tomorrow.
Considering that Splunk HF was using close to 80% of CPU, the first thing was to increase the
number of CPUs for this instance. So we switched from c5d.xlarge to c5d.4xlarge, which gave us 32 cores
in total (16*2). We decided to increase the number of CPUs by 4, to get it ready for the next tests.
To run this test, we have increased the CPU limit and Shares for Collectord
container (--cpus=3 --cpu-shares=1024).
Instead of running 10 containers on each worker node, we ran 20. That generated 60MiB/sec
of data (5TiB/day). With this load, even with the more powerful instance for Splunk HF we
noticed that lag increased again.
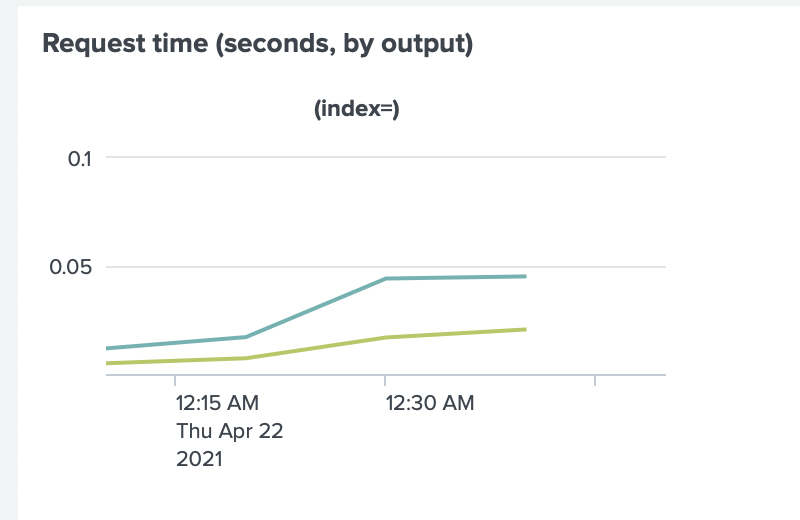
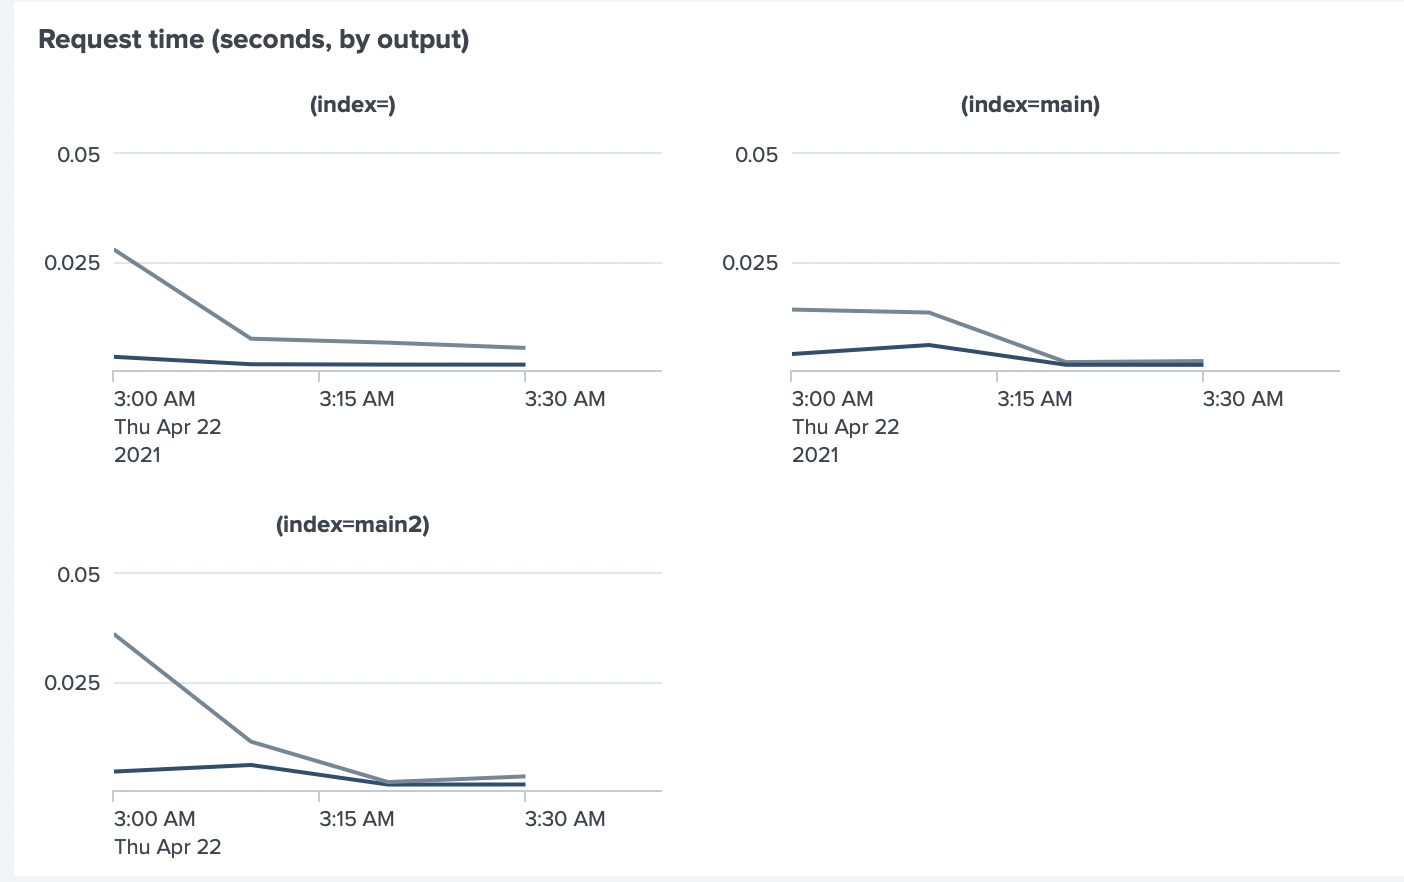
The Request Time between Collectord and Splunk HTTP Event Collector also increased (max from ~0.005sec to ~0.05sec).
After investigation, we have found several issues.
The easiest one, our Worker nodes, were running close to 100% of CPU capacity. Before, we only looked at the CPU usage of Collectord. The testing containers, the docker daemon, and the system used a good portion of CPU resources.
To solve this issue, we changed worker instances to c5d.2xlarge instances.
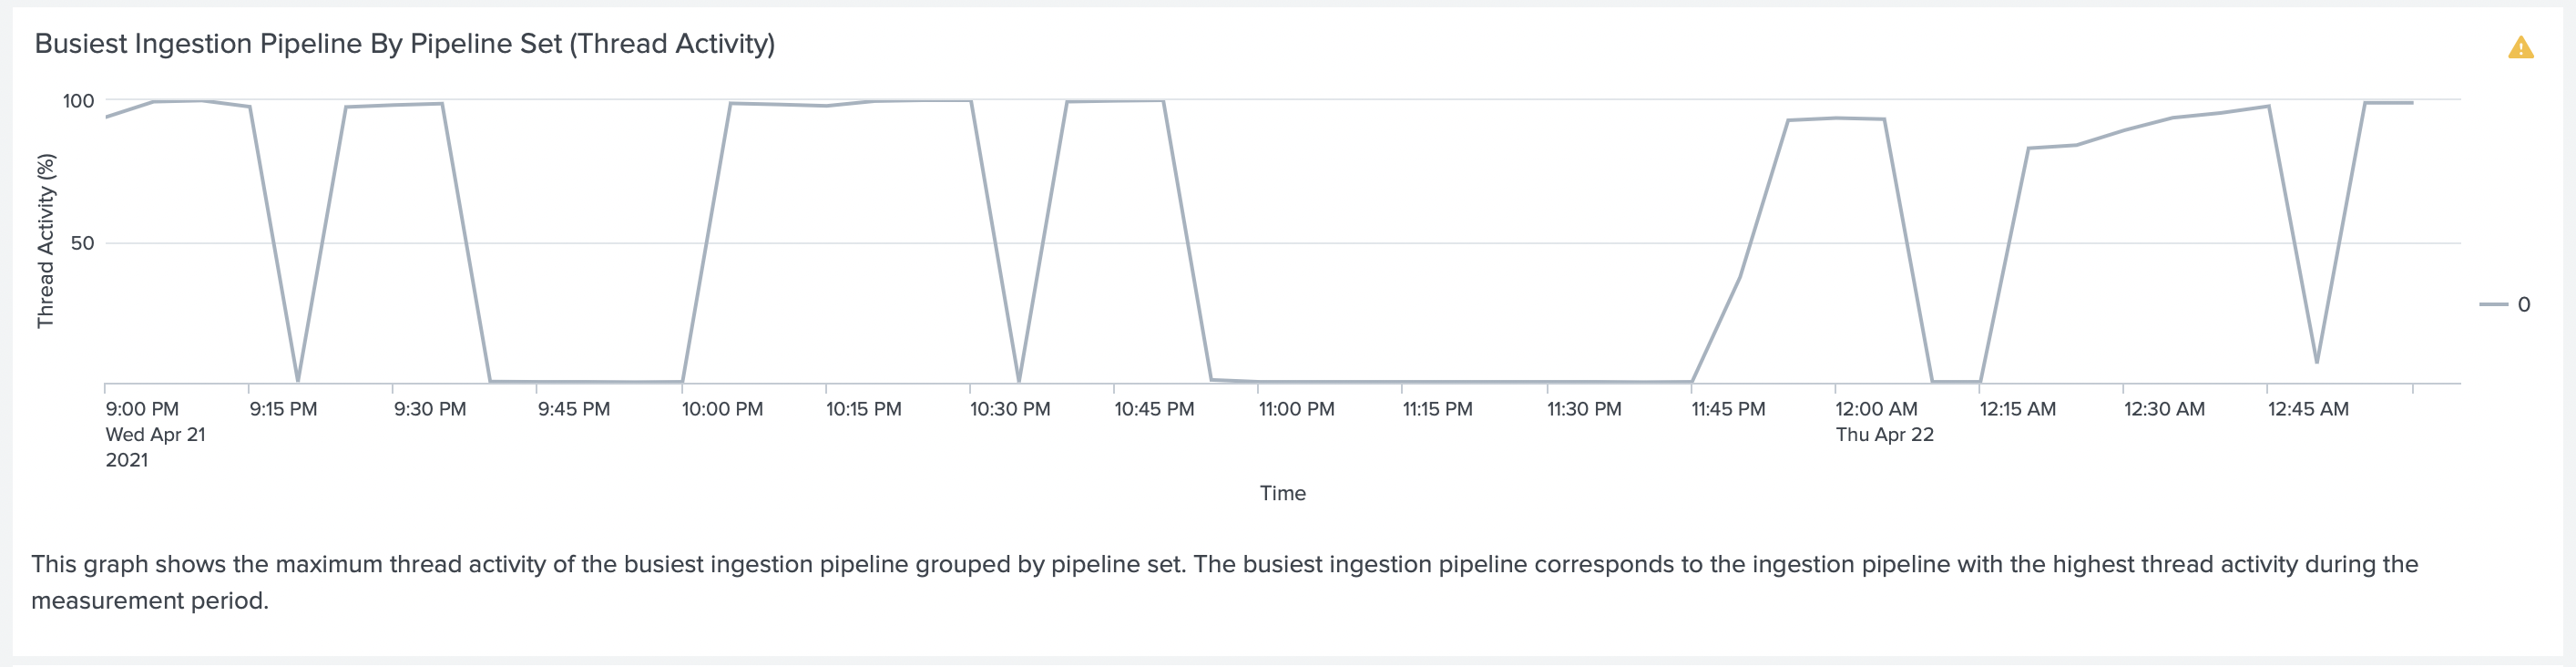
On the Indexer, we noticed that the ingesting pipeline was busy. When running tests the indexerpipe thread was close to 100%, and the
Pipeline Set was 100% busy.
To deal with this issue we did two things. We increased the number of parallelIngestionPipelines to
2. Before this, we were sending all the data to just one index. Instead, we started forwarding
data to two indexes.
So half of the testing containers we ran had an annotation collectord.io/index=main2
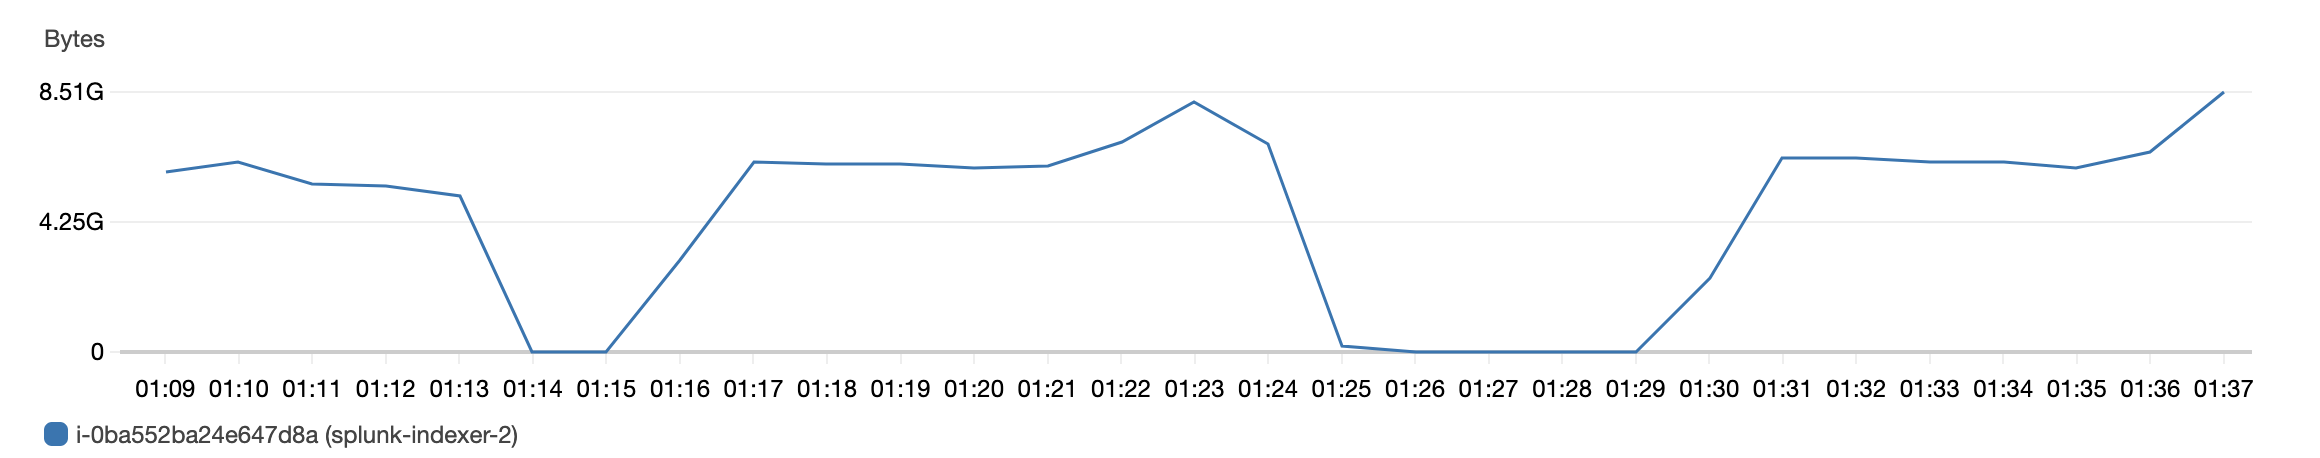
We noticed the next issue by looking at the EC2 instance metrics and found out that the amount of data
that Indexer was receiving was around 8G/sec. The type of instances we were using had an Ethernet
connection with up to 10G/sec. So that was a signal as well.
At this point, we had an option to split our single instance Indexer into an Indexer cluster. And in the production environment, you should not run single instance Indexers but the cluster instead. But that would not change much if we would implement an Indexer Cluster with three instances for durability. And the amount of traveling data would be pretty close.
Considering that Collectord was sending data to Splunk HEC in compressed format (gzip compression over HTTP),
this resulted in about 300M/sec. We decided to look into the possibility of forwarding compressed data between Splunk HF
and Splunk Indexer. In the outputs.conf file you can find a flag compressed = <boolean>, which is set to false by
default. Changing that reduced the traffic from Splunk HF to Splunk Indexer to around 300M/s as well.
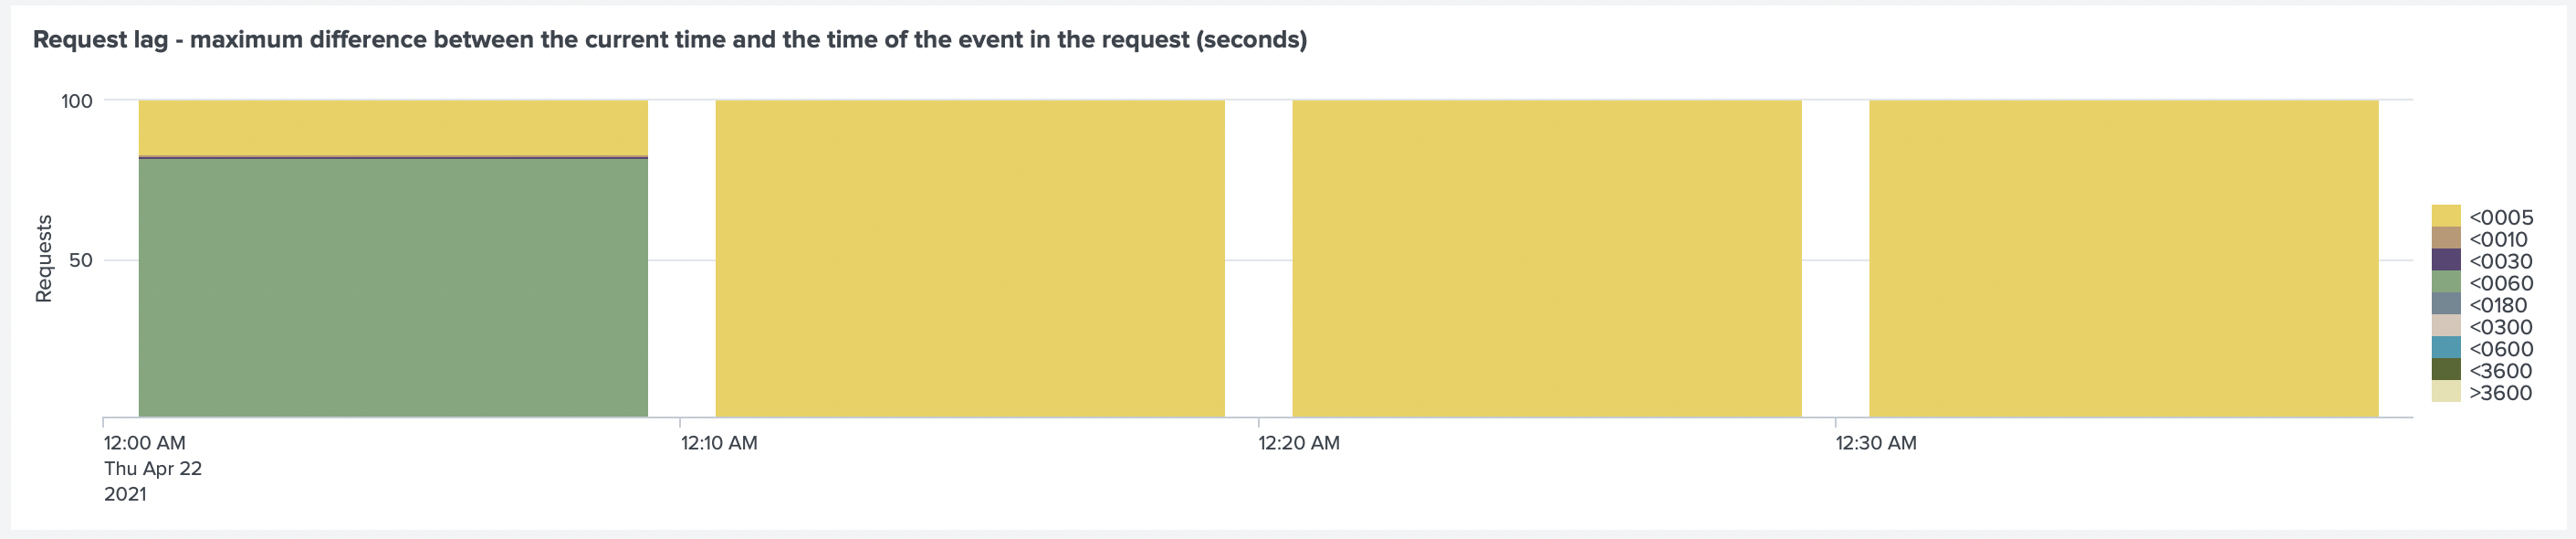
After doing all of that, we got the lag back to below 5 seconds
And the request time between Collectord and Splunk HEC to below 0.005sec
Test Run 6. Doubling the amount of data (Again!) - ~10TiB/day
After performing that test, we decided to double the amount of data again.
This time we kept running 20 containers on each worker, but changed the amount of logs generated by
each container from 1MiB/sec to 2MiB/sec. In total, we were generating 40MiB/sec from a single
worker, and 120MiB/sec in total from three workers (~10TiB/day).
To run this test, we have increased the CPU limit and Shares for Collectord
container again (--cpus=4 --cpu-shares=2048).
After running the test, we have noticed again increased lag, and the request time.
We started to notice some indexing lag, including filled queries, on Splunk Indexer at this point. But we were mostly curious about how Splunk HF could handle this load. As Collectord metrics were showing that the request time and the lag between Collectord and Splunk HEC kept increasing.
We checked already that Collectord was not throttled, it was running using 3 CPUs at maximum, and we gave it 4 CPUs. And all workers were using about 70% of CPU in total.
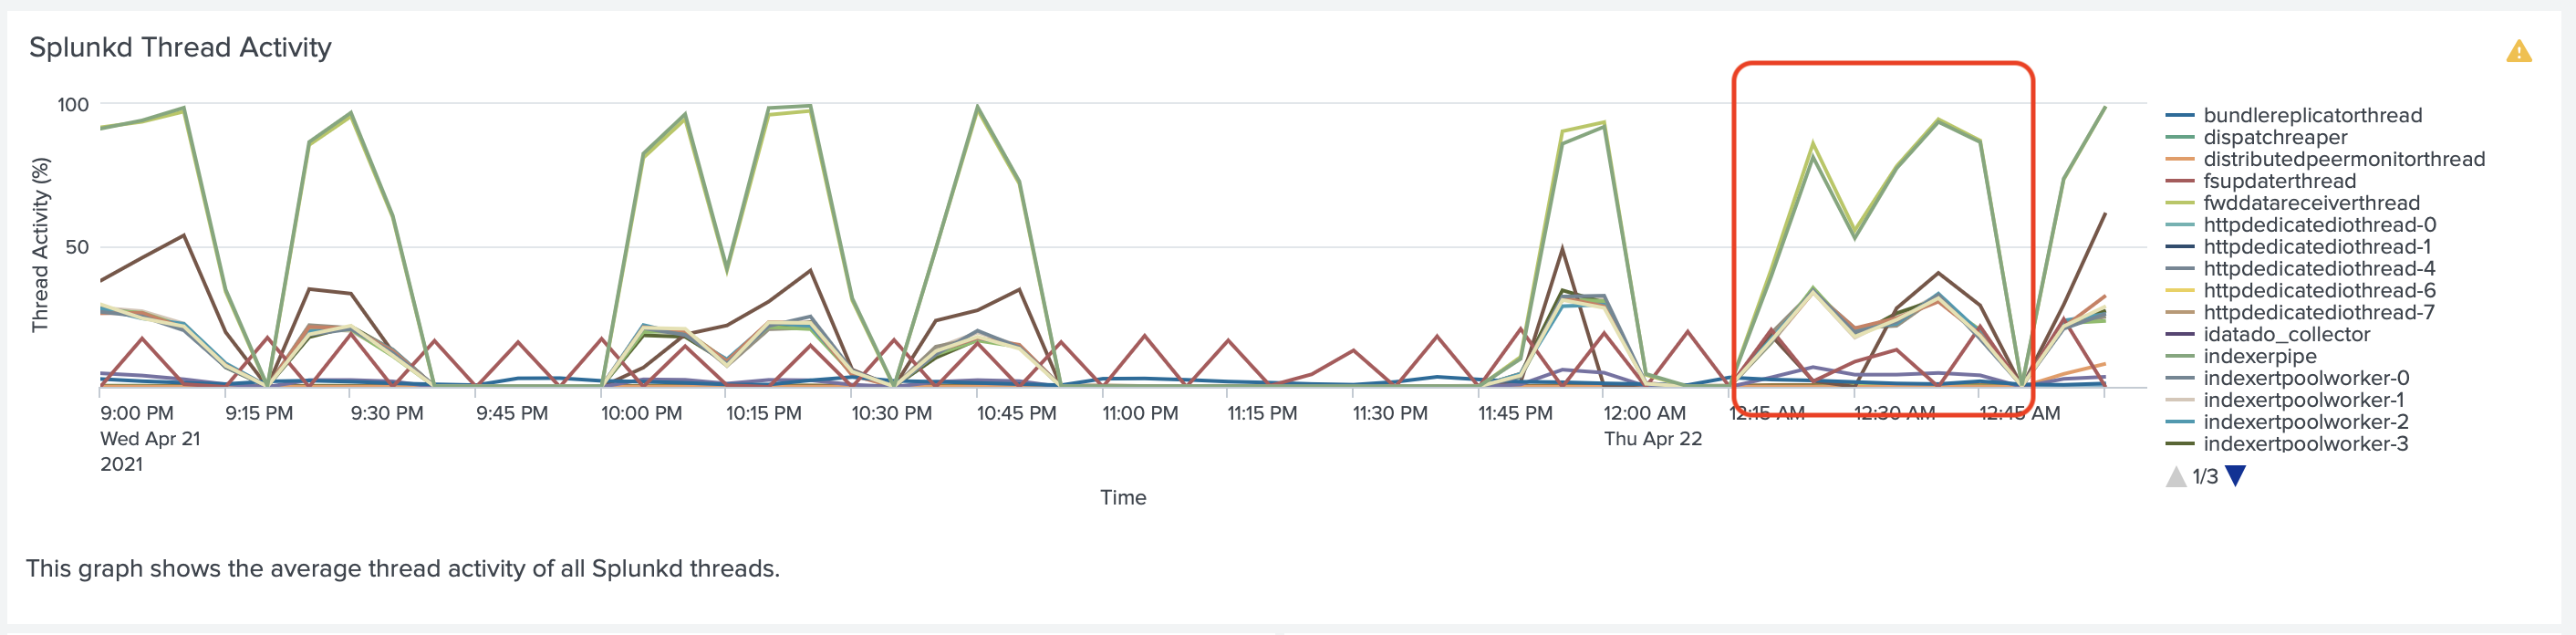
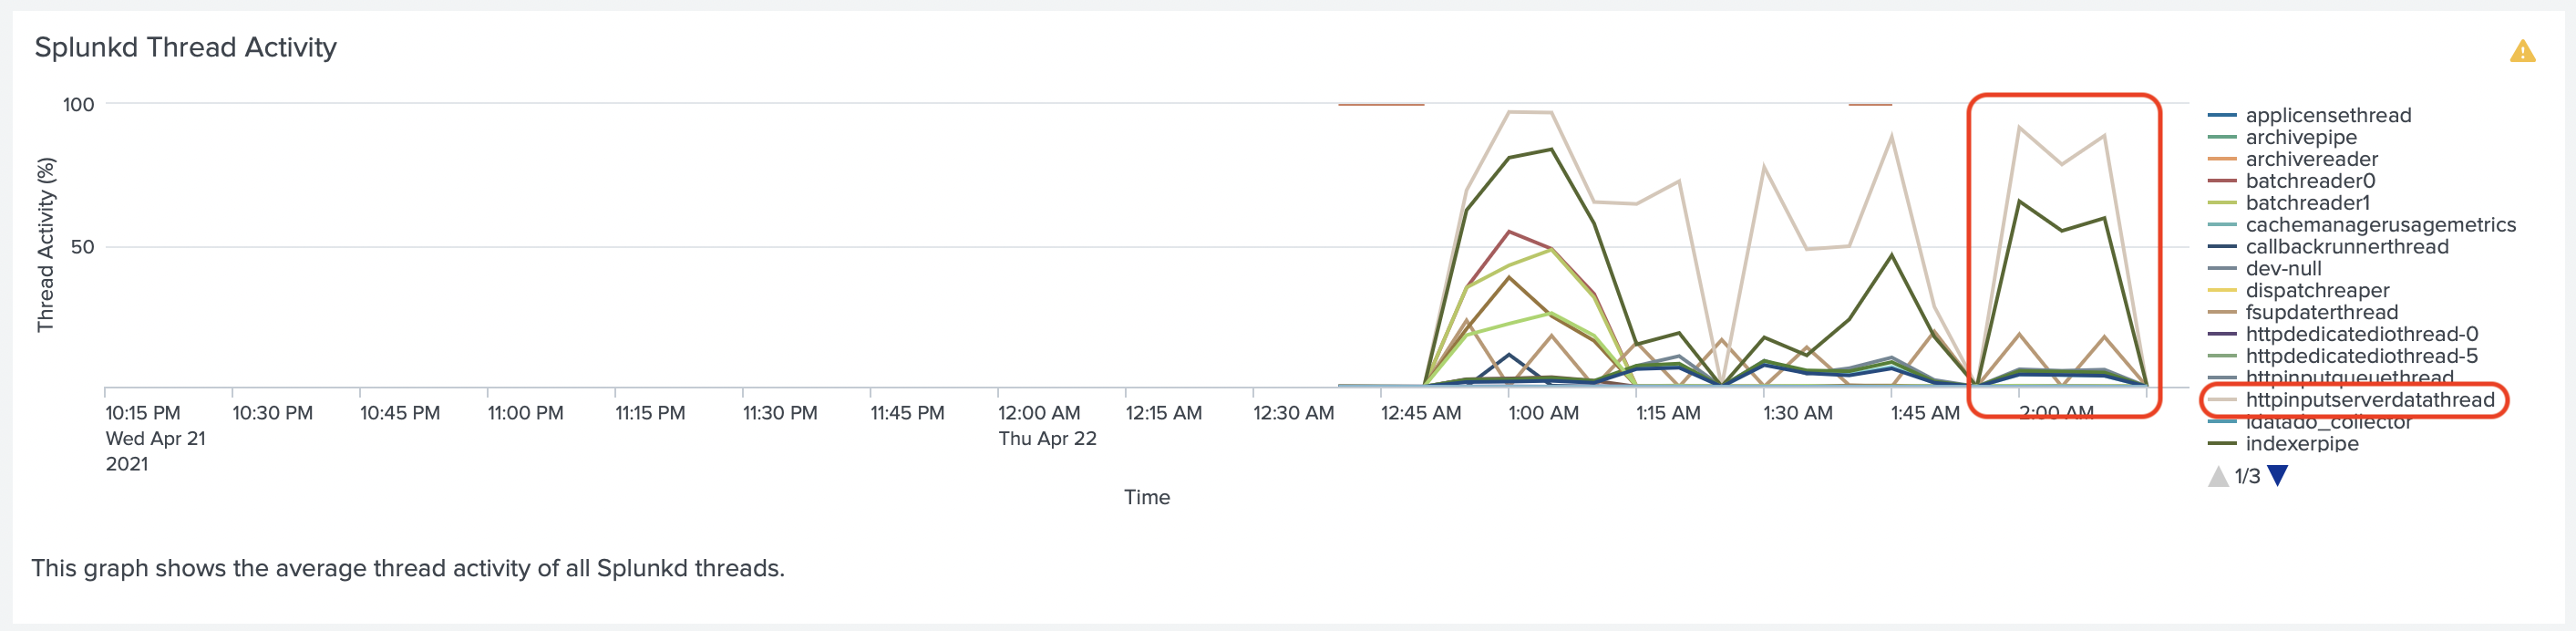
We used Splunk Monitoring Console to look at which threads were busy on Splunk HF running
Splunk HTTP Event Collector and noticed that the thread httpinputserverdatathread was close
to 100% every time we ran the test.
We tried to adjust dedicatedIOThreads for Splunk HEC while also increasing dedicatedIOThreads for HTTP Server in
server.conf, but none of the configurations would raise it from 1 to multiple threads. At this point
we saw that Splunk Indexer could use around 5-6 CPUs in total, and could not scale more for our tests.
At this point we decided to scale up the number of Splunk HF forwarders from one to three and
put them behind a TCP Load Balancer. We used c5d.2xlarge instances for Splunk HF with Splunk HEC configured
on them. So instead of one Splunk HF with 32 CPU Cores (c5d.4xlarge), we used three with 16 CPU Cores (c5d.2xlarge).
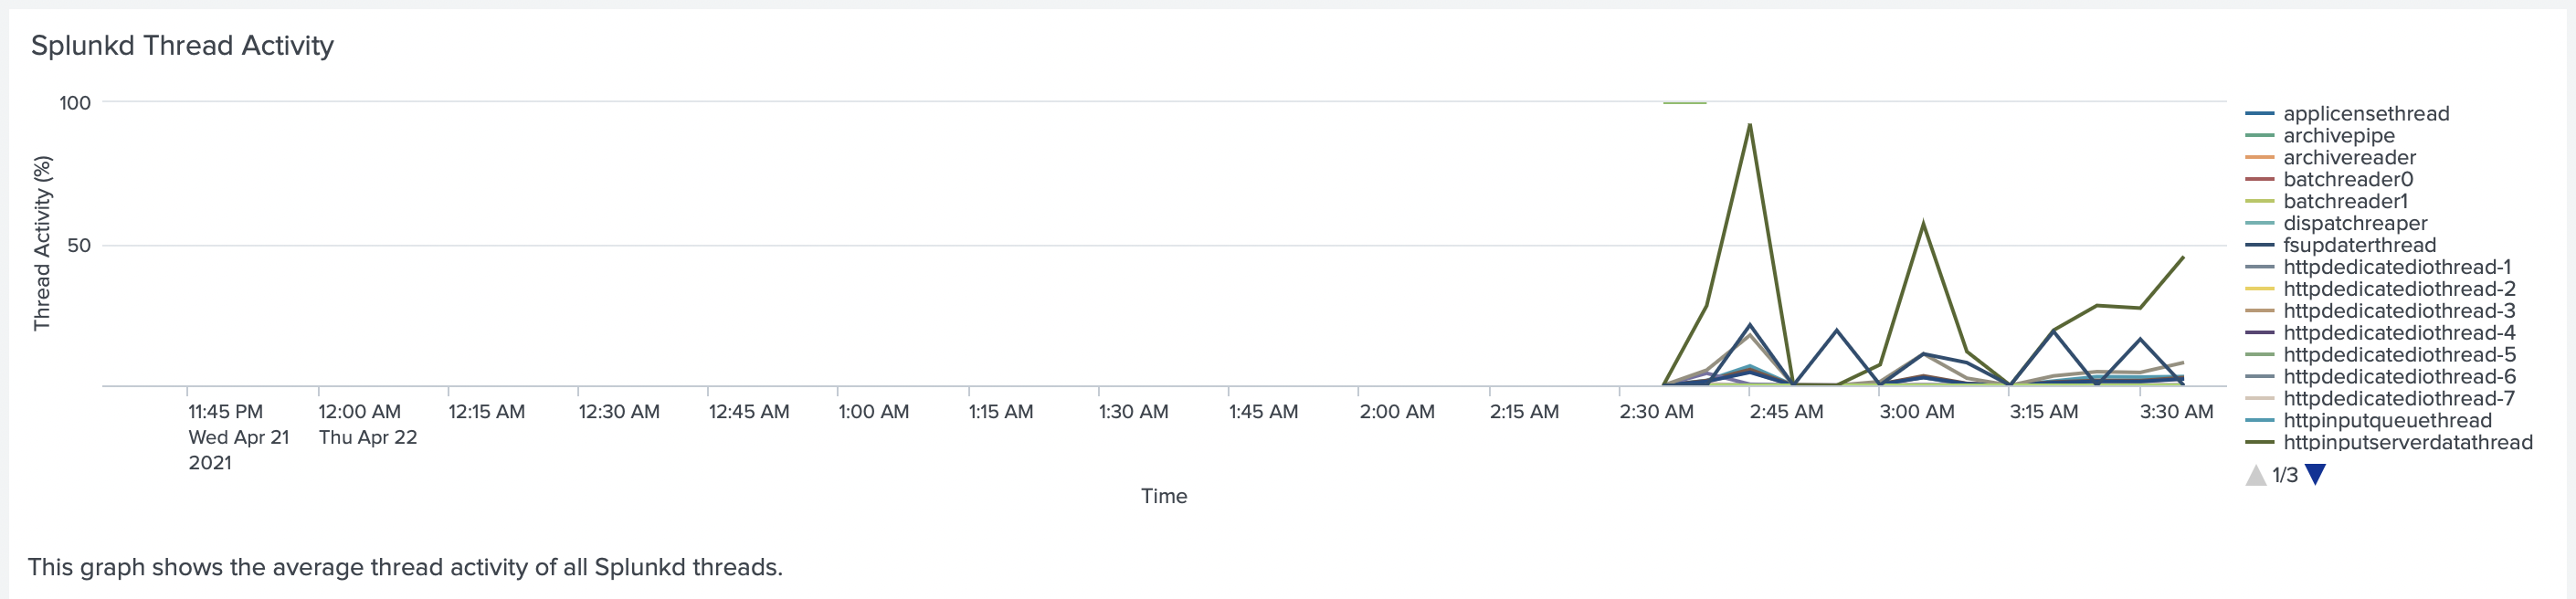
That solved the issue with httpinputserverdatathread, each Splunk HF instance had it below 50%.
But at this point, we started to see a lag in the indexing pipeline of the Splunk Indexer. We decided that it was time to finish our tests and realized that the next step would be scaling our indexing tier and implementing Indexer Cluster.
Lesson learned
By running those tests we have learned:
- Splunk is very configurable. And some default configurations might not work in all environments.
- Always test higher loads on your environments, to be prepared for tomorrow.
- Use all the tools available for troubleshooting performance. We used EC2 monitoring tools with CloudWatch, Splunk Monitoring Console, and of course dashboards provided by our solution Monitoring Docker (OpenShift and Kubernetes).
- We believe that the dashboard Splunk Monitoring Console - Indexing Performance: Advanced - Splunkd Thread Activity
is essential for monitoring the Indexing pipeline and Splunk HTTP Event Collector. We believe in some of the first
runs, we would find it very valuable and find how important it would be to change
dedicatedIOThreadsfor Splunk HTTP Event Collector. - Monitoring Network traffic is vital to estimate the load your network can handle.
- Request Time between the Splunk HEC Client and the Server is a good measurement that all your pipeline behind Splunk HEC is lagging.
An important detail about our tests: Please use them as a guide that can help you investigate performance issues. Please do not use it as a guide for the Splunk environment you need to configure. Each workload, the format of the data, the frequency of the data can be very different from our tests, and in your case, some other configurations might work better.


