Blog
Monitoring Amazon Elastic Container Service (ECS) Clusters with Splunk Enterprise and Splunk Cloud
[UPDATE (2018-06-15)] Based on Amazon ECS Adds Daemon Scheduling, we updated our blog post to show how you can schedule our collectord on ECS by using the new Daemon Scheduling.
[UPDATE (2018-10-15)] Updated to Monitoring Docker v5.2
Amazon EC2 Container Service (ECS) is a highly scalable, high-performance container management service that supports Docker containers and allows you to easily run applications on a managed cluster of Amazon EC2 instances.
Because ECS runs Docker as a Container Engine, our solution for Monitoring Docker works out of the box with it as well.
In our example, we used ECS and Splunk deployed in the same Region and the same VPC. But there are no special requirements for your Splunk Enterprise deployment. You can also use Splunk Cloud with our solution. The only requirement is to give the ECS cluster access to the Splunk HTTP Event Collector endpoint, which is usually deployed on port 8088.
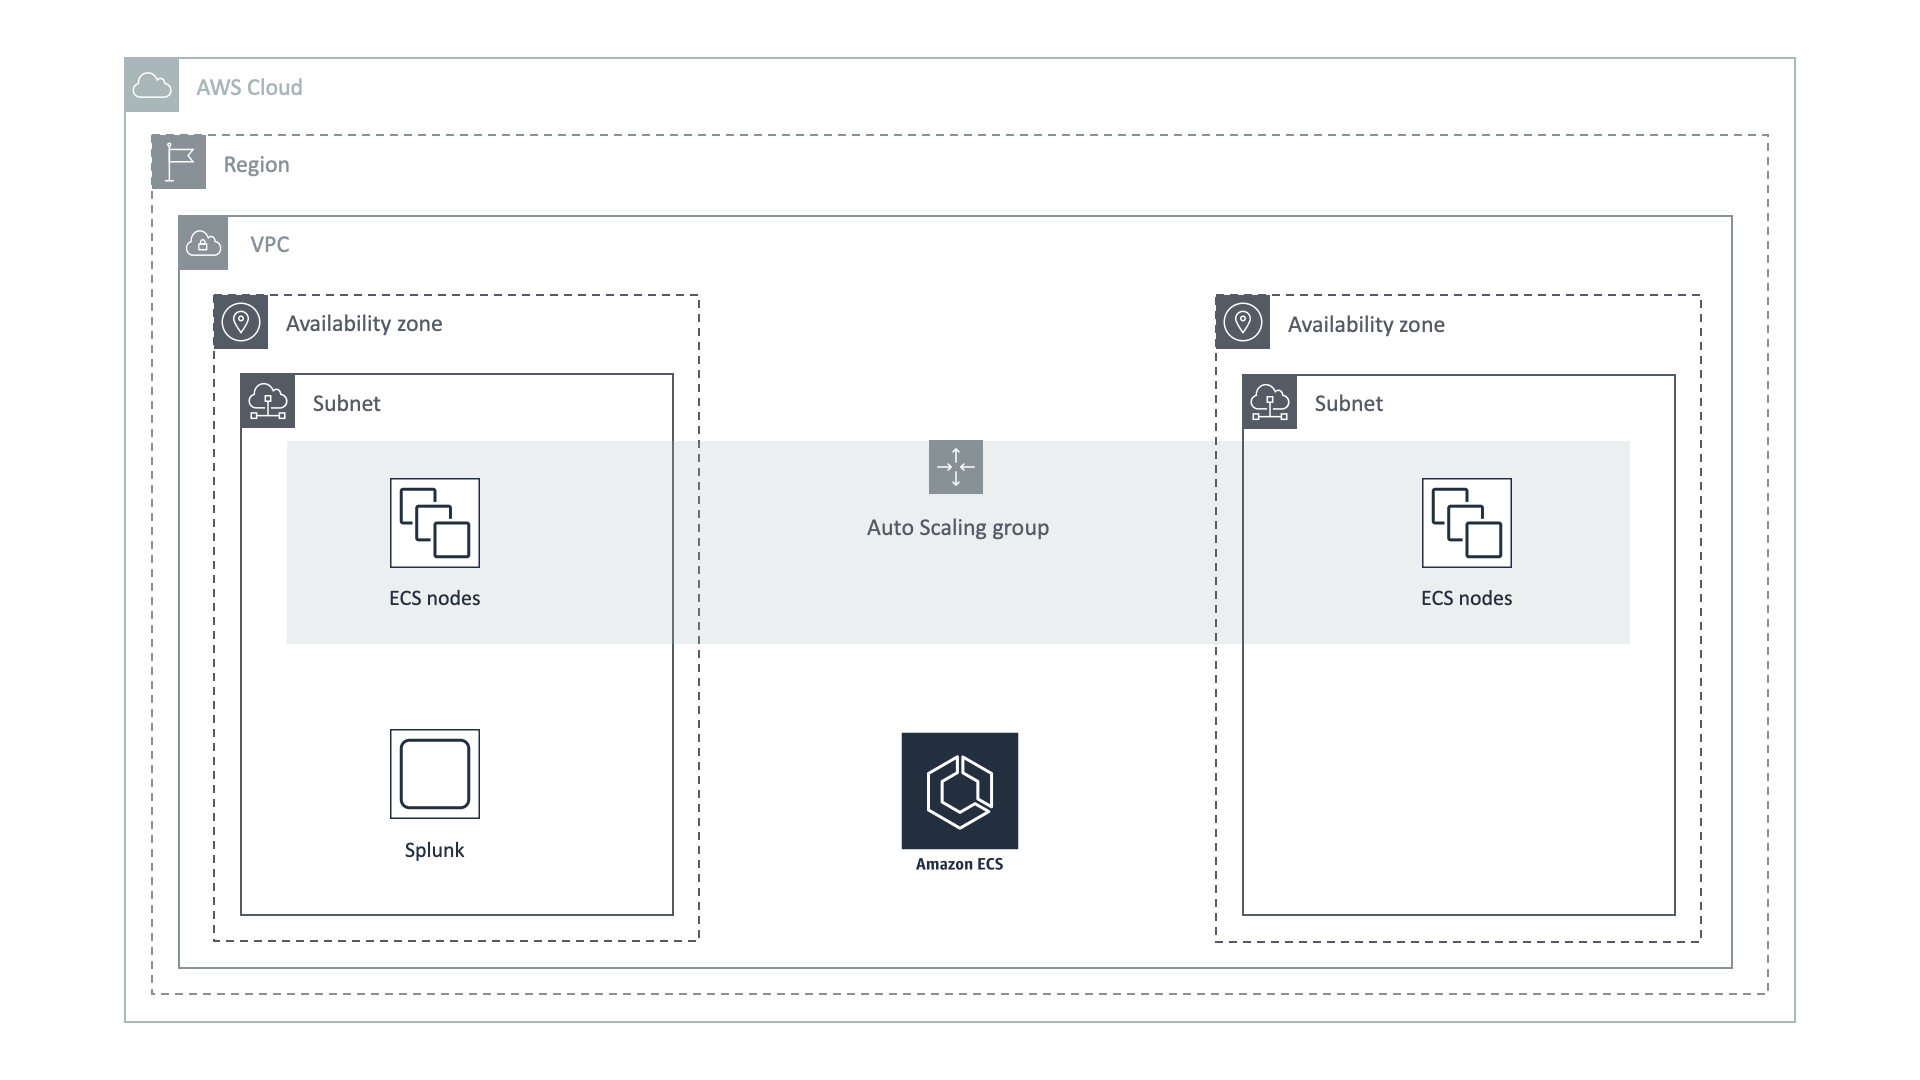
We expect that you have already finished the Splunk configuration from our manual Monitoring Docker Installation, installed our application Monitoring Docker, and enabled HTTP Event Collector in your Splunk environment.
First, you need to create a new Task Definition
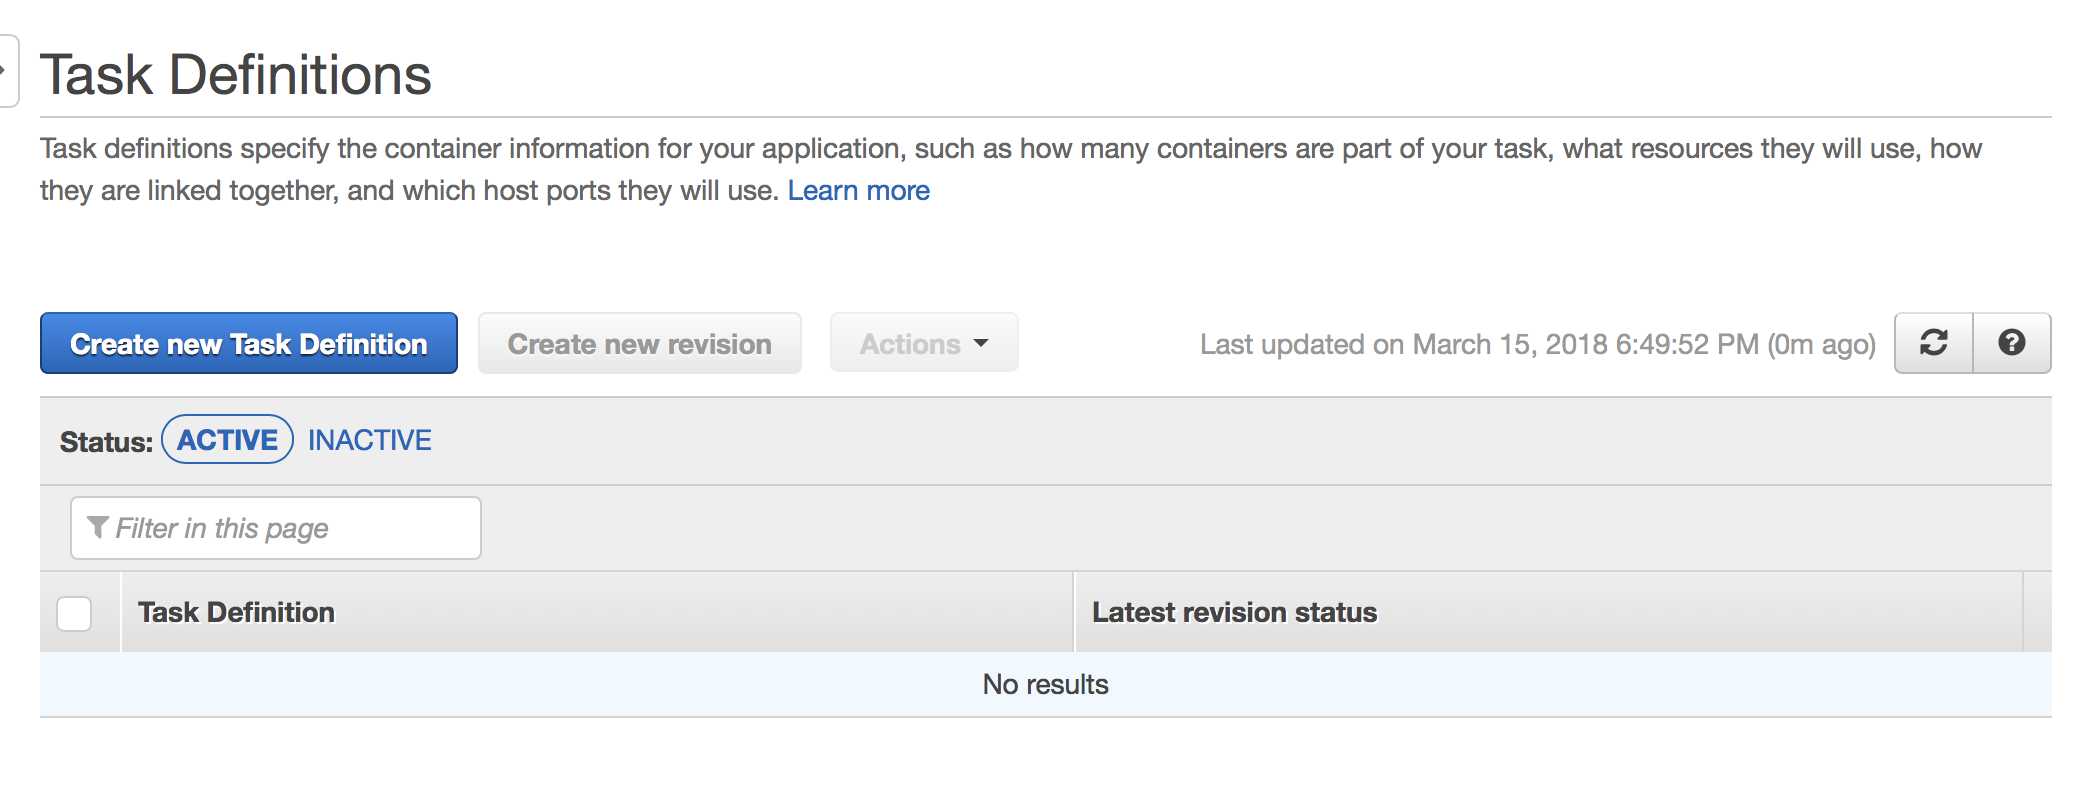
At the very bottom, you can find a Configure JSON button

Use the following template to create a Task Definition, where at a minimum you need to set the URL for your HTTP Event Collector and specify your HTTP Event Collector Token and include the license key (request an evaluation license key with this automated form). You can also revisit Memory and CPU limits specific to your load, and you can adjust those later.
  1{
  2    "containerDefinitions": [
  3        {
  4            "name": "collectorfordocker",
  5            "image": "outcoldsolutions/collectorfordocker:{{ collectorfordocker_version }}",
  6            "memory": "256",
  7            "cpu": "256",
  8            "essential": true,
  9            "portMappings": [],
 10            "environment": [
 11                {
 12                    "name": "COLLECTOR__SPLUNK_URL",
 13                    "value": "output.splunk__url=https://hec.example.com:8088/services/collector/event/1.0"
 14                },
 15                {
 16                    "name": "COLLECTOR__SPLUNK_TOKEN",
 17                    "value": "output.splunk__token=B5A79AAD-D822-46CC-80D1-819F80D7BFB0"
 18                },
 19                {
 20                    "name": "COLLECTOR__SPLUNK_INSECURE",
 21                    "value": "output.splunk__insecure=true"
 22                },
 23                {
 24                    "name": "COLLECTOR__ACCEPTLICENSE",
 25                    "value": "general__acceptLicense=true"
 26                },
 27                {
 28                    "name": "COLLECTOR__LICENSE",
 29                    "value": "general__license=..."
 30                },
 31                {
 32                   "name": "COLLECTOR__EC2_INSTANCE_ID",
 33                   "value": "general__ec2Metadata.ec2_instance_id=/latest/meta-data/instance-id"
 34                },
 35                {
 36                   "name": "COLLECTOR__EC2_INSTANCE_TYPE",
 37                   "value": "general__ec2Metadata.ec2_instance_type=/latest/meta-data/instance-type"
 38                }
 39            ],
 40            "mountPoints": [
 41                {
 42                    "sourceVolume": "cgroup",
 43                    "containerPath": "/rootfs/sys/fs/cgroup",
 44                    "readOnly": true
 45                },
 46                {
 47                    "sourceVolume": "proc",
 48                    "containerPath": "/rootfs/proc",
 49                    "readOnly": true
 50                },
 51                {
 52                    "sourceVolume": "var_log",
 53                    "containerPath": "/rootfs/var/log",
 54                    "readOnly": true
 55                },
 56                {
 57                    "sourceVolume": "var_lib_docker_containers",
 58                    "containerPath": "/rootfs/var/lib/docker/",
 59                    "readOnly": true
 60                },
 61                {
 62                    "sourceVolume": "docker_socket",
 63                    "containerPath": "/rootfs/var/run/docker.sock",
 64                    "readOnly": true
 65                },
 66                {
 67                    "sourceVolume": "collector_data",
 68                    "containerPath": "/data",
 69                    "readOnly": false
 70                }
 71            ],
 72            "volumesFrom": null,
 73            "hostname": null,
 74            "user": null,
 75            "workingDirectory": null,
 76            "privileged": true,
 77            "readonlyRootFilesystem": true,
 78            "extraHosts": null,
 79            "logConfiguration": null,
 80            "ulimits": null,
 81            "dockerLabels": null,
 82            "logConfiguration": {
 83                "logDriver": "json-file",
 84                "options": {
 85                    "max-size": "1m",
 86                    "max-file": "3"
 87                }
 88            }
 89        }
 90    ],
 91    "volumes": [
 92        {
 93            "name": "cgroup",
 94            "host": {
 95                "sourcePath": "/cgroup"
 96            }
 97        },
 98        {
 99            "name": "proc",
100            "host": {
101                "sourcePath": "/proc"
102            }
103        },
104        {
105            "name": "var_log",
106            "host": {
107                "sourcePath": "/var/log"
108            }
109        },
110        {
111            "name": "var_lib_docker_containers",
112            "host": {
113                "sourcePath": "/var/lib/docker/"
114            }
115        },
116        {
117            "name": "docker_socket",
118            "host": {
119                "sourcePath": "/var/run/docker.sock"
120            }
121        },
122        {
123            "name": "collector_data",
124            "host": {
125                "sourcePath": "/var/lib/collectorfordocker/data/"
126            }
127        }
128    ],
129    "networkMode": null,
130    "memory": "256",
131    "cpu": "0.5 vcpu",
132    "placementConstraints": [],
133    "family": "collectorfordocker",
134    "taskRoleArn": ""
135}
After saving it, you can use this Task Definition on your ECS clusters.
The next step is to schedule this Task on every host we have. Open your cluster and go to the Services tab
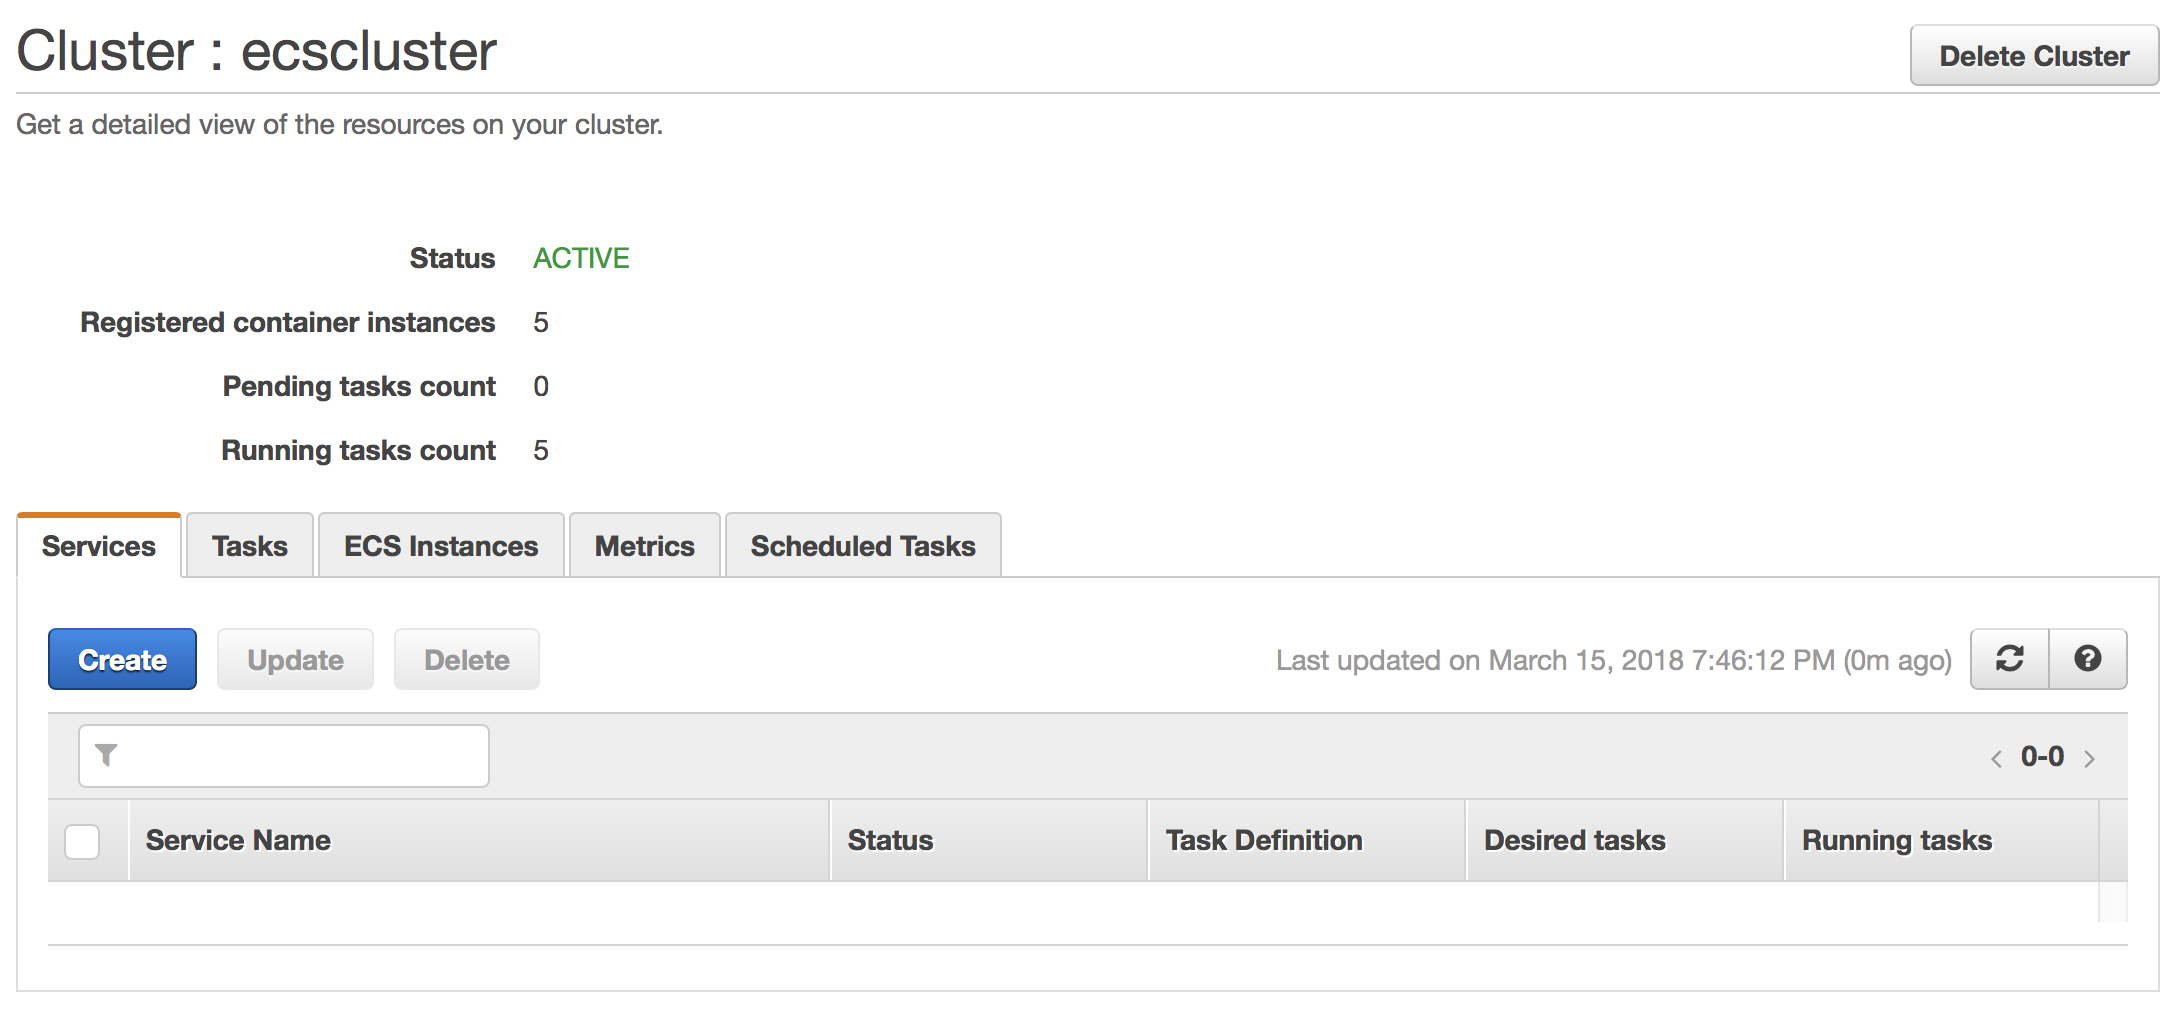
Create a new service with the following configuration:
- Launch type - EC2
- Task Definition - choose the just-created task definition
collectorfordocker - Cluster - the name of your ECS cluster
- Service name -
collectorfordocker - [UPDATE (2018-06-15)] Service Type -
DAEMON - Minimum healthy percent - keep defaults (we aren’t going to use them)
- On the second step, choose: Load balancer type - None
- On the third step: Service Auto Scaling - Do not adjust the service’s desired count
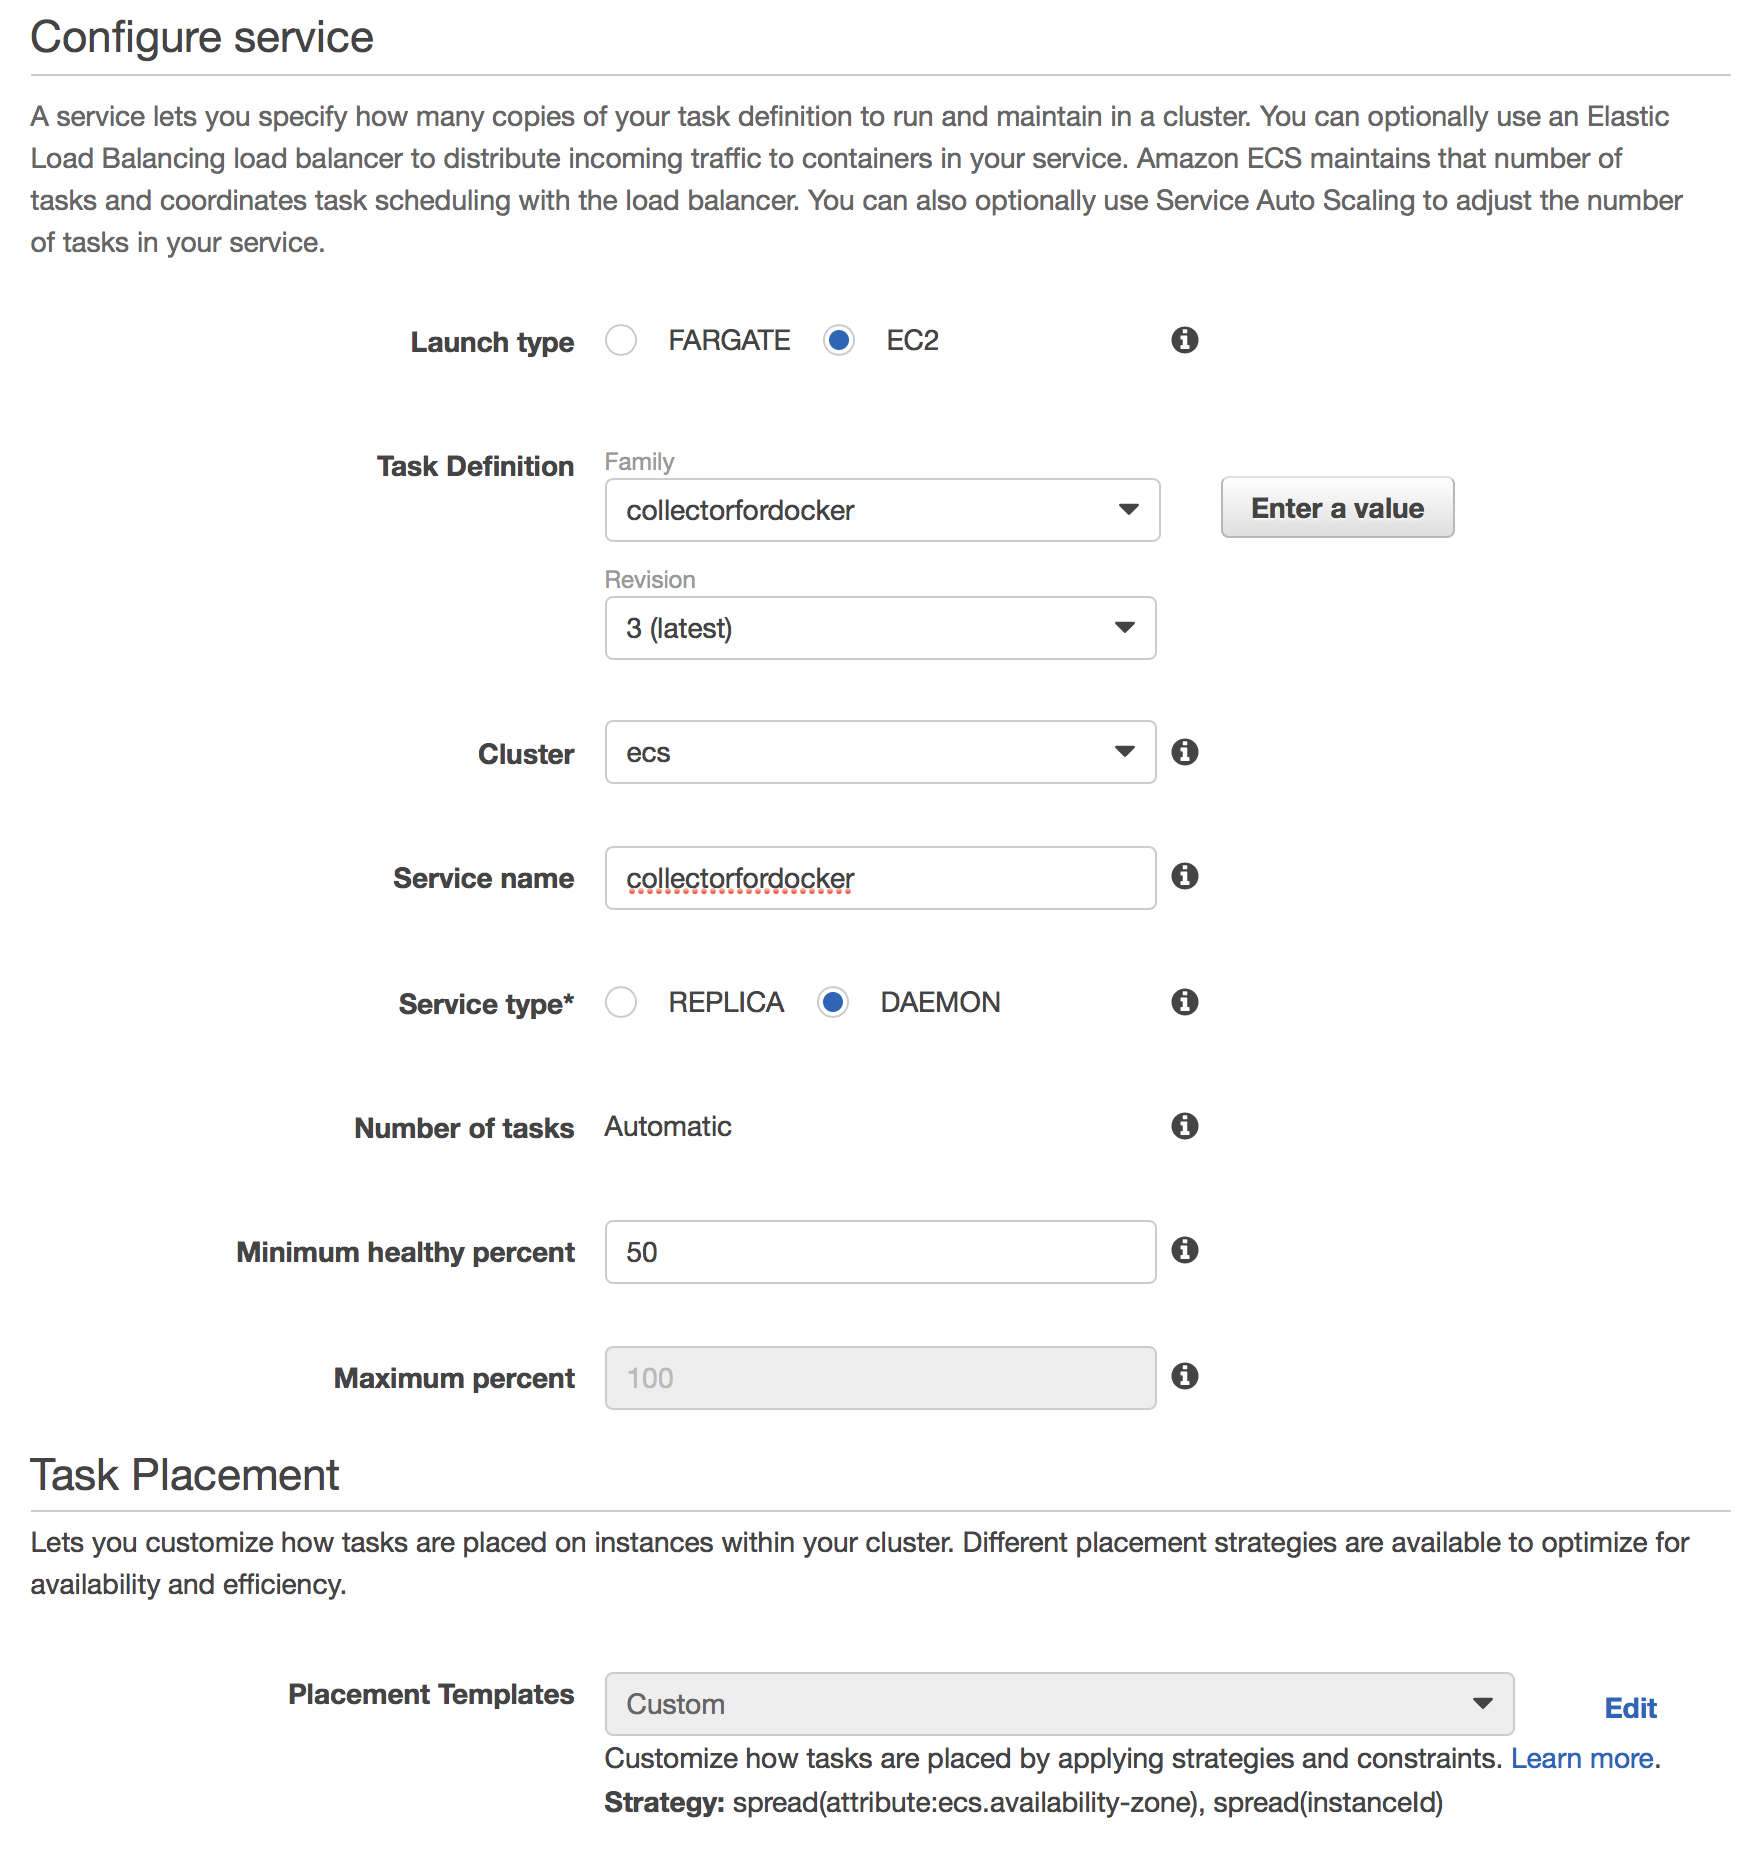
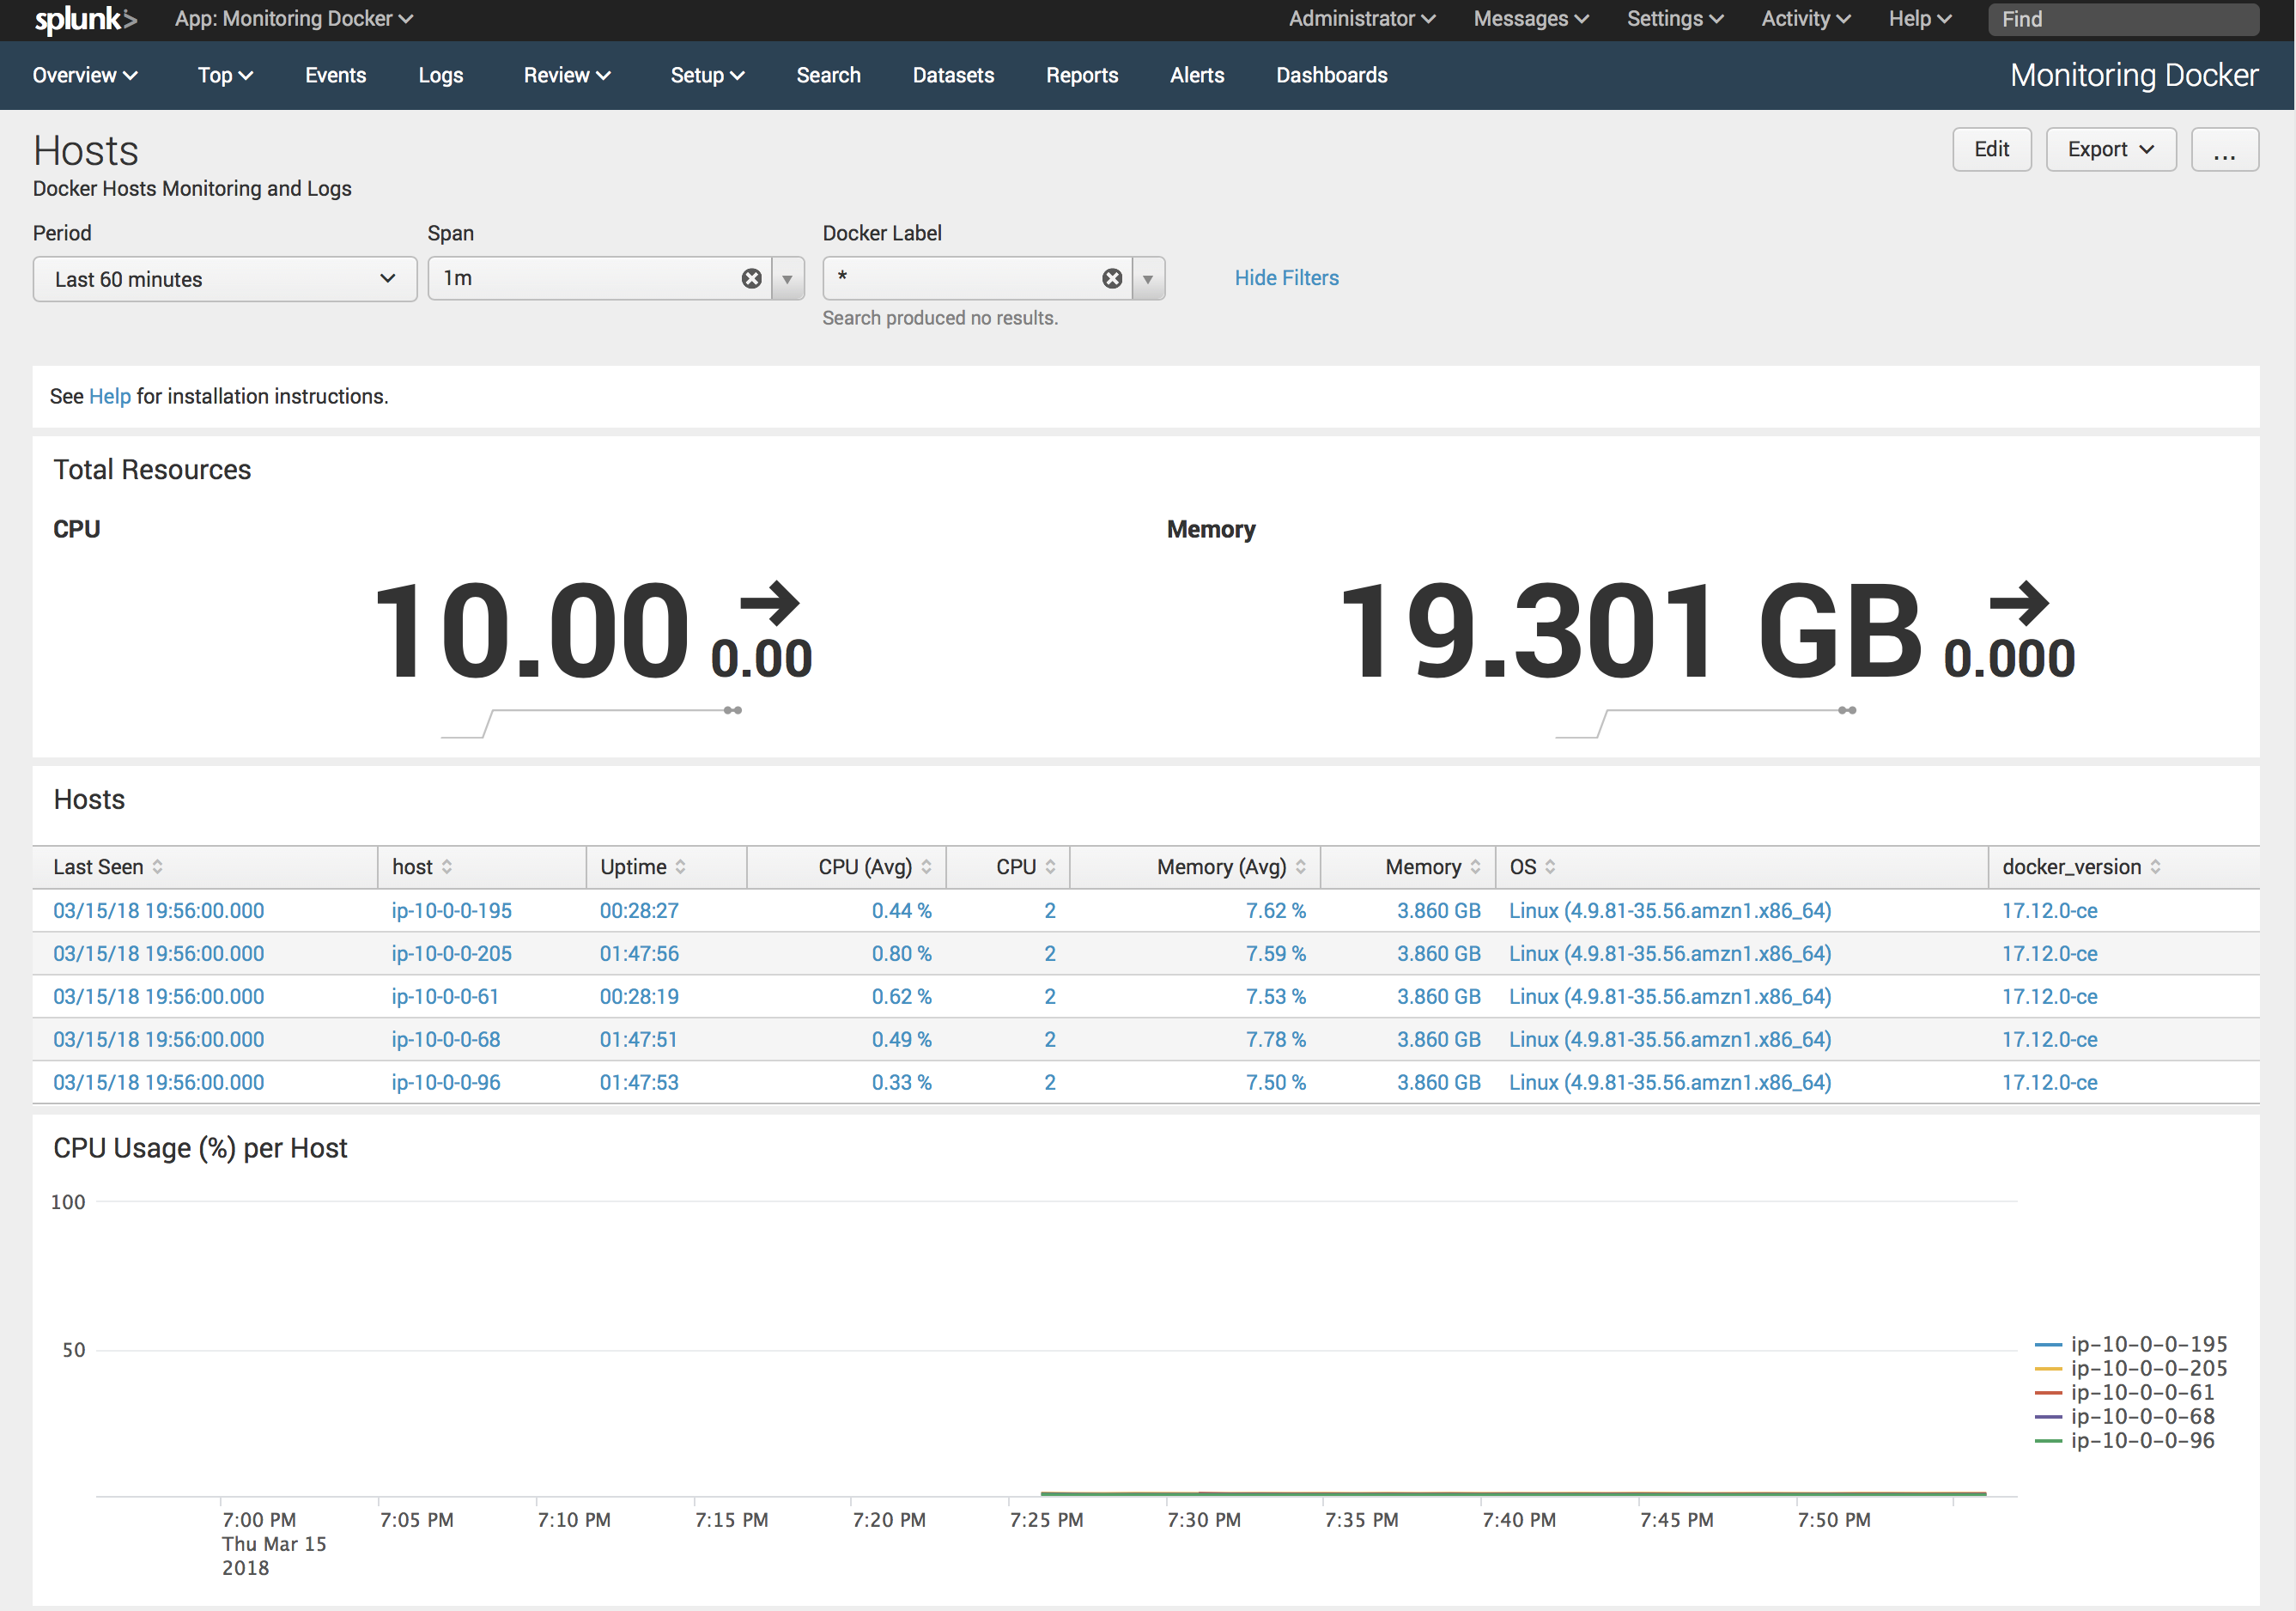
After creating the service, give it a minute to download the image and set up our collectord. If everything works as expected, you should see data in the Monitoring Docker application.
Known issues
- By default, collectord picks up Docker daemon logs from
/rootfs/var/log/docker. You need to update macromacro_docker_host_logs_dockerand change it to
1(`macro_docker_host_logs` AND source="*var/log/docker*")

