Stop building OpenShift dashboards. We did it for you.
Red Hat OpenShift Logging forwards logs to Splunk and stops there. So does the OpenTelemetry Collector. Collectord ships a complete Splunk app for OpenShift: 50+ dashboards, 37 pre-configured alerts, search macros, lookups, and field extractions, built for exactly the data the agent forwards - projects, DeploymentConfigs, BuildConfigs and builds, the control plane, events, security, and the OpenShift audit log.
Install in ten minutes. Start investigating in the eleventh.
Looking for screenshots? The Monitoring OpenShift and Monitoring Kubernetes apps share their dashboard designs, and the Kubernetes gallery shows every one of them full-size. This page lists what the OpenShift app contains, and what only it has: projects instead of namespaces, DeploymentConfigs, BuildConfigs and builds, ClusterResourceQuotas, and the OpenShift API audit log.
What’s in the app
The catalog below follows the app’s own menu. Dashboards marked OpenShift exist only in the OpenShift app.
Overview and workloads
The Overview is where on-call lands: the alerts that fired in the last 24 hours, every project with its workload counts, and the event timeline. From there, one view per workload kind, each showing the objects, the pods behind them, and the events that explain what happened to them.
Overview
Alerts from the last 24 hours, projects with their DaemonSet, Deployment, DeploymentConfig, BuildConfig, build and pod counts, workload counters with trends, and the event timeline.
Applications and Workloads
Every workload kind in one place - DaemonSets, Deployments, CronJobs, Jobs, ReplicaSets, ReplicationControllers, StatefulSets, DeploymentConfigs, BuildConfigs, builds and pods - with a drill-down into each.
Deployments
Deployments, the pods behind each one, and their events - the rollout that did not finish, and why.
Deployment Configs OpenShift
The same view for OpenShift DeploymentConfigs: each config, its pods, and the events around its rollouts.
Build Configs OpenShift
BuildConfigs with the builds they produced, the build pods, and their events.
Builds OpenShift
Build history - the build that failed, the pod that ran it, and the events that explain the failure.
Stateful Sets
Stateful workloads with their ordered pods, replica status, and events.
Daemon Sets
Per-node coverage of every DaemonSet - desired versus ready, the pod on each node, and events. The view you need for node agents.
Cron Jobs and Jobs
Run history, the pods each run created, and their events - find the cron that has been failing silently for a week.
Replica Sets and Replication Controllers
Replica status and pods for ReplicaSets and ReplicationControllers, with the events behind scaling and restarts.
Pods
Every pod with its project, node, phase and restarts - the entry point to the per-pod investigation view.
Monitoring: nodes, pods, containers, processes
One view per layer of the stack, each with the same project, node and period filters, so a drill-down from any dashboard lands with the context already set.
Hosts
Per-node inventory and health - load, memory, network, disk, kubelet status, and node conditions.
Host
One node in depth: CPU, memory, disk and network over time, and the pods scheduled on it.
Pod
Per-pod metrics, logs, events, conditions, and restarts - the single pane for any pod investigation.
Container
Per-container CPU, memory, IO and network, next to the container's own logs.
Process
Processes inside containers and on the hosts - CPU, memory and IO per process.
Workload
The pods of one workload side by side: CPU, memory (RSS), IO read and write with wait times, and network traffic, packets, errors and drops by pod.
Top: outlier finders
Top: Hosts
Per-node ranking by load, memory, and network. Pair with Allocatable Resources to find lopsided nodes.
Top: Pods
The heaviest pods by CPU, memory, network, and restarts. Filter by project.
Top: Containers
Same shape as Top: Pods, scoped to containers - for multi-container pods and noisy sidecars.
Top: Processes
The heaviest processes across all hosts - CPU, memory, IO. Catches runaway sidecars and host-level offenders.
Events and workload investigation
The 26.04 release redesigned event investigation around real triage workflows: five views instead of one events page.
Event Timeline
The main event search and filtering interface - severity classification, color-coded rows, filters for cluster, project, kind, and reason.
Event Overview
High-level KPIs - warning events, critical conditions, failed scheduling, projects with warnings - with drill-downs into the specialized views.
Workload Failures
CrashLoopBackOff, OOMKilled, image pull failures, probe failures - count KPIs and a detailed table for each.
Scheduling and Node Health
FailedScheduling, NodeNotReady, evictions, and node pressure events (memory, disk, PID).
Recurring Problems
A 7-day window that surfaces patterns: top recurring warnings, problematic workloads, projects with the most warnings.
Logs
Logs
Container and host logs with the same project, pod and container filters as the dashboards. Start here, or arrive from a drill-down with the filters already set.
Cluster: the control plane
Health of the components that run the cluster, from the metrics Collectord collects on the control-plane nodes, plus the OpenShift API audit log.
API Server
Request rate, latency percentiles, error rates, certificate expiry, and active watches.
Controller
Workqueue depth and latency, leader election state, reconciliation rates.
Scheduler
Scheduling latency, attempts, end-to-end duration. Pair with the FailedScheduling analysis under Events.
Kubelet
Per-node kubelet health - runtime operations, image GC, volume operations, pod lifecycle latencies.
etcd
Leader status, fsync and commit durations, GRPC health, fd usage, failed proposals - the eight signals that matter, each with an alert.
Audit (overview)
OpenShift API audit log analysis - verbs, resources, projects, response codes - and a single request followed end to end by its AuditID.
Review: capacity, quotas, storage, GPU
Allocatable Resources
Capacity versus allocatable versus requested and limited CPU, memory and pods - per node and for the whole cluster. The capacity-planning anchor view.
Clusters (Allocations and usage)
Per-cluster hosts, pods, requests, limits and usage, in absolute numbers and in percent - for the teams that run more than one cluster.
Projects (Resources) OpenShift
CPU and memory usage per project - the tenant breakdown of a shared cluster.
Resource Quotas
ResourceQuota usage against the hard limits, per project.
Cluster Resource Quotas OpenShift
ClusterResourceQuota usage across the projects each quota selects. Collectord watches ClusterResourceQuotas by default on OpenShift.
CPU (Throttled, Limits, Requests)
Throttled versus limits versus requests, per container. Find CFS-throttled containers fast.
Storage
PVC usage, mount stats, growth trends. Tied to the "Persistent Volume Claim space is low" alert.
Disk Stats
Per-device and per-mount IOPS, throughput, queue depth, and latency.
Network (overview)
Per-pod and per-host RX/TX with geographic mapping of remote endpoints.
Nvidia (GPU)
GPU utilization, memory, SM activity, power draw, temperature - for ML and AI workloads. Needs the nvidia-smi DaemonSet on the GPU nodes.
Security and audit
Who got into what, which pods run with more than they should, and where the traffic goes.
Access
sshd logins on the nodes, sudo activations, exec sessions into pods, and forbidden project access - the four ways in, on one page.
Audit (users and projects)
Per-user activity from the audit log - project access, write verbs, read verbs, and exec into pods. "Who exec'd into what, when."
Objects (Pods)
Pod security posture - host network, host paths, image pull policies, security context changes, restart policies, and pod age.
Privileged containers and enabled capabilities
Containers whose processes run as root (effective UID 0) and containers with elevated capabilities - the container-escape surface.
Network (connections)
Inbound and outbound connections per pod, including external destinations.
Network (traffic)
Volume by source, destination and port, geographic mapping, top-talker pods. Pair with connections for full network visibility.
Setup and self-monitoring
Collectord usage
Every Collectord instance with its version and license status, and the LicenseID that support asks for.
Collectord metrics
The agent's own throughput, errors and lag - the data behind the Collectord health alerts.
Splunk Usage Report
How much data the app ingests, by project, pod and sourcetype - the numbers to plan a Splunk license around.
Help
The installation and upgrade instructions, inside the app.
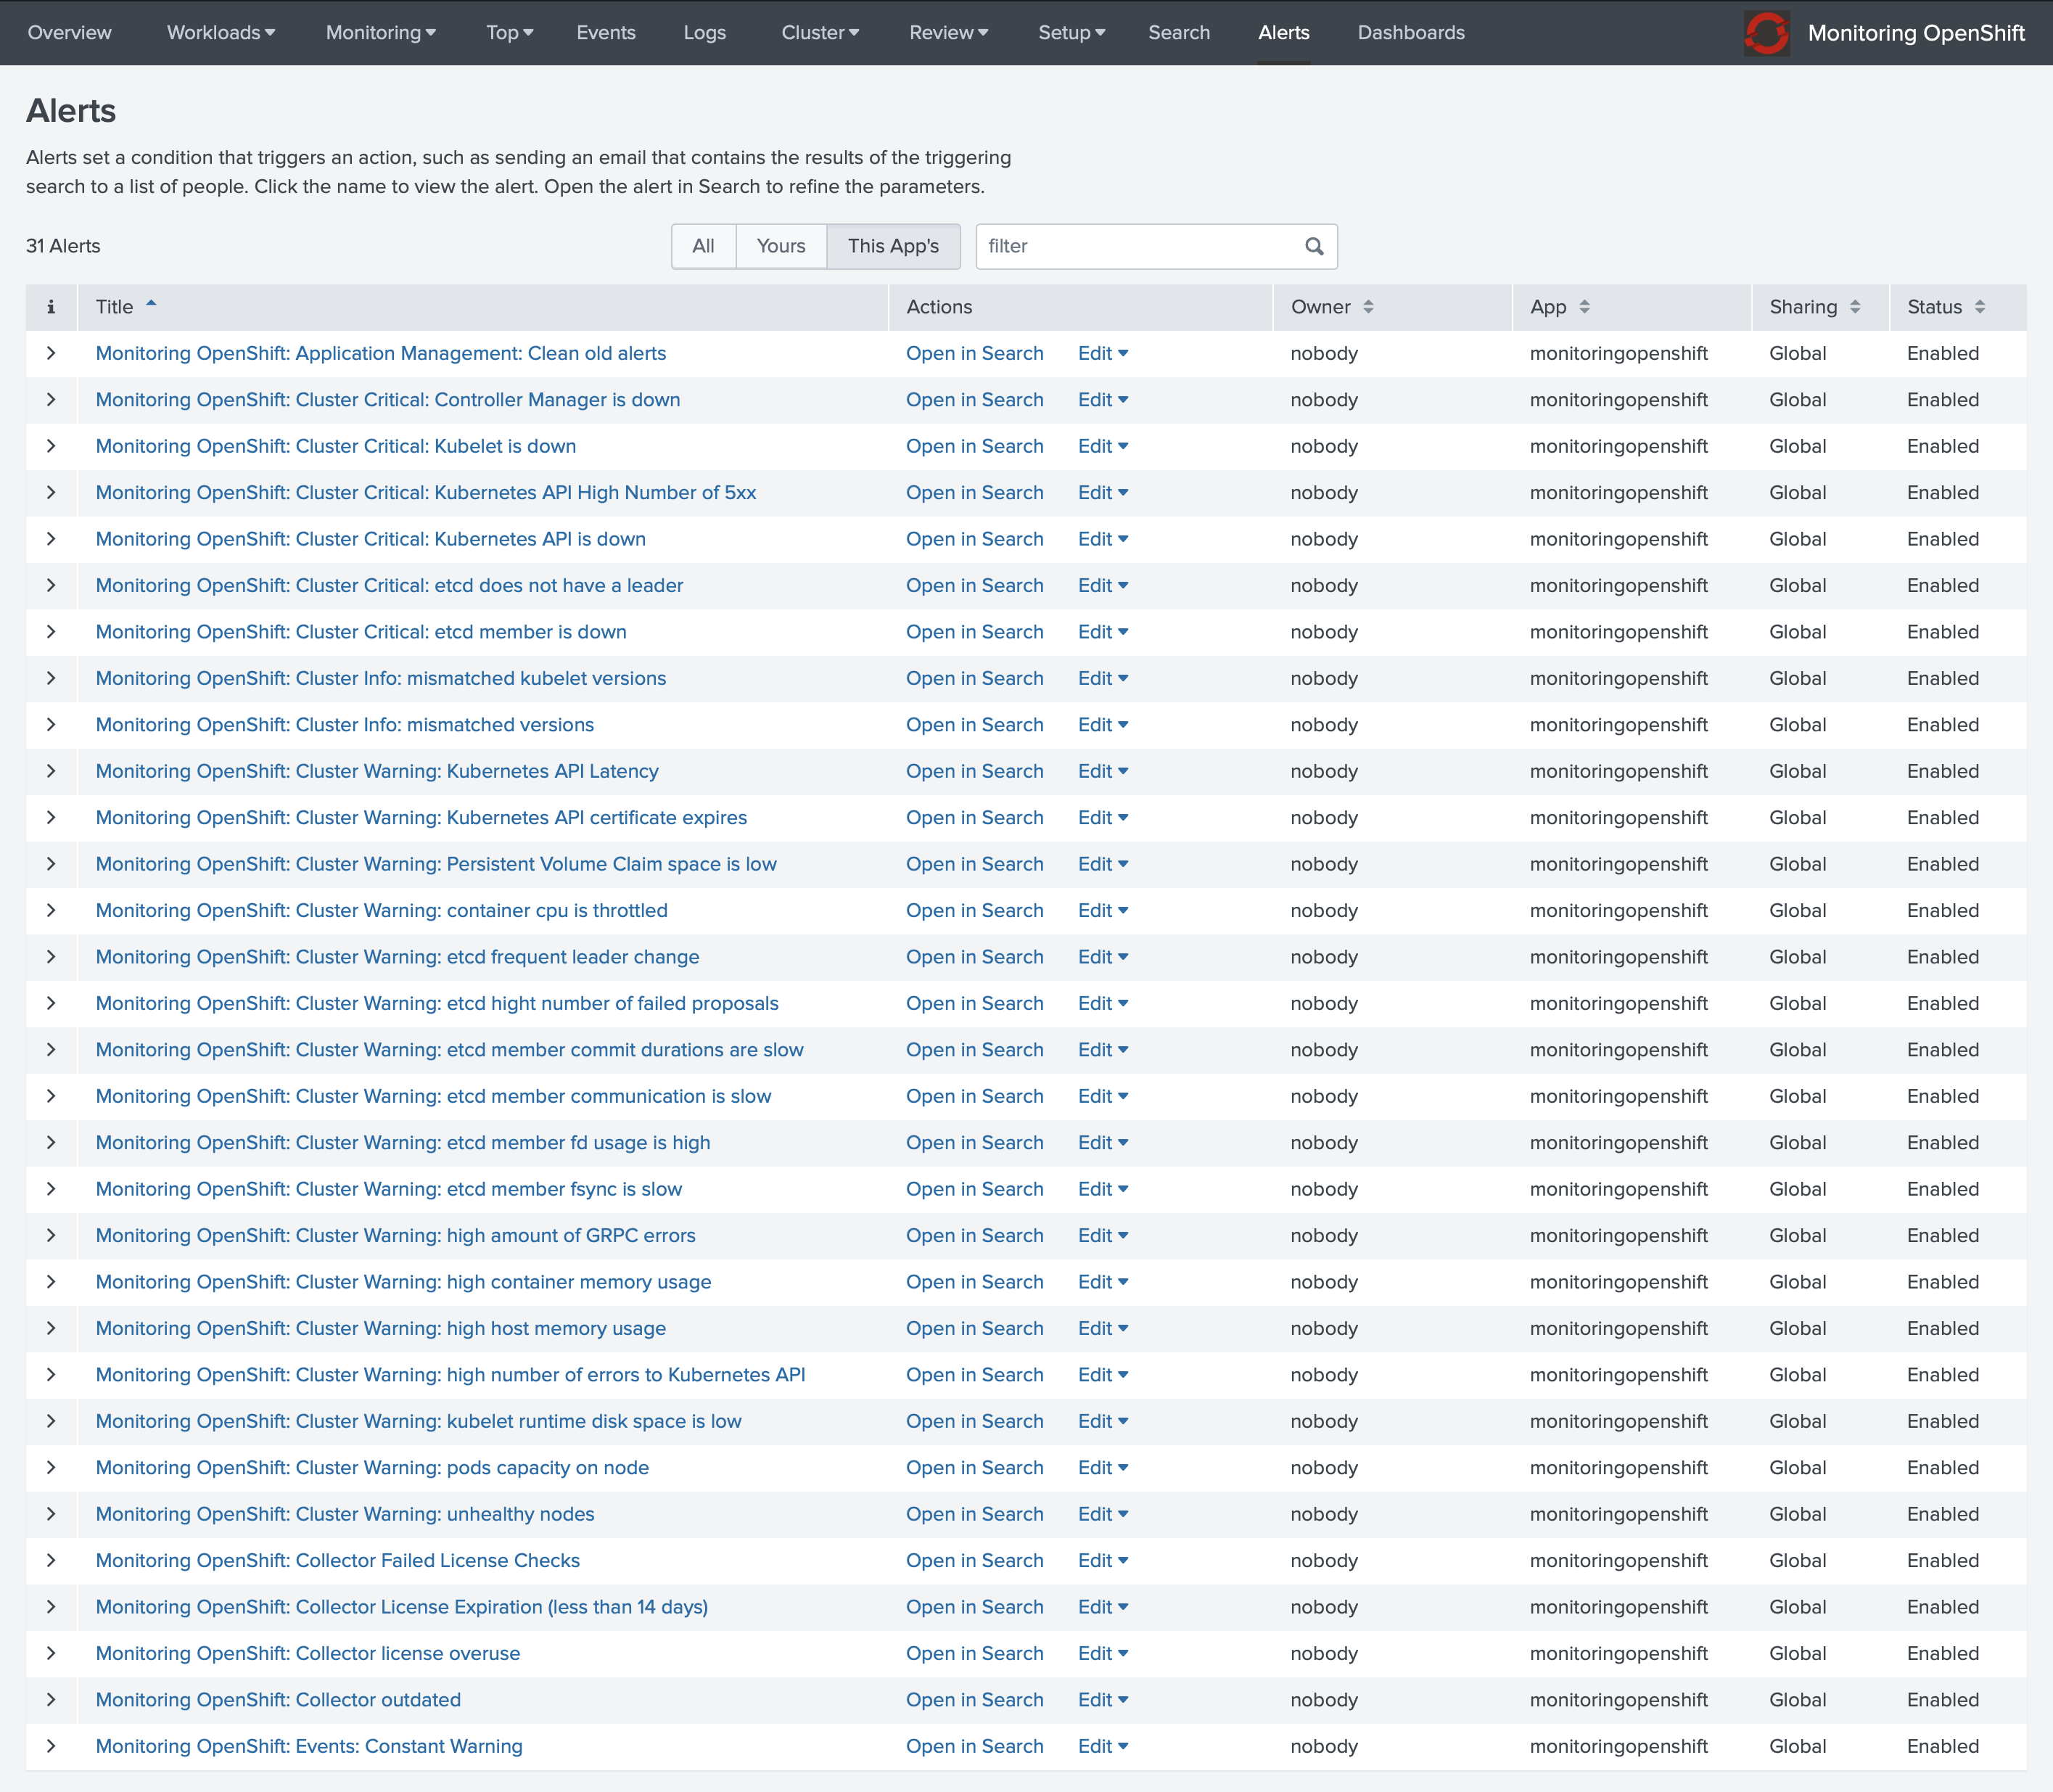
The app installs alerts the same way it installs dashboards - out of the box, no SPL to write.
A sampling of what’s included:
- Control plane: Kubernetes API down / 5xx / latency / errors / certificate expiry, etcd member down / no leader / leader churn / slow fsync / slow commits / failed proposals / fd usage / GRPC errors, Controller Manager down, Kubelet down
- Workload and hosts: container CPU throttled, high container memory, high host CPU, high host memory
- Capacity: pods capacity on node, node reservation of CPU or memory above 90 percent, PVC space low, kubelet runtime disk space low
- Cluster health: unhealthy nodes, node conditions, mismatched versions, mismatched kubelet versions, constant warning events
- Operational hygiene: Collectord pipeline errors, WARN or ERROR logs, growing indexing lag, license expiration and overuse
Each alert has a recommended severity, suppression window, and dispatch - install once and they start firing on real conditions.
→ Full alert reference for OpenShift
How it gets there
Every dashboard is powered by data Collectord collects from the cluster, from a Red Hat certified image with FIPS 140 validated builds:
- Container logs from every node, with no sidecars - two DaemonSets, one for the control-plane nodes and one for the workers, plus one add-on Deployment
- Container, host, process, and network metrics
- OpenShift events from the API server
- Pods, Nodes, ResourceQuotas and ClusterResourceQuotas watched by default; any other object kind on request
- OpenShift API audit logs, read from the control-plane nodes by default; OpenShift 4 writes them out of the box, OpenShift 3.x needs audit logging enabled first
- Optional Prometheus metrics from any pod, via annotations
- Optional Nvidia GPU metrics from an nvidia-smi DaemonSet you deploy on the GPU nodes
Install Collectord and the Splunk app once, and every dashboard above lights up with live data, with one exception: Nvidia (GPU) needs the nvidia-smi DaemonSet on the GPU nodes. No per-dashboard configuration, no per-cluster wiring.
→ Installation in 10 minutes · How Collectord compares to OpenShift Logging and the OpenTelemetry Collector · Monitoring OpenShift on Splunkbase
See them in your Splunk in ten minutes
30-day free trial. No credit card. No install limit. Working dashboards within ten minutes of oc apply.