Outcold Solutions is sponsoring Splunk .conf26 - see you there!
Pre-built Splunk Dashboards for Kubernetes & OpenShift
Stop building Kubernetes dashboards. We did it for you.
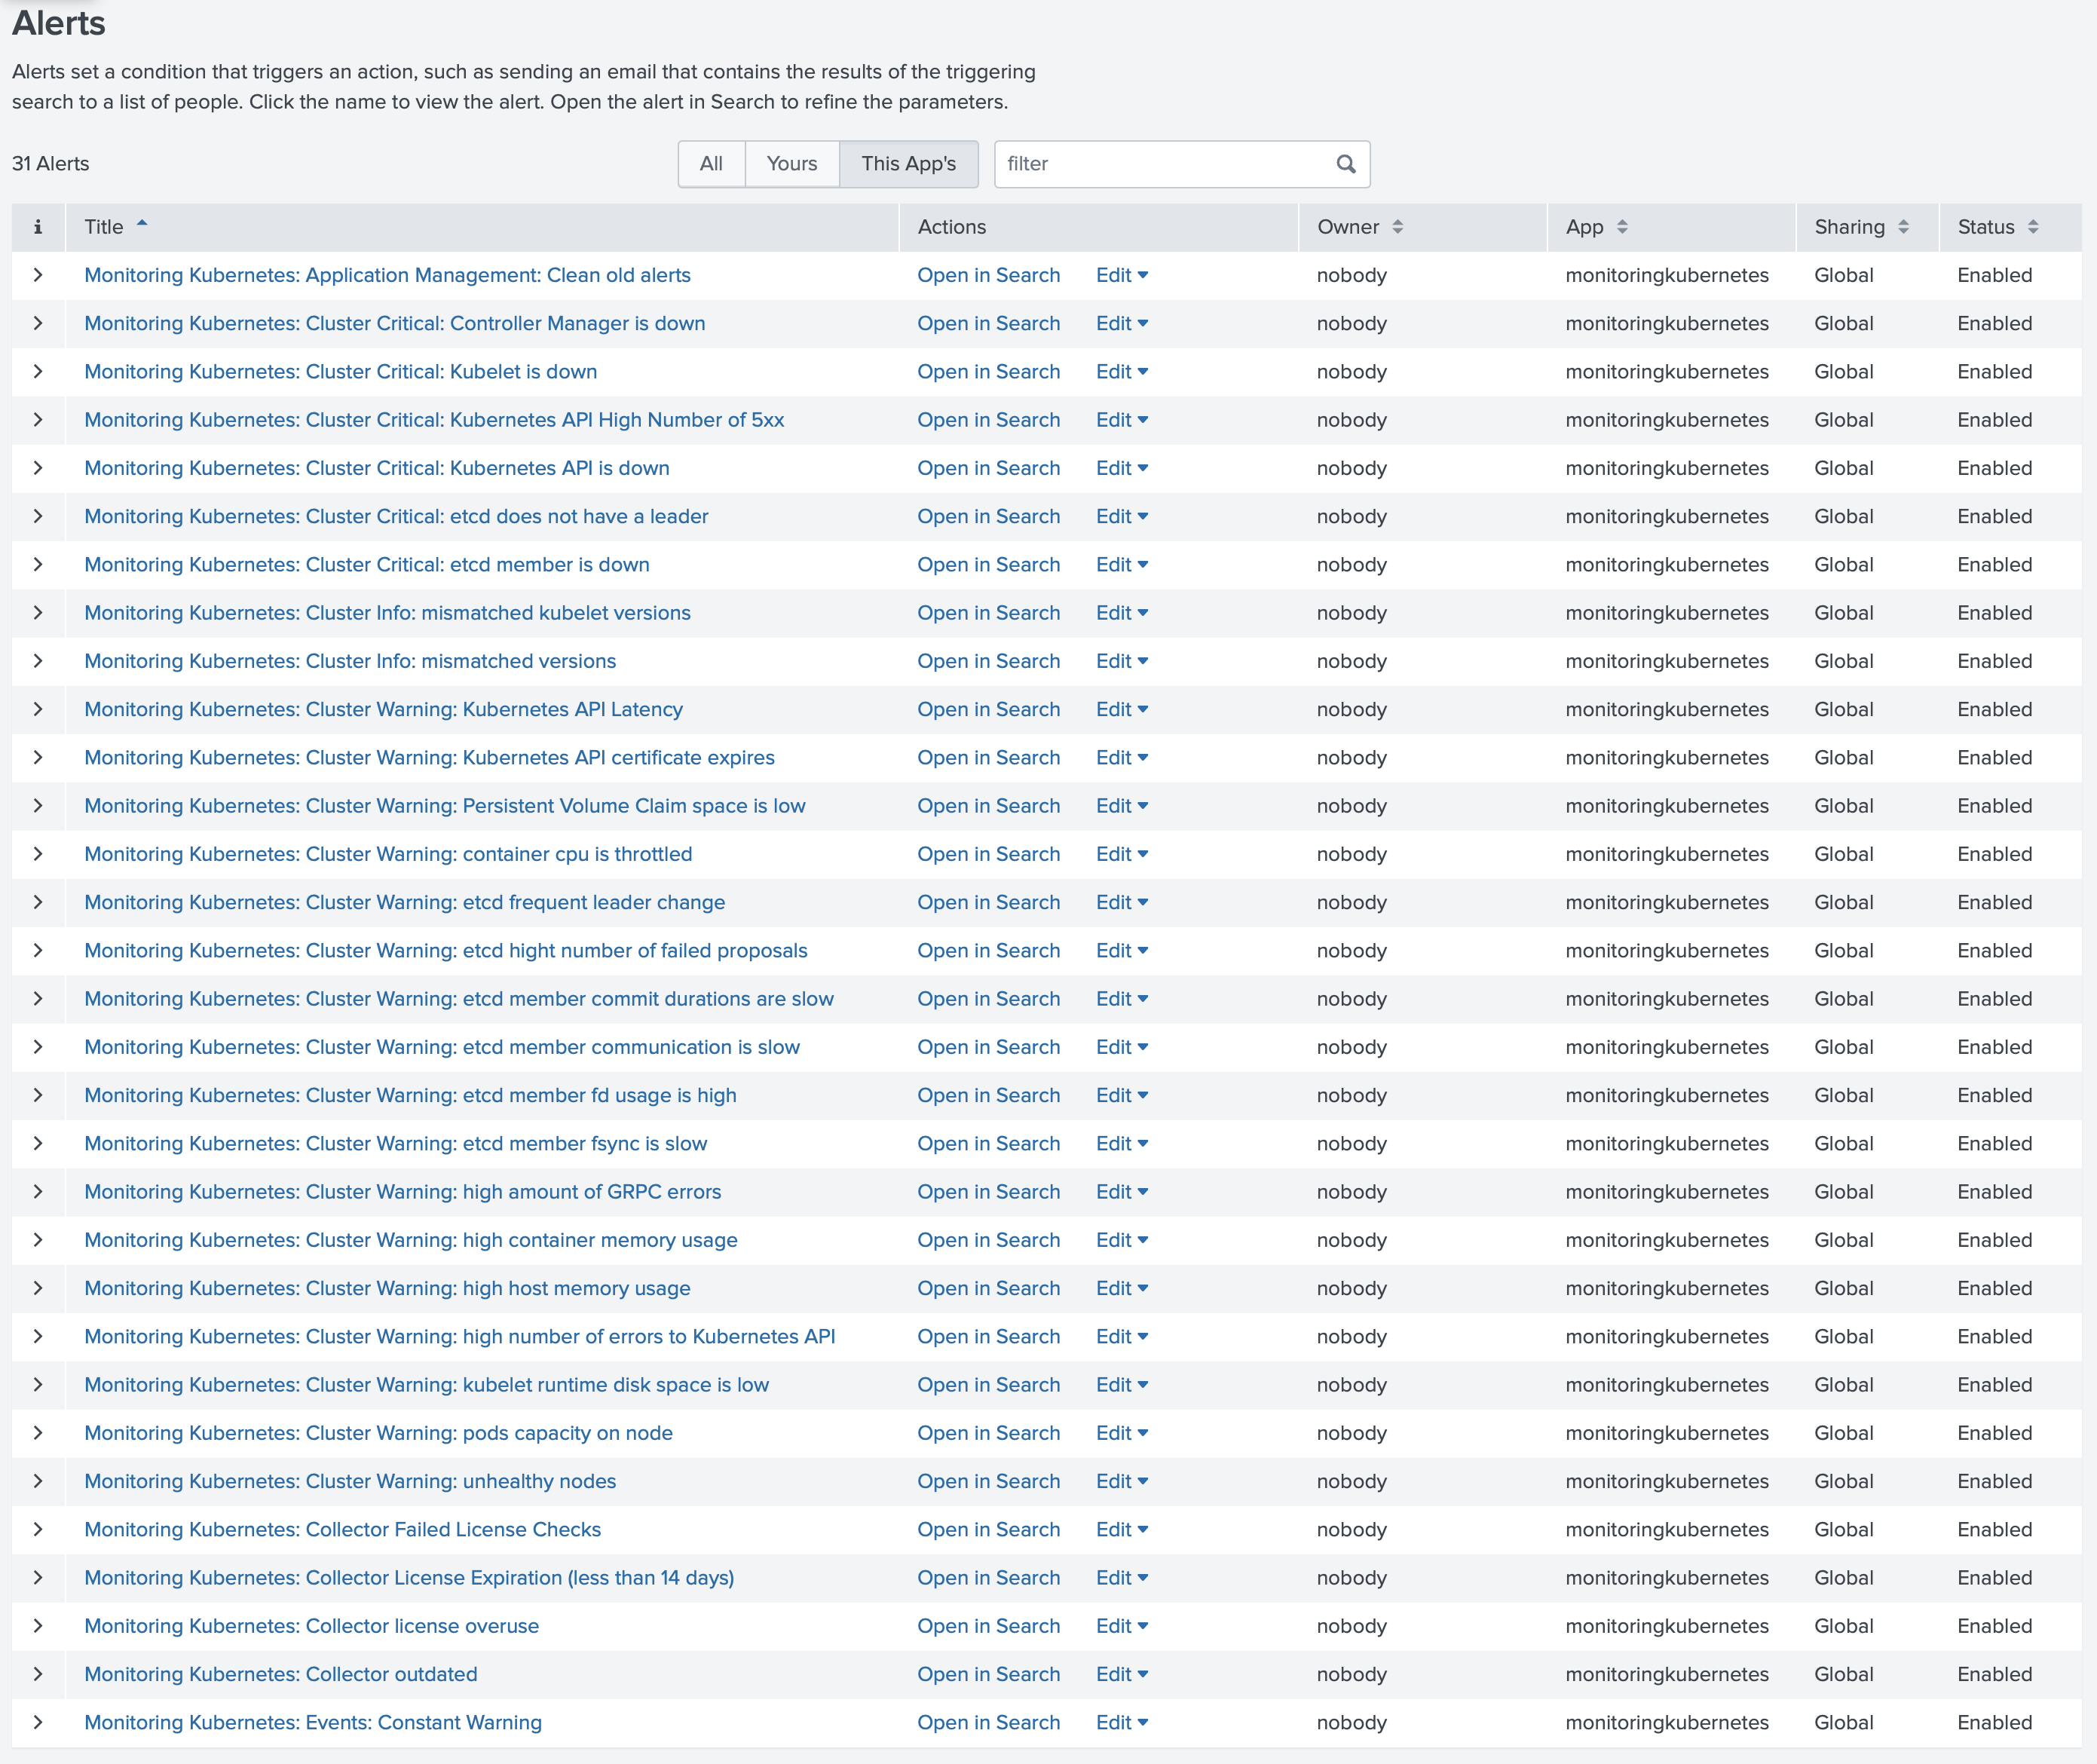
Every alternative - Splunk Connect for Kubernetes, OpenTelemetry, Fluent Bit, vendor agents - ships data. Collectord ships a complete Splunk app: 50+ dashboards, 39+ pre-configured alerts, search macros, lookups, and field extractions for Kubernetes, OpenShift, and Docker.
Install in ten minutes. Start investigating in the eleventh.
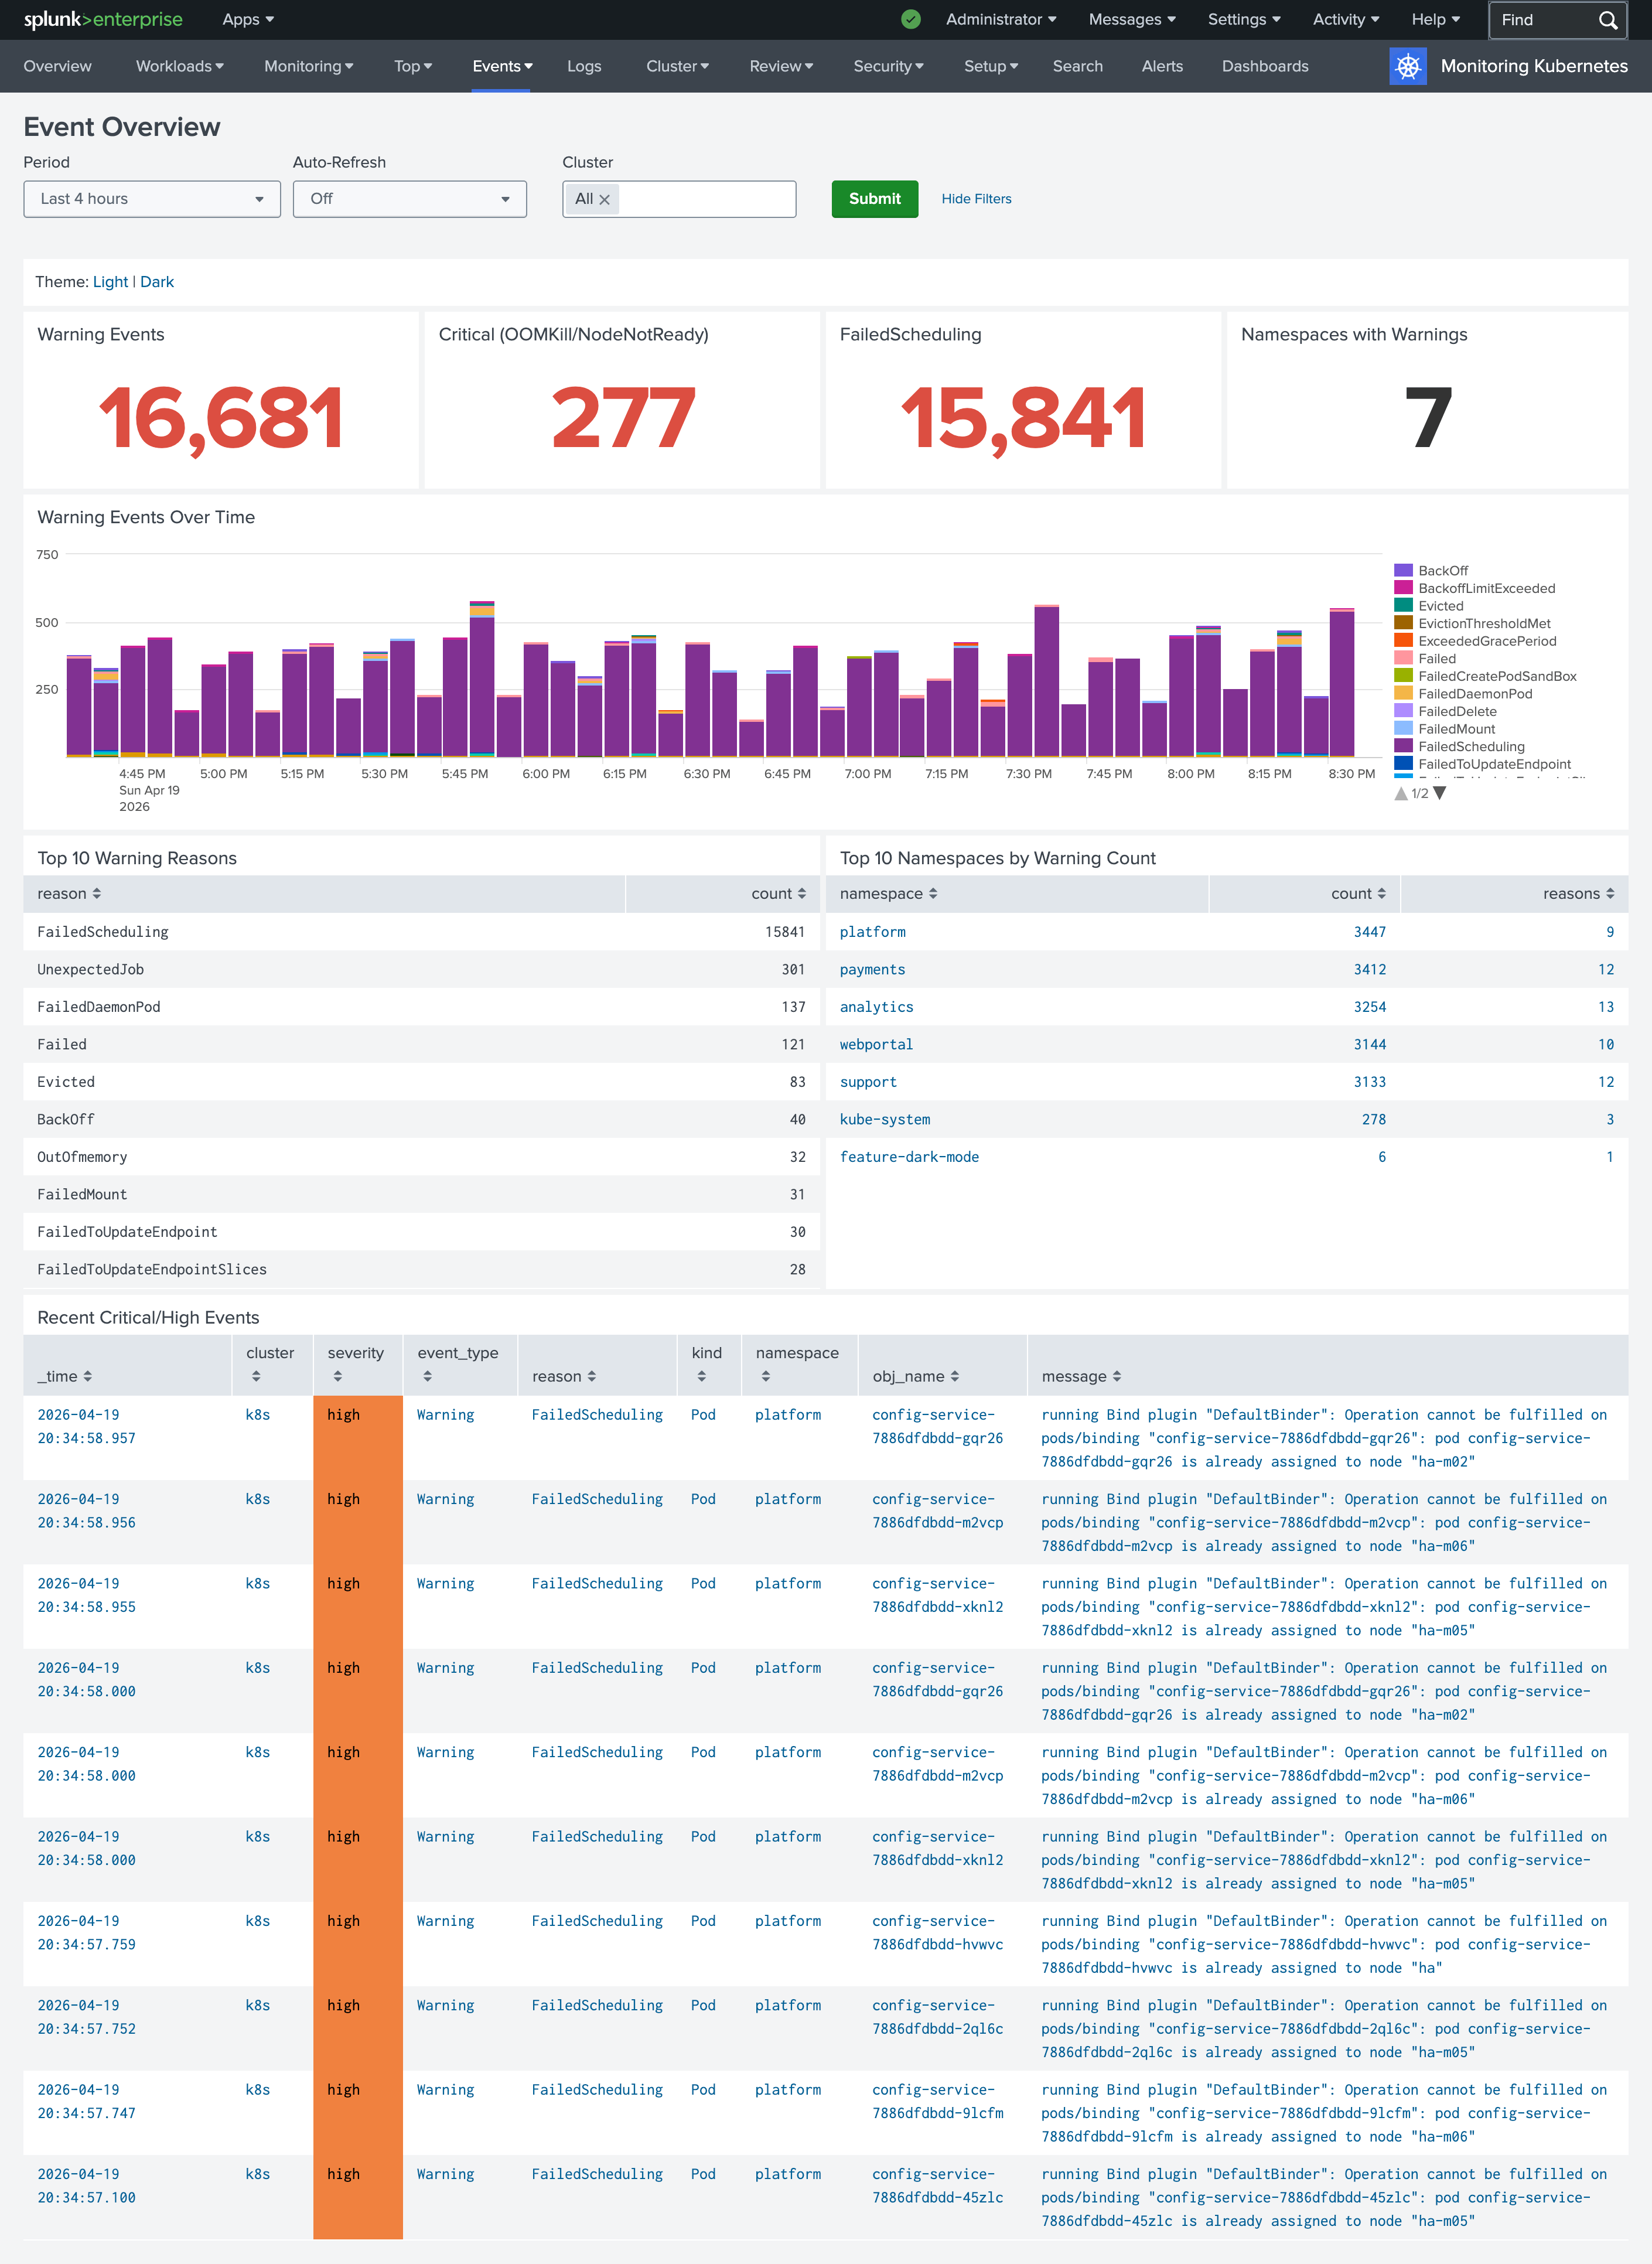
Events Overview - one of five new event-investigation dashboards in 26.04. Click any thumbnail below to see the full dashboard.
What’s in the app
The full app is organized around real operational workflows: investigating an incident, planning capacity, auditing a change, monitoring control-plane health.
Events and workload investigation
The 26.04 release brought a complete redesign of event-investigation dashboards. Five views designed around real triage workflows, replacing the legacy single Events page.
Capacity and resource usage
Answer “are we full?” and “are we wasteful?” without writing SPL.
Workloads and pods
Per-resource drill-downs - every Kubernetes workload type gets its own view, populated from real cluster data.
Cluster overview
Roll-ups across the cluster - what’s running, where, and how it’s doing.
Control plane
Visibility into the components that keep your cluster running - every Prometheus metric exposed by the control plane, parsed and graphed.
Performance - CPU, memory, disk, network
Host- and container-level performance dashboards across every cluster node.
Audit, security, and compliance
Inventory privileged workloads, trace every audit event, see who connected to what.
Outcold Solutions provides solutions for monitoring Kubernetes, OpenShift and Docker clusters in
Splunk Enterprise and Splunk Cloud. We offer certified Splunk applications, which give you insights
across all container environments. We are helping businesses reduce complexity related to logging and
monitoring by providing easy-to-use and easy-to-deploy solutions for Linux and Windows containers. We deliver
applications, which help developers monitor their applications and help operators keep their clusters
healthy. With the power of Splunk Enterprise and Splunk Cloud, we offer one solution to help you keep all
the metrics and logs in one place, allowing you to quickly address complex questions on container
performance.
We value your privacy
We use cookies to measure traffic with Google Analytics and to track ad
conversions with Google Ads. None of these are required for the site to work.
See our
Privacy Policy
for details.