
Collecting Prometheus metrics
Most of the components in OpenShift control plane export metrics in Prometheus format. The collector can read these metrics forward them to Splunk Enterprise or Splunk Cloud. Our installation has default configurations for collecting metrics from API Server, Controllers, Kubelets and etcd cluster. In most OpenShift providers you don't need to do additional configuration to see these metrics.
If your applications export metrics in Prometheus format, you can use our collector to forward these metrics as well to Splunk Enterprise or Splunk Cloud.
Forwarding metrics from Pods
Please read our documentation on annotations, to learn how you can define forwarding metrics from Pods.
Defining prometheus input
We deploy collector in 3 different workloads. Depending on where you want to collect your metrics, you should plan to include you Prometheus metrics.
-
002-daemonset.confis installed on all nodes (masters and non-masters). Use this configuration if you need to collect metrics from all nodes, from local ports. Example of these metrics is Kubelet metrics. -
003-daemonset-master.confis installed only on master nodes. Use this configuration to collect metrics only from master nodes from local ports. Examples of these metrics are control plane processes, etcd running on masters. -
004-addon.confinstalled as a deployment and used only once in the whole cluster. Place your Prometheus configuration here, if you want to collect metrics from endpoints or service. Examples of these Prometheus configurations are controller manager and scheduler, which can be accessed only from an internal network and can be discovered with endpoints. Another example is etcd cluster running outside of the OpenShift cluster.
Default configuration
Kubelet
On every node collector reads and forwards kubelet metrics. We deploy this configuration in 002-daemonset.conf.
1 2 3 4 5 6 7 8 9 10 11 12 13 14 15 16 17 18 19 20 21 22 23 24 25 26 27 28 29 30 31 32 33 34 35 36 37 38 | [input.prometheus::kubelet] # disable prometheus kubelet metrics disabled = false # override type type = prometheus # specify Splunk index index = # Override host (environment variables are supported) host = ${KUBERNETES_NODENAME} # Override source source = kubelet # how often to collect prometheus metrics interval = 60s # prometheus endpoint endpoint = https://127.0.0.1:10250/metrics # token for "Authorization: Bearer $(cat tokenPath)" tokenPath = /var/run/secrets/kubernetes.io/serviceaccount/token # server certificate for certificate validation certPath = /var/run/secrets/kubernetes.io/serviceaccount/ca.crt # client certificate for authentication clientCertPath = # Allow invalid SSL server certificate insecure = true # include metrics help with the events # can be useful to explore prometheus metrics includeHelp = false |
API Server
On master nodes collectors reads and forwards metrics from the API server. We deploy this configuration using 003-daemonset-master.conf.
1 2 3 4 5 6 7 8 9 10 11 12 13 14 15 16 17 18 19 20 21 22 23 24 25 26 27 28 29 30 31 32 33 34 35 36 37 38 39 40 | [input.prometheus::kubernetes-api] # disable prometheus kubernetes-api input disabled = false # override type type = prometheus # specify Splunk index index = # override host host = ${KUBERNETES_NODENAME} # override source source = kubernetes-api # how often to collect prometheus metrics interval = 60s # prometheus endpoint # at first trying to get it from localhost (that way avoiding load balancer, if multiple) # as fallback using proxy endpoint.1localhost = https://127.0.0.1:8443/metrics endpoint.2kubeapi = https://${KUBERNETES_SERVICE_HOST}:${KUBERNETES_SERVICE_PORT}/metrics # token for "Authorization: Bearer $(cat tokenPath)" tokenPath = /var/run/secrets/kubernetes.io/serviceaccount/token # server certificate for certificate validation certPath = /var/run/secrets/kubernetes.io/serviceaccount/ca.crt # client certificate for authentication clientCertPath = # Allow invalid SSL server certificate insecure = true # include metrics help with the events includeHelp = false |
Controller
On master nodes collectors reads and forwards metrics from the controller. We deploy this configuration using 003-daemonset-master.conf.
1 2 3 4 5 6 7 8 9 10 11 12 13 14 15 16 17 18 19 20 21 22 23 24 25 26 27 28 29 30 31 32 33 34 35 36 37 38 | [input.prometheus::controller] # disable prometheus controller metrics disabled = false # override type type = prometheus # specify Splunk index index = # override host host = ${KUBERNETES_NODENAME} # override source source = controller # how often to collect prometheus metrics interval = 60s # prometheus endpoint endpoint.https = https://127.0.0.1:8444/metrics # token for "Authorization: Bearer $(cat tokenPath)" tokenPath = /var/run/secrets/kubernetes.io/serviceaccount/token # server certificate for certificate validation certPath = # client certificate for authentication clientCertPath = clientKeyPath = # Allow invalid SSL server certificate insecure = true # include metrics help with the events includeHelp = false |
etcd
On master nodes, collectors read and forward metrics from etcd processes. We deploy this configuration using 003-daemonset-master.conf.
1 2 3 4 5 6 7 8 9 10 11 12 13 14 15 16 17 18 19 20 21 22 23 24 25 26 27 28 29 30 31 32 33 34 35 36 37 38 | [input.prometheus::etcd] # disable prometheus etcd metrics disabled = false # override type type = prometheus # specify Splunk index index = # override host host = ${KUBERNETES_NODENAME} # override source source = etcd # how often to collect prometheus metricd interval = 60s # prometheus endpoint endpoint.https = https://:2379/metrics # token for "Authorization: Bearer $(cat tokenPath)" tokenPath = # server certificate for certificate validation certPath = /rootfs/etc/origin/master/master.etcd-ca.crt # client certificate for authentication clientCertPath = /rootfs/etc/origin/master/master.etcd-client.crt clientKeyPath = /rootfs/etc/origin/master/master.etcd-client.key # Allow invalid SSL server certificate insecure = true # include metrics help with the events includeHelp = false |
This configuration works when you run etcd cluster with master nodes.
With this configuration, collector tries to collect metrics using http scheme at first,
and https after that. For https collector uses certPath,
clientCertPath and clientKeyPath, which are mounted from the host.
1 2 3 4 5 6 7 8 9 10 11 | ... volumeMounts: ... - name: origin-certs mountPath: /rootfs/etc/origin/master/ readOnly: true ... volumes: - name: origin-certs hostPath: path: /etc/origin/master/ |
Verify that these certificates are available, if not, make appropriate changes.
If your etcd cluster is a dedicated set of nodes, you can define prometheus collection in 004-addon.conf.
Metrics format
Prometheus defines several types of metrics.
Each metric value in Splunk has fields:
metric_type- one of the types from the Prometheus metric types.metric_name- the name of the metric.metric_help- only ifincludeHelpis set totrue, you will see definition of this metric.metric_label_XXX- if the metric has labels, you will be able to see them attached to the metric values.seed- unique value from the host for specific metric collection.
Based on the metric type you can find various values for the metrics.
-
counterv- current counter valued- the difference with a previous values- period for which this difference is calculated (in seconds)p- (deprecated) period for which this difference is calculated (in nanoseconds)
-
summaryandhistogramv- valuec- counter specified for thissummaryorhistogrammetric
-
All others
v- value
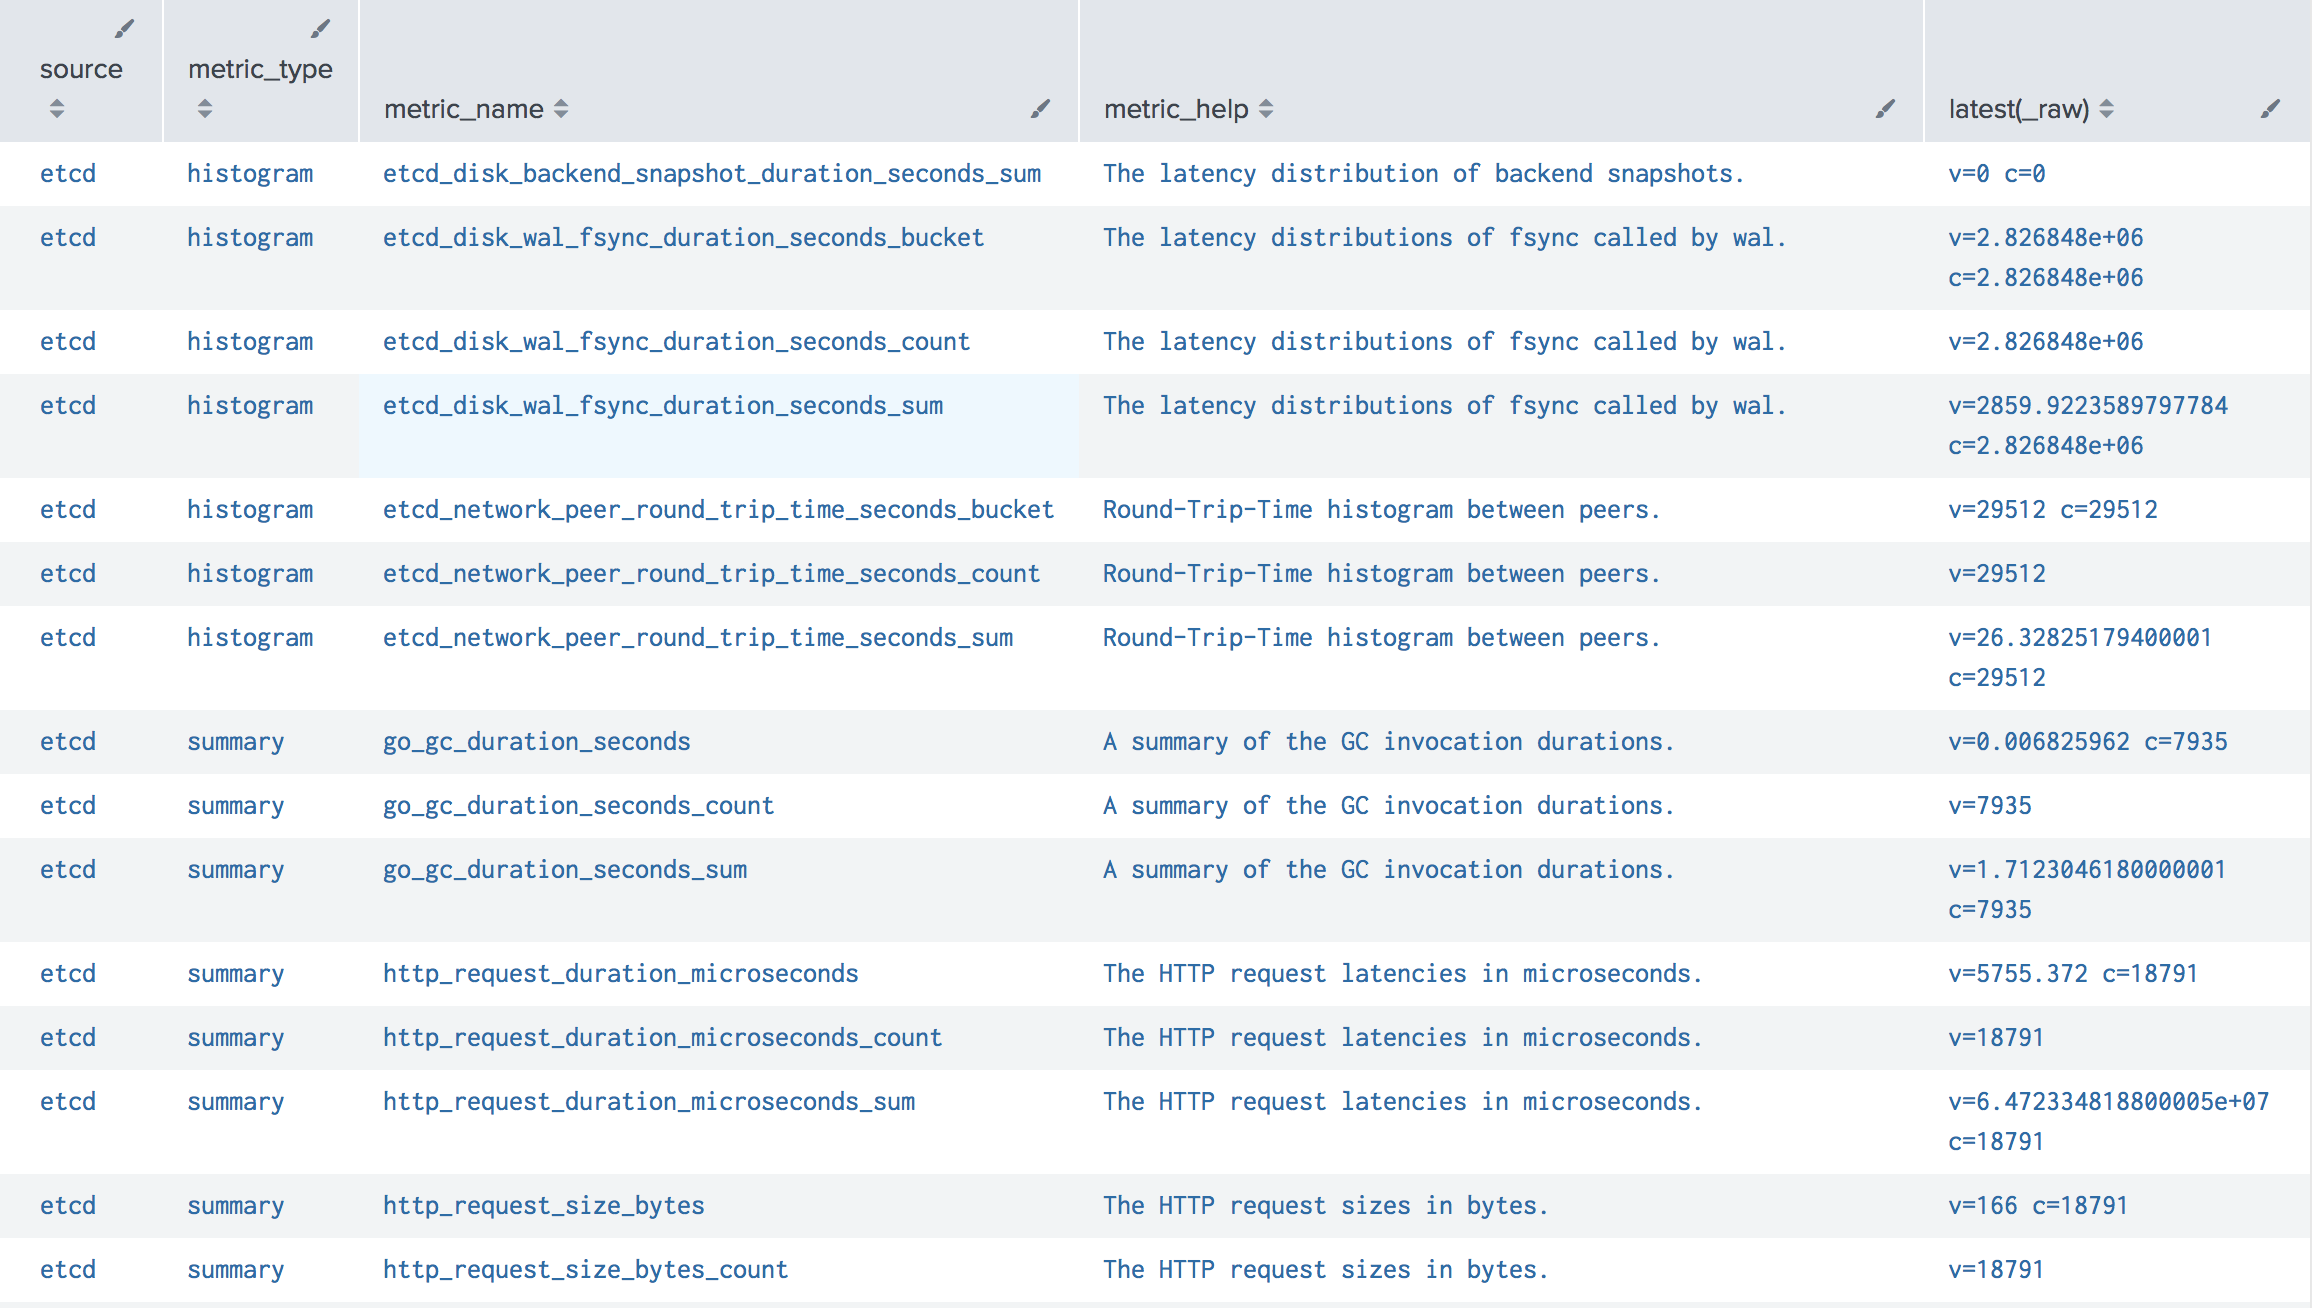
If you have specified to include help with the metrics, you can explore all available metrics with the search.
sourcetype="prometheus"
|  stats latest(_raw) by source, metric_type, metric_name, metric_help
Links
-
Installation
- Start monitoring your OpenShift environments in under 10 minutes.
- Automatically forward host, container and application logs.
- Test our solution with the embedded 30 days evaluation license.
-
Collector Configuration
- Collector configuration reference.
-
Annotations
- Changing index, source, sourcetype for namespaces, workloads and pods.
- Forwarding application logs.
- Multi-line container logs.
- Fields extraction for application and container logs (including timestamp extractions).
- Hiding sensitive data, stripping terminal escape codes and colors.
- Forwarding Prometheus metrics from Pods.
-
Audit Logs
- Configure audit logs.
- Forwarding audit logs.
-
Prometheus metrics
- Collect metrics from control plane (etcd cluster, API server, kubelet, scheduler, controller).
- Configure collector to forward metrics from the services in Prometheus format.
-
Configuring Splunk Indexes
- Using not default HTTP Event Collector index.
- Configure the Splunk application to use not searchable by default indexes.
-
Splunk fields extraction for container logs
- Configure search-time fields extractions for container logs.
- Container logs source pattern.
-
Configurations for Splunk HTTP Event Collector
- Configure multiple HTTP Event Collector endpoints for Load Balancing and Fail-overs.
- Secure HTTP Event Collector endpoint.
- Configure the Proxy for HTTP Event Collector endpoint.
-
Monitoring multiple clusters
- Learn how you can monitor multiple clusters.
- Learn how to set up ACL in Splunk.
-
Streaming OpenShift Objects from the API Server
- Learn how you can stream all changes from the OpenShift API Server.
- Stream changes and objects from OpenShift API Server, including Pods, Deployments or ConfigMaps.
-
License Server
- Learn how you can configure remote License URL for Collectord.
- Monitoring GPU
- Alerts
- Troubleshooting
- Release History
- Upgrade instructions
- Security
- FAQ and the common questions
- License agreement
- Pricing
- Contact


