Most OpenShift control plane components expose metrics in Prometheus format, and Collectord can scrape them and forward the values to Splunk Enterprise or Splunk Cloud. Out of the box, Collectord ships with default configurations for the API Server, controllers, kubelets, and etcd - on most OpenShift distributions, you don’t need to change anything to start seeing these metrics.
The same machinery works for your own workloads: any application that exposes a Prometheus endpoint can be scraped and forwarded the same way.
Forwarding metrics from Pods
To scrape metrics from your own pods, you don’t edit the Collectord ConfigMap - you annotate the pod. See annotations for the full set of collectord.io/prometheus.* annotations.
Defining prometheus input
Collectord runs in three workloads, and where you put a Prometheus input determines which pods will run the scrape. Pick the file that matches the topology of the endpoint you want to collect from:
002-daemonset.confruns on every node - masters and workers. Use it for metrics exposed on a local port on every node, like kubelet.003-daemonset-master.confruns only on master nodes. Use it for control plane processes that bind to localhost on the masters, including etcd colocated with masters.004-addon.confis a single Deployment, scheduled once per cluster. Use it when you need to discover endpoints or services from inside the cluster network - like a controller manager or scheduler that only listens on the pod network, or an etcd cluster running outside OpenShift.
Default configuration
Kubelet
Every node runs a kubelet, so the input lives in 002-daemonset.conf and runs cluster-wide.
 1[input.prometheus::kubelet]
 2
 3# disable prometheus kubelet metrics
 4disabled = false
 5
 6# override type
 7type = prometheus
 8
 9# specify Splunk index
10index =
11
12# Override host (environment variables are supported)
13host = ${KUBERNETES_NODENAME}
14
15# Override source
16source = kubelet
17
18# how often to collect prometheus metrics
19interval = 60s
20
21# prometheus endpoint
22endpoint = https://127.0.0.1:10250/metrics
23
24# token for "Authorization: Bearer $(cat tokenPath)"
25tokenPath = /var/run/secrets/kubernetes.io/serviceaccount/token
26
27# server certificate for certificate validation
28certPath = /var/run/secrets/kubernetes.io/serviceaccount/ca.crt
29
30# client certificate for authentication
31clientCertPath =
32
33# Allow invalid SSL server certificate
34insecure = true
35
36# include metrics help with the events
37# can be useful to explore prometheus metrics
38includeHelp = false
API Server
The API server input runs on master nodes via 003-daemonset-master.conf. It hits localhost first to avoid the load balancer, and falls back to the in-cluster service if localhost isn’t reachable.
 1[input.prometheus::kubernetes-api]
 2
 3# disable prometheus kubernetes-api input
 4disabled = false
 5
 6# override type
 7type = prometheus
 8
 9# specify Splunk index
10index =
11
12# override host
13host = ${KUBERNETES_NODENAME}
14
15# override source
16source = kubernetes-api
17
18# how often to collect prometheus metrics
19interval = 60s
20
21# prometheus endpoint
22# at first trying to get it from localhost (that way avoiding load balancer, if multiple)
23# as fallback using proxy
24endpoint.1localhost = https://127.0.0.1:8443/metrics
25endpoint.2kubeapi = https://${KUBERNETES_SERVICE_HOST}:${KUBERNETES_SERVICE_PORT}/metrics
26
27# token for "Authorization: Bearer $(cat tokenPath)"
28tokenPath = /var/run/secrets/kubernetes.io/serviceaccount/token
29
30# server certificate for certificate validation
31certPath = /var/run/secrets/kubernetes.io/serviceaccount/ca.crt
32
33# client certificate for authentication
34clientCertPath =
35
36# Allow invalid SSL server certificate
37insecure = true
38
39# include metrics help with the events
40includeHelp = false
Controller
The controller binds to 127.0.0.1:8444 on each master, so its input also lives in 003-daemonset-master.conf.
 1[input.prometheus::controller]
 2
 3# disable prometheus controller metrics
 4disabled = false
 5
 6# override type
 7type = prometheus
 8
 9# specify Splunk index
10index =
11
12# override host
13host = ${KUBERNETES_NODENAME}
14
15# override source
16source = controller
17
18# how often to collect prometheus metrics
19interval = 60s
20
21# prometheus endpoint
22endpoint.https = https://127.0.0.1:8444/metrics
23
24# token for "Authorization: Bearer $(cat tokenPath)"
25tokenPath = /var/run/secrets/kubernetes.io/serviceaccount/token
26
27# server certificate for certificate validation
28certPath =
29
30# client certificate for authentication
31clientCertPath =
32clientKeyPath =
33
34# Allow invalid SSL server certificate
35insecure = true
36
37# include metrics help with the events
38includeHelp = false
If your distribution binds the controller-manager only to the pod network - or if you’d rather scrape it through a Service for any other reason - see Endpoint discovery below.
etcd
When etcd runs colocated with masters - the typical OpenShift layout - Collectord scrapes it from 003-daemonset-master.conf using the etcd client certificates mounted from the host.
 1[input.prometheus::etcd]
 2
 3# disable prometheus etcd metrics
 4disabled = false
 5
 6# override type
 7type = prometheus
 8
 9# specify Splunk index
10index =
11
12# override host
13host = ${KUBERNETES_NODENAME}
14
15# override source
16source = etcd
17
18# how often to collect prometheus metricd
19interval = 60s
20
21# prometheus endpoint
22endpoint.https = https://:2379/metrics
23
24# token for "Authorization: Bearer $(cat tokenPath)"
25tokenPath =
26
27# server certificate for certificate validation
28certPath = /rootfs/etc/origin/master/master.etcd-ca.crt
29
30# client certificate for authentication
31clientCertPath = /rootfs/etc/origin/master/master.etcd-client.crt
32clientKeyPath = /rootfs/etc/origin/master/master.etcd-client.key
33
34# Allow invalid SSL server certificate
35insecure = true
36
37# include metrics help with the events
38includeHelp = false
The input tries http first and falls back to https. For the https endpoint, Collectord uses certPath, clientCertPath, and clientKeyPath - all resolved through this host mount in the daemonset:
 1...
 2  volumeMounts:
 3  ...
 4  - name: origin-certs
 5    mountPath: /rootfs/etc/origin/master/
 6    readOnly: true
 7...
 8volumes:
 9- name: origin-certs
10  hostPath:
11    path: /etc/origin/master/
Verify those certificates actually exist at that path on your masters; if they don’t, point the input at whatever path holds your etcd client certs.
If your etcd cluster runs on a dedicated set of nodes outside the masters, define the input in 004-addon.conf instead - the addon Deployment can reach external endpoints from the pod network.
Endpoint discovery
When a control plane process only listens on the pod network - common when OpenShift’s standard layout fronts the controller-manager or scheduler with a Service instead of binding them to localhost - the inputs in 003-daemonset-master.conf can’t reach them. Move the input to 004-addon.conf instead and let Collectord discover scrape targets through a Kubernetes Service.
26.04.2Discovery uses three discrete config keys. Pick exactly one of endpointSlice, service, or endpoint, then describe the scrape with port (or portName), scheme, and path:
endpointSlice = <name>.<namespace>- per-pod fan-out viadiscovery.k8s.io/v1.EndpointSlice. Collectord queries the slices labelledkubernetes.io/service-name=<name>, filters for ready (non-terminating) IPv4/IPv6 addresses, and starts one scrape pipeline per address. Each pipeline’s eventhostis the discovered endpoint address. Omit.<namespace>to aggregate slices across all namespaces.service = <name>.<namespace>- hits the Service’s ClusterIP once per interval and lets kube-proxy load-balance to one backing pod at a time. Every scrape carries the ClusterIP ashost.endpoint = <url>- literal URL with no Kubernetes discovery. Multipleendpoint.Nvalues fall back in order until one responds.
Set only one discovery key per input stanza. If you set more than one, Collectord picks endpointSlice > service > endpoint and logs a warning naming the ignored keys.
Breaking change in 26.04.2: The legacy
endpoint = endpoint-http://<svc>:<port>/path(andendpoint-https://,service-http://,service-https://) syntax has been removed. The old resolver built an invalid kube-apiserver URL and silently returned no targets - if you copy-pasted that pattern from an earlier doc revision, no scrapes were actually happening. Switch to the new keys below. RBAC also changed - re-apply the manifest to grantdiscovery.k8s.io/endpointslices.
Discovering the controller
Disable the localhost-bound [input.prometheus::controller] in 003-daemonset-master.conf (set disabled = true) and add the matching stanza to 004-addon.conf:
 1[input.prometheus::controller]
 2disabled = false
 3type = prometheus
 4index =
 5# left empty - host is filled in from each discovered endpoint address
 6host =
 7source = controller
 8interval = 60s
 9
10# Per-pod fan-out via discovery.k8s.io/v1.EndpointSlice. Format is
11# <service-name>.<namespace>; omit the namespace to aggregate cluster-wide.
12endpointSlice = kube-controller-manager.openshift-kube-controller-manager
13# scrape port - match by number (port) or by EndpointSlice port name (portName)
14port = 10257
15scheme = https
16path = /metrics
17
18tokenPath = /var/run/secrets/kubernetes.io/serviceaccount/token
19insecure = true
20includeHelp = false
OpenShift’s standard layout fronts the controller-manager with kube-controller-manager.openshift-kube-controller-manager on port 10257, and the scheduler with scheduler.openshift-kube-scheduler on port 10259. Adjust the Service name, namespace, and port to whatever your distribution actually exposes - oc get service -A | grep -E 'controller-manager|scheduler' is the fastest way to confirm.
If you’d rather hit the Service’s ClusterIP once per interval and let kube-proxy load-balance to one backing pod at a time, swap endpointSlice = for service = <name>.<namespace>.
Metrics format (Splunk Index Type = Events)
Prometheus defines several types of metrics, and Collectord preserves the type information so you can search and aggregate accordingly.
Every metric event in Splunk carries:
metric_type- one of the Prometheus metric types.metric_name- the name of the metric.metric_help- the metric’s definition, included only whenincludeHelp = true.metric_label_XXX- one field per Prometheus label on the metric.seed- a unique value per host and metric collection.
The numeric fields depend on the type:
counterv- current counter valued- the difference with a previous values- period for which this difference is calculated (in seconds)p- (deprecated) period for which this difference is calculated (in nanoseconds)
summaryandhistogramv- valuec- counter specified for thissummaryorhistogrammetric
All others
v- value
If you’ve enabled includeHelp, this search lists every metric Collectord is forwarding along with its description - handy for figuring out what’s available before building a dashboard:
1sourcetype="prometheus"
2|  stats latest(_raw) by source, metric_type, metric_name, metric_help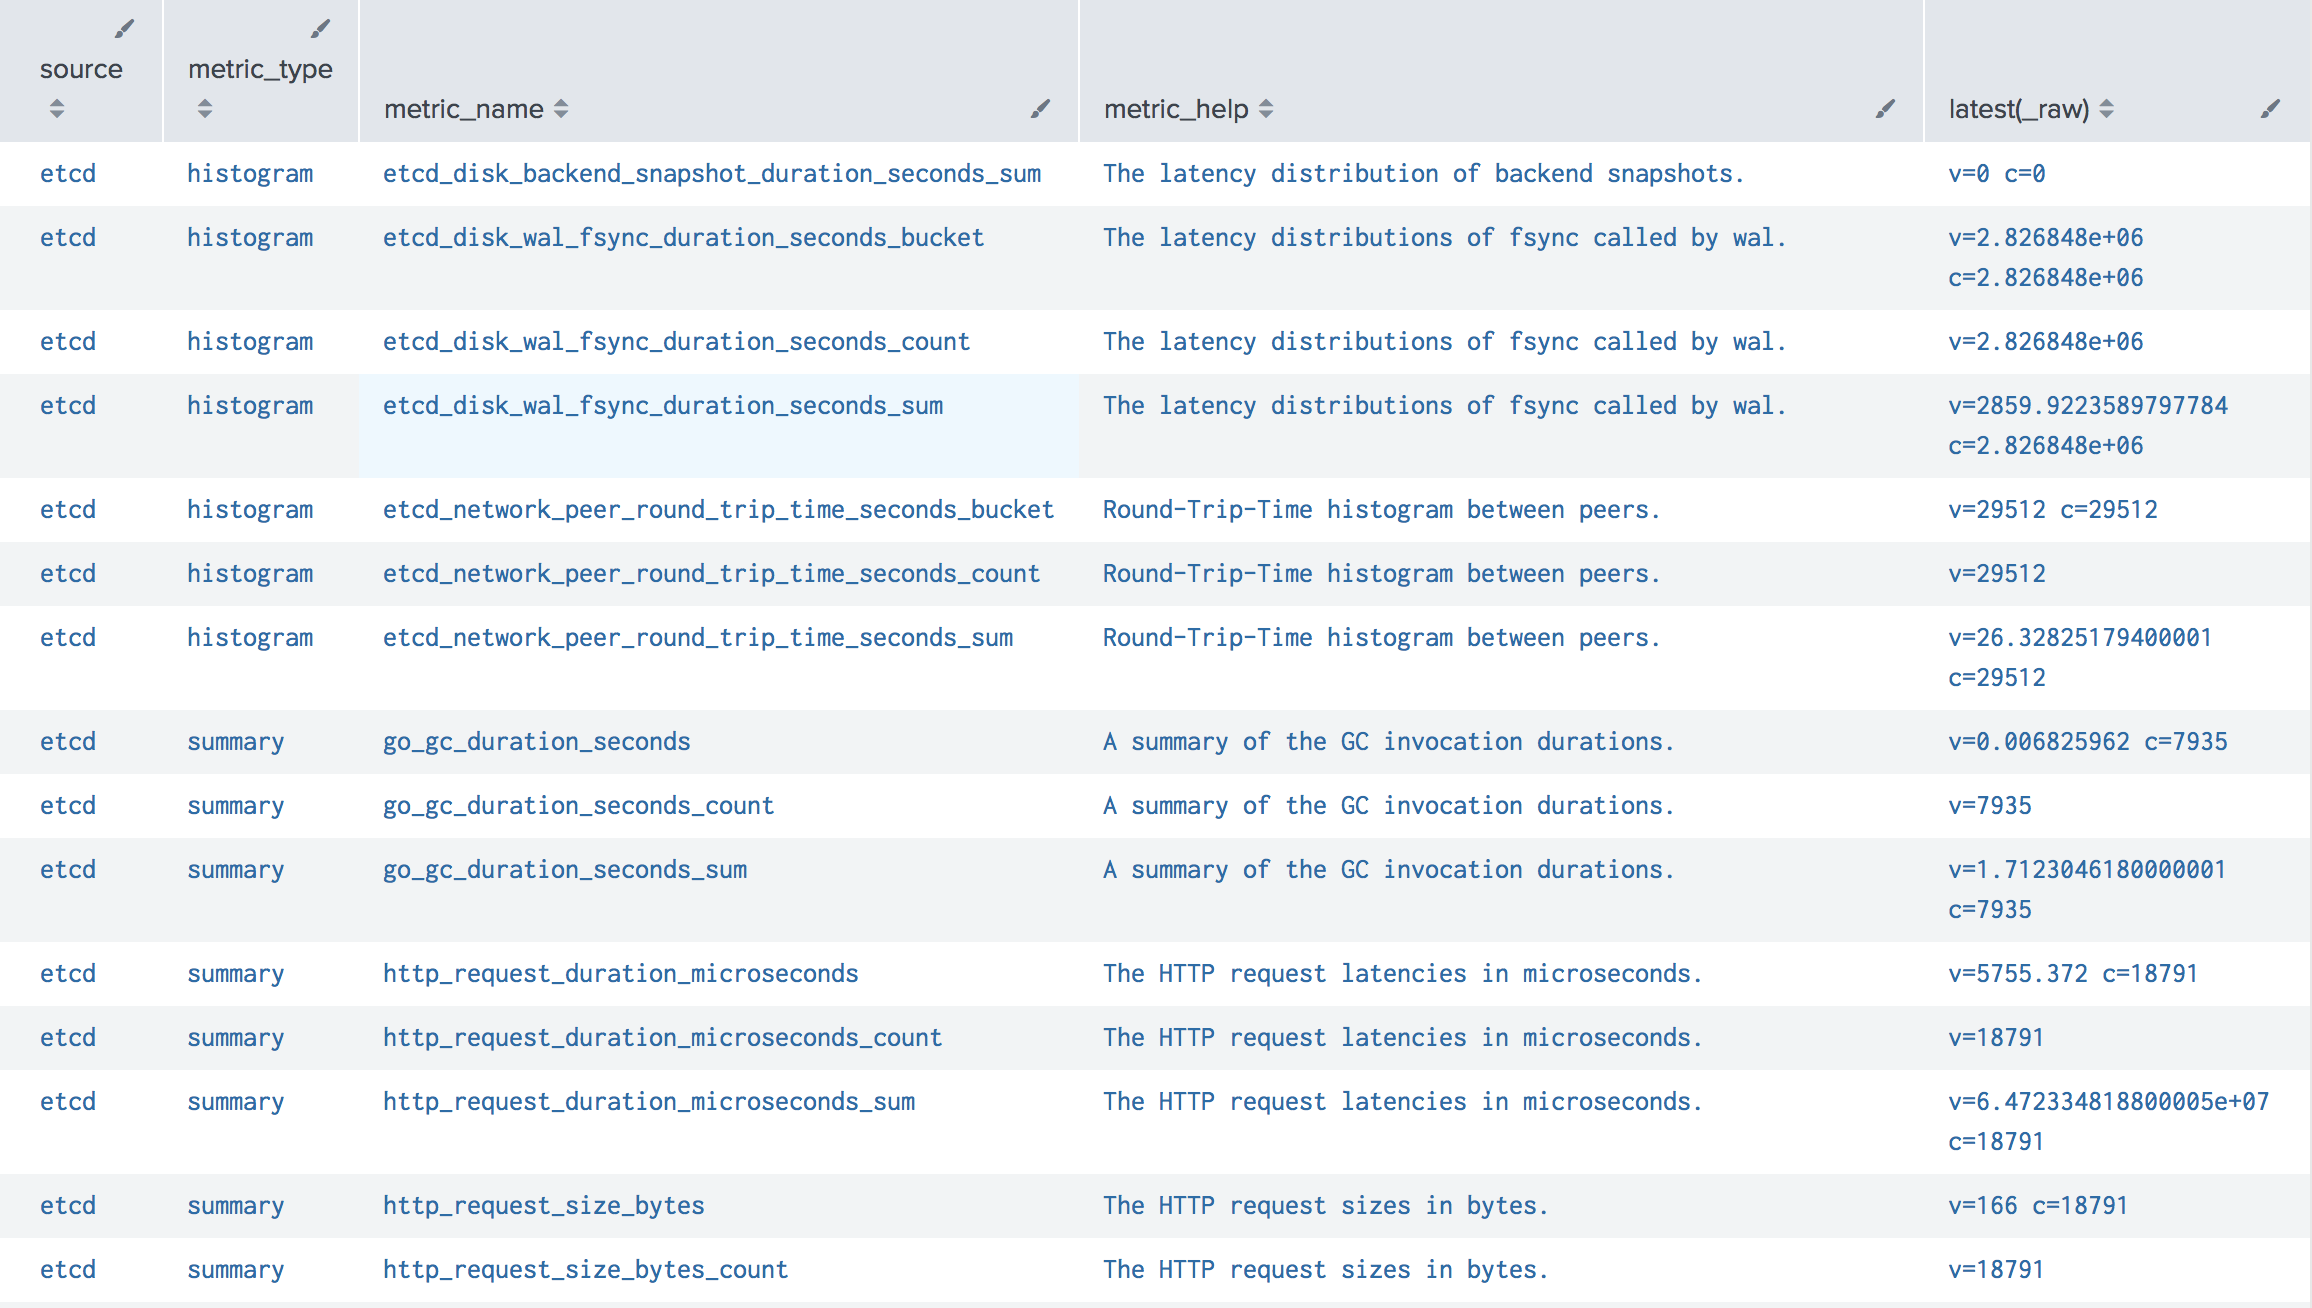
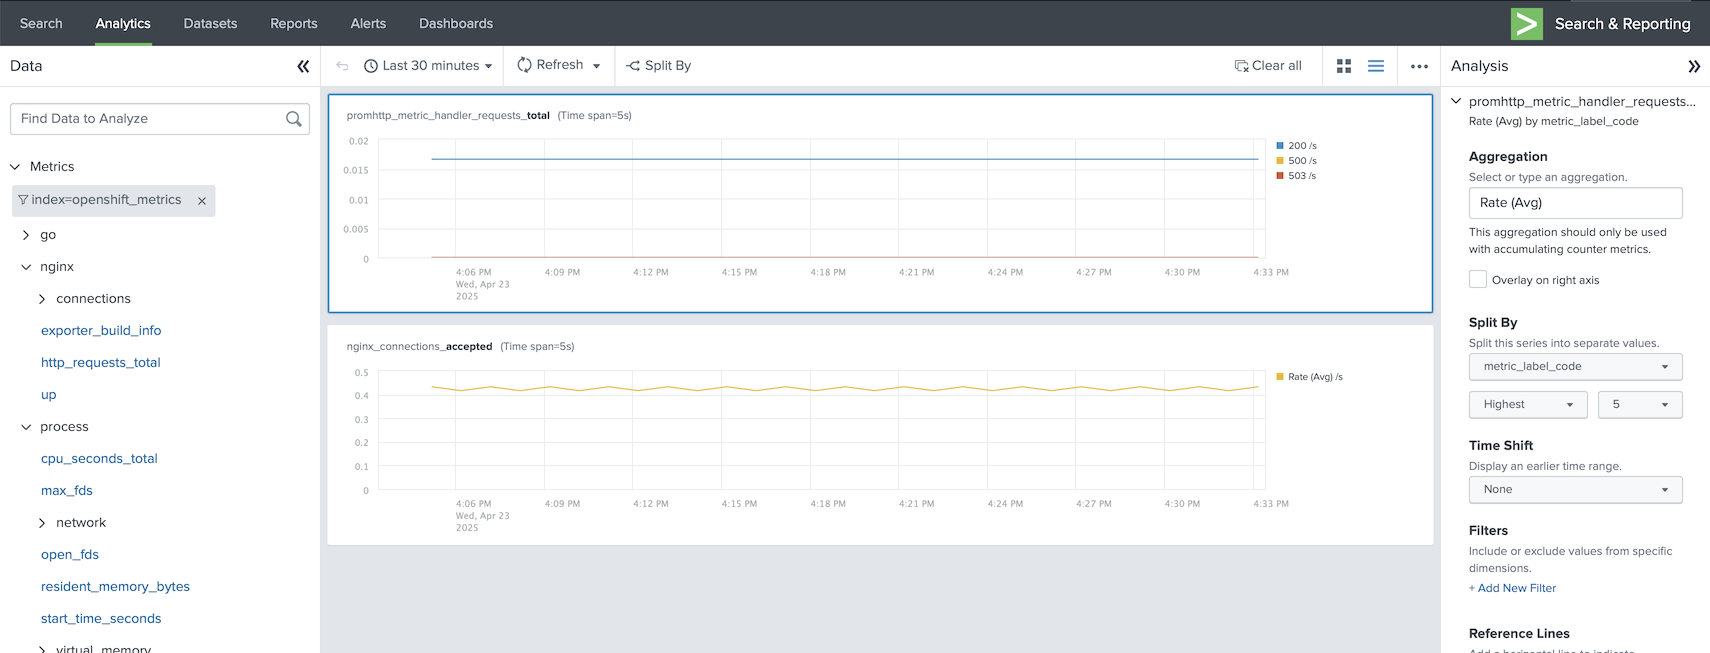
Metrics format (Splunk Index Type = Metrics)
Starting with Collectord 5.24, you can route Prometheus metrics into a Splunk metrics index instead of an events index. Set indexType = metrics on the [input.prometheus::X] stanza in the ConfigMap, or annotate the pod with collectord.io/prometheus.1-indexType=metrics.
In metrics-index mode, the metric values are sent as native metric values and Prometheus labels are attached as metric_label_XXX fields, which means you can explore them directly with the Splunk Analytics dashboard.
When you switch to a metrics index, we recommend defining a separate Splunk Output bound to a HEC token whose default index - and allowed indexes - are metrics indexes. That keeps event and metric traffic on independent tokens and avoids token-level routing surprises.