Out of the box, collectorforkubernetes writes everything to the default index of your HTTP Event Collector token. Each token has an allow-list of indexes it can write to, and one of those is treated as the default when the sender doesn’t pick one. The Monitoring Kubernetes app, in turn, assumes those indexes are searchable by default for your Splunk role - main is the obvious example.
If you forward to an index that isn’t searchable by default for your role, the dashboards will come up empty even though the data is being indexed.
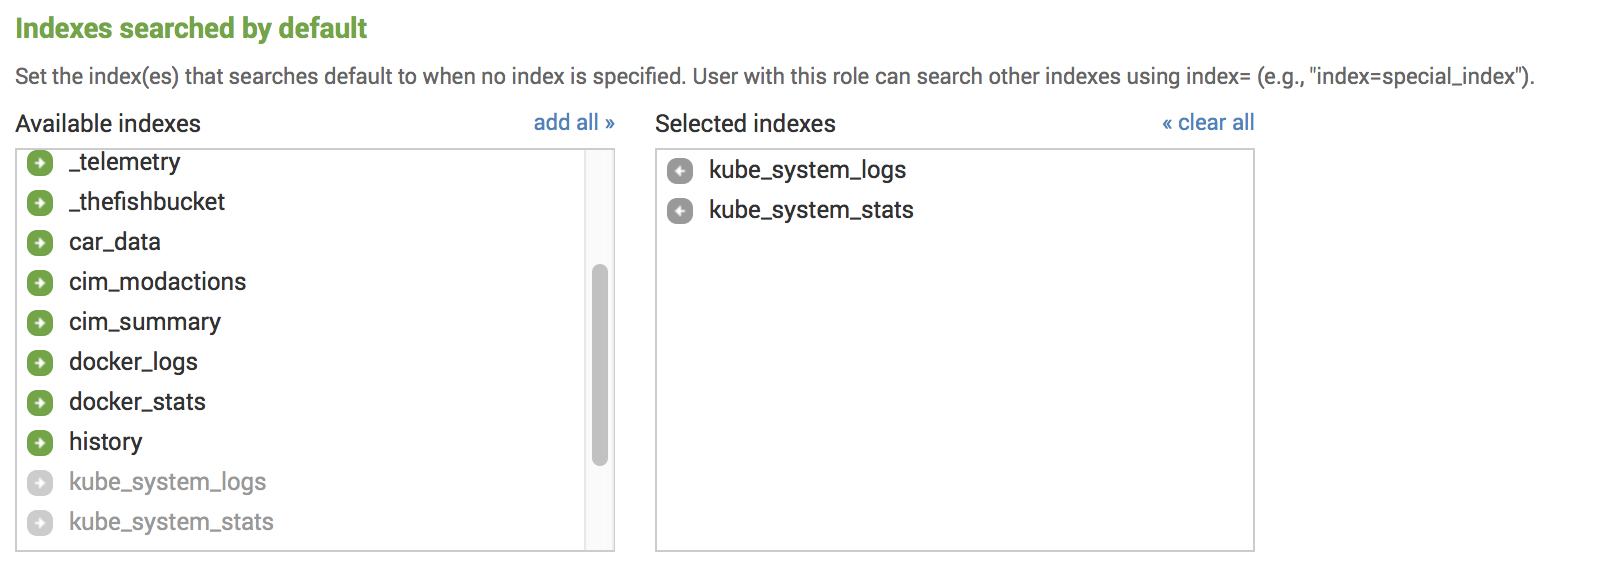
You have two ways to fix that. The first is to add the index to Indexes searched by default for your role under Settings - Access Control - Roles:
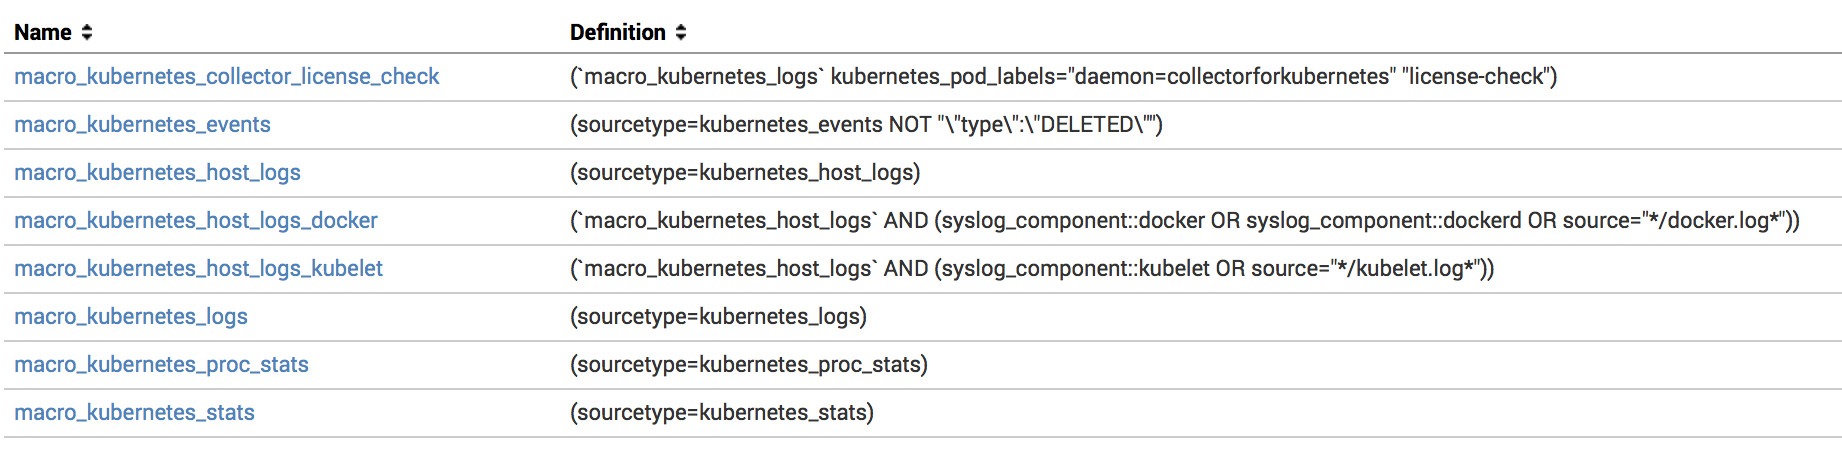
The second is to update the search macros the app uses, so the dashboards search your indexes explicitly. You’ll find them in the Splunk Web UI under Settings - Advanced search - Search macros, or you can override $SPLUNK_HOME/etc/apps/monitoringkubernetes/default/macros.conf with a local/macros.conf:
Since version 5.10, every other macro inherits from a single base macro macro_kubernetes_base - so you typically only need to set the index list once:
1macro_kubernetes_base = (index=kubernetes_stats OR index=kubernetes_logs)If you want finer-grained control - for example, pinning a specific datatype to a specific index and sourcetype - override the individual macro instead:
1macro_kubernetes_stats = (index=kube_system_stats sourcetype=kubernetes_stats)The macros worth knowing about:
macro_kubernetes_events- all the kubernetes events.macro_kubernetes_host_logs- host logs.macro_kubernetes_logs- container logs.macro_kubernetes_proc_stats- proc metrics.macro_kubernetes_net_stats- network metrics.macro_kubernetes_net_socket_table- network socket tables.macro_kubernetes_stats- system and container metrics.macro_kubernetes_mount_stats- container runtime storage usage metrics.macro_kubernetes_prometheus_metrics- metrics from prometheus format
Using dedicated indexes for different types of data
For most clusters, it’s worth splitting logs from metrics - they have different access patterns, different volumes, and different retention needs. A common layout is kube_system_logs for events, container logs, and host logs; kube_system_stats for proc and system metrics; and kube_prometheus for Prometheus metrics. You can go further and pin every datatype Collectord forwards to its own index if you want.
The big practical win: dedicated indexes let you set different retention policies for logs and metrics independently.
To wire it up on the Collectord side, set the index value under each input in the Configuration Reference:
 1data:
 2  collector.conf: |
 3    ...
 4
 5    [input.system_stats]
 6
 7    ...
 8
 9    # specify Splunk index
10    index =
11
12    ...
13
14    [input.proc_stats]
15
16    ...
17
18    # specify Splunk index
19    index =
20
21    ...
22
23    [input.net_stats]
24
25    ...
26
27    # specify Splunk index
28    index =
29
30    ...
31
32    [input.net_socket_table]
33
34    ...
35
36    # specify Splunk index
37    index =
38
39    ...
40
41    [input.mount_stats]
42
43    ...
44
45    # specify Splunk index
46    index =
47
48    ...
49
50    [input.files]
51
52    ...
53
54    # specify Splunk index
55    index =
56
57    ...
58
59    [input.files::syslog]
60
61    ...
62
63    # specify Splunk index
64    index =
65
66    ...
67
68    [input.files::logs]
69
70    ...
71
72    # specify Splunk index
73    index =
74
75    ...
76
77    [input.kubernetes_events]
78
79    ...
80
81    # specify Splunk index
82    index =
83
84    ...
Configuring dedicated indexes, source and sourcetype for Namespaces
You can also override the destination index - and source/sourcetype - per namespace, workload, or pod through annotations Collectord watches for. For example, to send every container log, metric, and event from the namespace1 namespace to the kubernetes_namespace1 index:
1kubectl annotate namespaces namespace1 \
2  collectord.io/index=kubernetes_namespace1
For the full set of routing and override annotations, see Annotations.