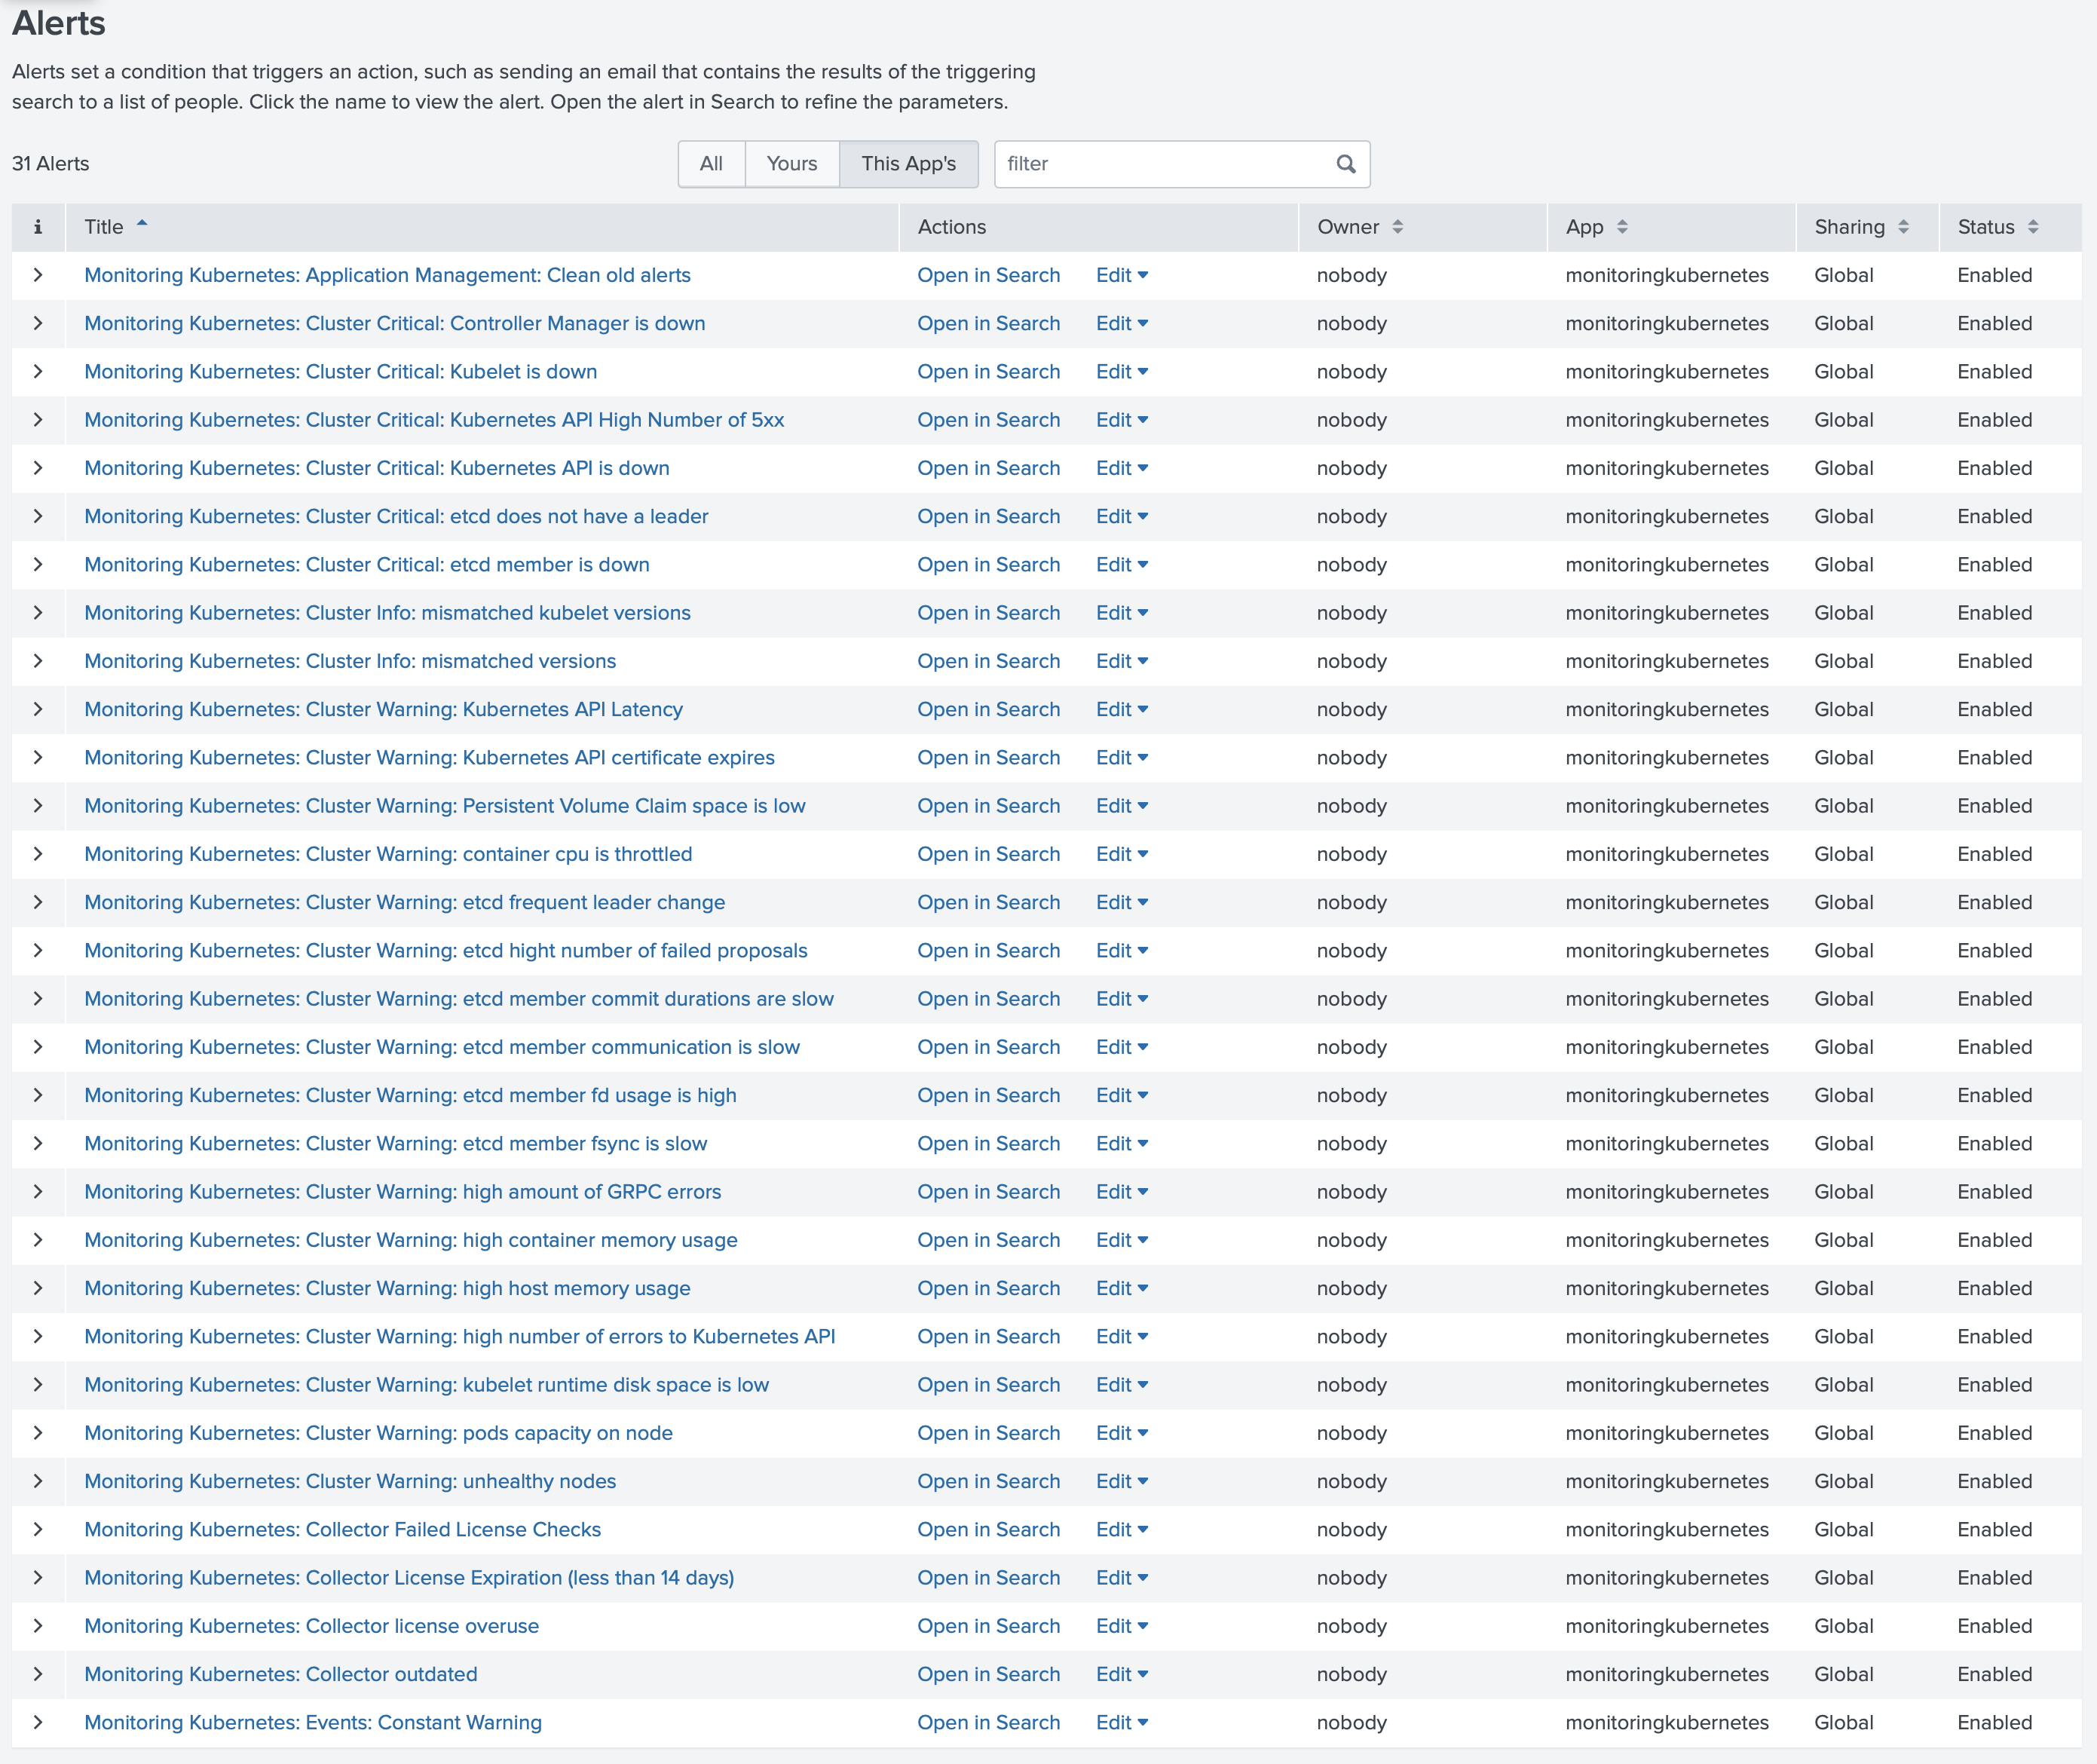
Predefined alerts
Available since Collectord version5.2The Monitoring Kubernetes app ships with a curated set of alerts that cover cluster health, control-plane availability, node and container resource pressure, and the health of Collectord itself. Enable the ones that match your environment - they’re disabled by default so you can opt in deliberately.
Monitoring Kubernetes: Collector License Expiration (less than 14 days)
One or more Collectord instances are running with a license that expires in fewer than 14 days. Renew before it lapses to keep forwarding uninterrupted.
Monitoring Kubernetes: Collector Failed License Checks
A Collectord instance has repeatedly failed to reach the licensing server. Usually a network or DNS issue between the cluster and the license endpoint.
Monitoring Kubernetes: Collector outdated
One or more Collectord instances are running an older build than the Splunk app expects. Upgrade them so dashboards and alerts line up with the schema the app ships.
Monitoring Kubernetes: Collector license overuse
The number of running Collectord instances exceeds what your license allows. Contact sales@outcoldsolutions.com to extend the license.
Monitoring Kubernetes: Cluster Critical: Kubernetes API is down
Collectord has stopped receiving metrics from one of the Kubernetes API Servers - likely a control-plane outage or a missing master node.
Monitoring Kubernetes: Cluster Critical: Controller Manager is down
Collectord has stopped receiving metrics from one of the Controller Managers. Check the master nodes - a Controller Manager is likely missing or crash-looping.
Monitoring Kubernetes: Cluster Critical: Kubelet is down
Collectord has stopped receiving metrics from one of the Kubelets. Usually means a node is unreachable or has dropped out of the cluster.
Monitoring Kubernetes: Cluster Critical: etcd member is down
Collectord has stopped receiving metrics from one of the etcd members. An etcd member is likely missing - investigate before quorum is at risk.
Monitoring Kubernetes: Events: Constant Warning
The same warning event has fired more than 3 times in the cluster - a recurring problem worth investigating instead of a one-off blip.
Monitoring Kubernetes: Cluster Info: mismatched versions
The server components are running mismatched build versions. Common during a partial upgrade - finish rolling out the new version across the control plane.
Monitoring Kubernetes: Cluster Info: mismatched kubelet versions
Kubelets are running mismatched build versions across nodes. Usually a sign of an in-progress or stalled node upgrade.
Monitoring Kubernetes: Cluster Warning: high number of errors to Kubernetes API
A Kubelet is seeing more than 1% errors when talking to the API Server - typically a control-plane load, network, or auth problem.
Monitoring Kubernetes: Cluster Warning: pods capacity on node
A node is above 90% of its pod capacity. Schedule pressure is imminent - drain, scale, or raise the limit.
Monitoring Kubernetes: Cluster Warning: Kubernetes API Latency
The API Server’s 99th percentile latency is above 1 second. Clients will start timing out - check etcd, control-plane CPU, and recent workload spikes.
Monitoring Kubernetes: Cluster Critical: Kubernetes API High Number of 5xx
The API Server is returning more than 5% 5xx responses. The control plane is unhealthy and likely affecting every controller and client in the cluster.
Monitoring Kubernetes: Cluster Warning: Kubernetes API certificate expires
The Kubernetes API certificate expires in less than 7 days. Rotate it now - an expired API cert breaks the entire cluster.
Monitoring Kubernetes: Cluster Critical: etcd does not have a leader
The etcd cluster has no leader. Writes are blocked across Kubernetes until quorum is restored.
Monitoring Kubernetes: Cluster Warning: etcd frequent leader change
etcd has changed leader more than 3 times in the last hour - a sign of network instability, slow disks, or member overload.
Monitoring Kubernetes: Cluster Warning: high amount of GRPC errors
The etcd cluster is reporting a high rate of gRPC errors. Look at network connectivity between members and at any client overloading the cluster.
Monitoring Kubernetes: Cluster Warning: etcd member communication is slow
Communication between etcd members is slow. Typically a network latency or saturation issue between control-plane nodes.
Monitoring Kubernetes: Cluster Warning: etcd high number of failed proposals
etcd is seeing a high number of failed proposals - a symptom of leader instability or members falling behind.
Monitoring Kubernetes: Cluster Warning: etcd member fsync is slow
etcd fsync is slow. Disk latency on the control-plane volume is the usual culprit, and it directly translates to write latency for the whole cluster.
Monitoring Kubernetes: Cluster Warning: etcd member commit durations are slow
etcd commit durations are slow. Like slow fsync, this points at the underlying storage and will degrade every Kubernetes write.
Monitoring Kubernetes: Cluster Warning: etcd member fd usage is high
An etcd member is using more than 80% of its max file descriptors. Raise the FD limit before it runs out and the member drops.
Monitoring Kubernetes: Cluster Warning: unhealthy nodes
The Controller Manager is reporting one or more unhealthy nodes. Check node conditions - NotReady, MemoryPressure, DiskPressure, or PIDPressure.
Monitoring Kubernetes: Cluster Warning: kubelet runtime disk space is low
A node has less than 20% free space on the kubelet runtime volume. Image pulls and writeable layers will start failing soon - clean up or resize.
Monitoring Kubernetes: Cluster Warning: Persistent Volume Claim space is low
A Persistent Volume Claim has less than 20% free space. Resize or clean it up before the workload using it starts failing writes.
Monitoring Kubernetes: Cluster Warning: high host memory usage
A node is above 85% memory usage. The OOM killer is one workload spike away - investigate before it lands on something critical.
Monitoring Kubernetes: Cluster Warning: high host CPU usage
A node has averaged more than 90% CPU over the last 5 minutes. Workloads on it are almost certainly being throttled or starved.
Monitoring Kubernetes: Cluster Warning: high container memory usage
A container is using more than 85% of its memory limit. It’s tracking toward an OOM kill - raise the limit or fix the leak.
Monitoring Kubernetes: Cluster Warning: container cpu is throttled
A container is being throttled on more than 20% of its CPU. Either raise its CPU limit or right-size the workload.
Monitoring Kubernetes: Warning: collectord reports errors in one or more pipelines
Collectord is reporting errors in one or more of its forwarding pipelines. Data loss is possible - check the pipeline that’s failing.
Monitoring Kubernetes: Warning: collectord has WARN or ERROR logs
Collectord is logging WARN or ERROR messages. Worth scanning even when nothing else has tripped - these often surface a problem before it becomes one.
Monitoring Kubernetes: Warning: Increasing lag between event time and indexing time in container logs
The lag between when a log line is written and when it’s indexed in Splunk is growing. Collectord, the network, or HEC ingestion is falling behind.
Monitoring Kubernetes: Warning: Node reservation of memory is above 90 percent
More than 90% of a node’s memory is reserved by pod requests. New pods that need memory won’t schedule there - add capacity or rebalance.
Monitoring Kubernetes: Warning: Node reservation of cpu is above 90 percent
More than 90% of a node’s CPU is reserved by pod requests. Scheduling headroom is gone - add capacity or rebalance.
Monitoring Kubernetes: Collectord diagnostics
Watches Collectord logs and fires when one or more diagnostics:: ALARMs are ON. Use this as a catch-all for the self-diagnostic checks Collectord runs internally.
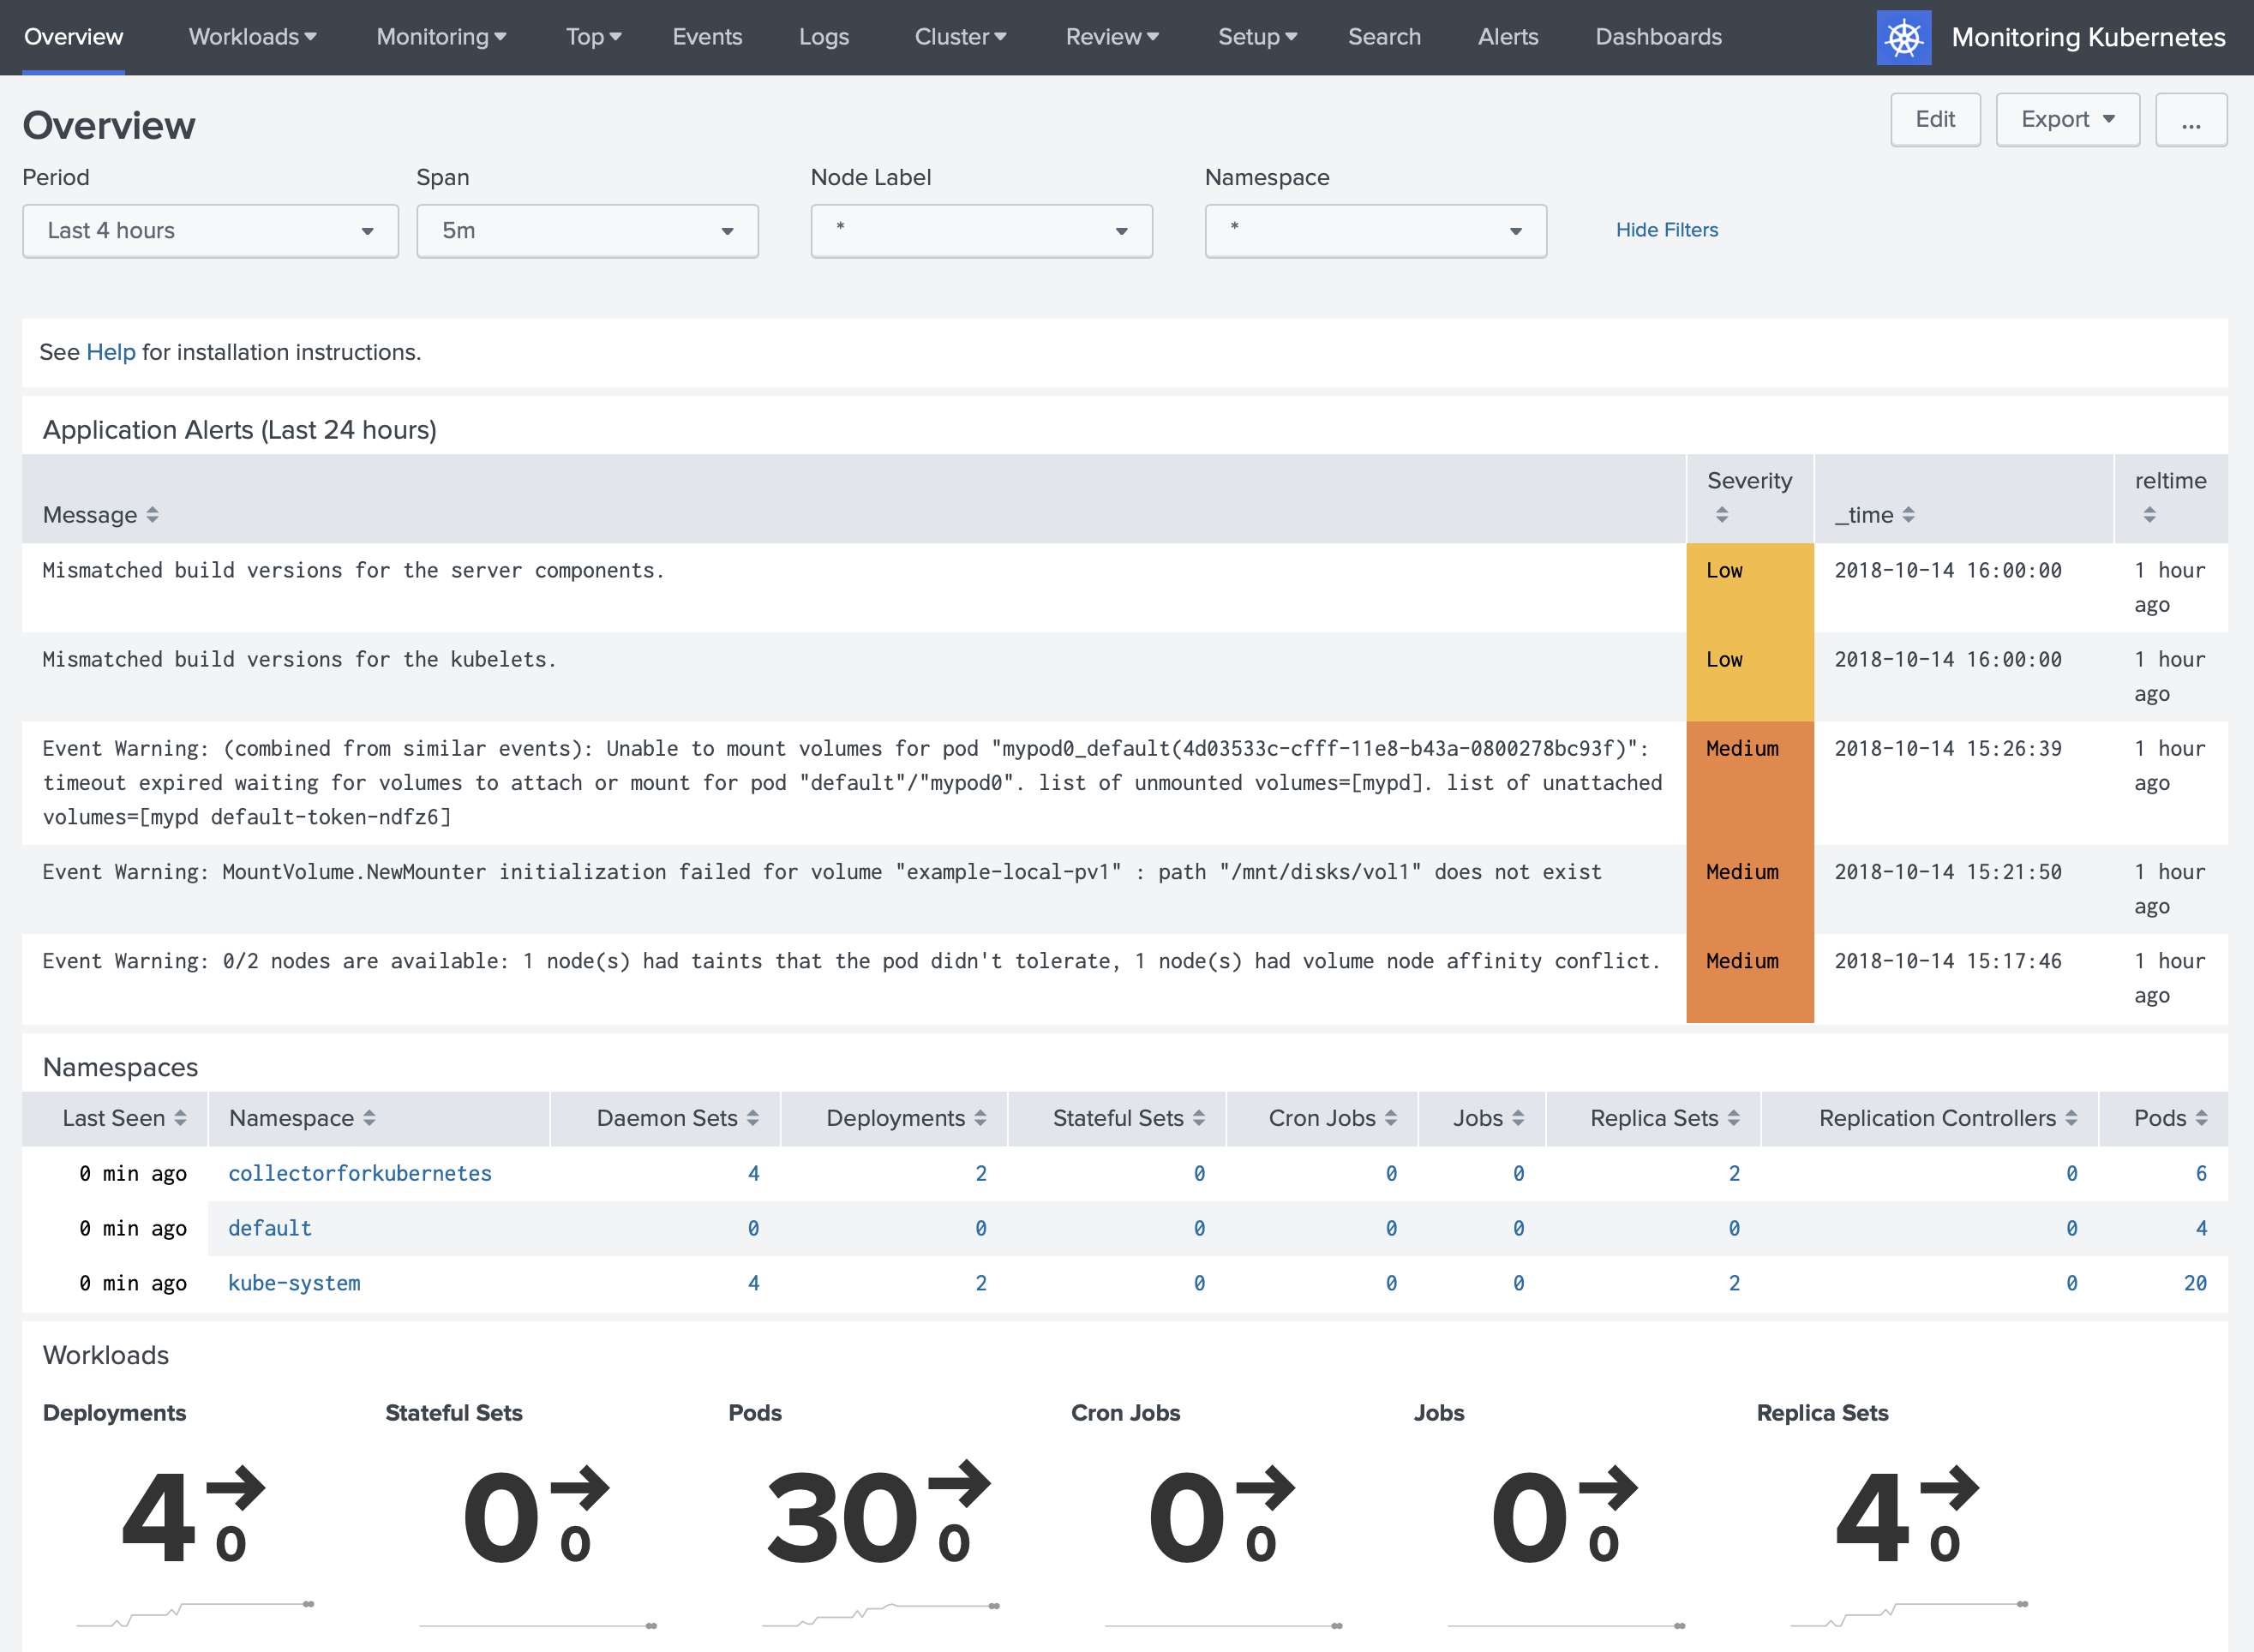
Alert triggers
By default, triggered alerts show up at the top of the Overview page. The table is populated from the Splunk REST call /alerts/fired_alerts/.
Other triggers
Browse Splunk Base for alert actions that wire Splunk into your incident management or chat tools. Once an action is installed, you can add it as a trigger on any of the alerts above.