Collectord for Docker doesn’t scrape any Prometheus endpoints by default - but it can. If a container in your environment exposes metrics in Prometheus format, you can point Collectord at it and have those metrics forwarded to Splunk alongside your container logs.
Configuration
Each scrape target is defined as its own [input.prometheus::NAME] stanza. The name is yours to pick - make it descriptive, since it shows up alongside the metrics - and the rest of the stanza configures where to scrape, how often, and how to authenticate.
 1[input.prometheus::ANYNAME]
 2
 3# disable input
 4disabled = false
 5
 6# specify the type for current input
 7type = docker_prometheus
 8
 9# specify Splunk index for current input
10index =
11
12# specify the host for current input
13host =
14
15# specify the source
16source =
17
18# how often to collect prometheus metrics
19interval = 60s
20
21# Prometheus endpoint, multiple values can be specified, collectord tries them in order till finding the first
22# working endpoint.
23# At first trying to get it through proxy
24endpoint.1 =
25# endpoint.2 =
26
27# token for "Authorization: Bearer $(cat tokenPath)"
28tokenPath =
29
30# server certificate for certificate validation
31certPath =
32
33# client certificate and key for authentication
34clientCertPath =
35clientKeyPath =
36
37# Allow invalid SSL server certificate
38insecure = false
39
40# include metrics help with the events
41includeHelp = false
The Prometheus project maintains a long list of exporters for popular services - databases, web servers, message brokers, and more - that you can drop into your environment and point Collectord at.
Example. Collecting metrics from nginx service.
To make this concrete, here’s how to scrape an nginx container that already exposes a /metrics endpoint. We’ll use the sophos/nginx-prometheus-metrics image because it’s self-contained and ships ready to scrape.
sophos/nginx-prometheus-metricsis a community image, not an official nginx image. We use it here only for demonstration.
Start the container with the metrics port published - 9527 is where this image exposes its Prometheus endpoint:
1docker run -d --rm -it -p 80:80 -p 1314:1314 -p 9527:9527 sophos/nginx-prometheus-metricsNow define the Collectord input in 002.conf. The key choice is how Collectord reaches the metrics endpoint - here we lean on the published port and host.docker.internal, which keeps the configuration simple at the cost of relying on the host’s external network path.
 1[general]
 2acceptLicense = true
 3
 4[output.splunk]
 5url = https://hec.example.com:8088/services/collector/event/1.0
 6token = B5A79AAD-D822-46CC-80D1-819F80D7BFB0
 7insecure = true
 8
 9[input.prometheus::nginx-example]
10disabled = false
11type = docker_prometheus
12index =
13host =
14source = docker_nginx_example
15interval = 60s
16endpoint.1 = http://host.docker.internal:9527/metrics
17tokenPath =
18certPath =
19clientCertPath =
20clientKeyPath =
21insecure = false
22includeHelp = true
Bake the configuration into your Collectord image:
1FROM outcoldsolutions/collectorfordocker:26.04.4
2
3COPY 002.conf /config/002.conf
Then deploy it the way the installation guide describes.
Metrics format
Prometheus defines several types of metrics, and Collectord preserves the type information so you can search and aggregate accordingly.
Every metric event in Splunk carries:
metric_type- one of the types from the Prometheus metric types.metric_name- the name of the metric.metric_help- only ifincludeHelpis set totrue, you will see definition of this metric.metric_label_XXX- if the metric has labels, you will be able to see them attached to the metric values.seed- unique value from the host for specific metric collection.
The numeric fields depend on the type:
counterv- current counter valued- the difference with a previous valuep- period for which this difference is calculated (in nanoseconds)
summaryandhistogramv- valuec- counter specified for thissummaryorhistogrammetric
- All others
v- value
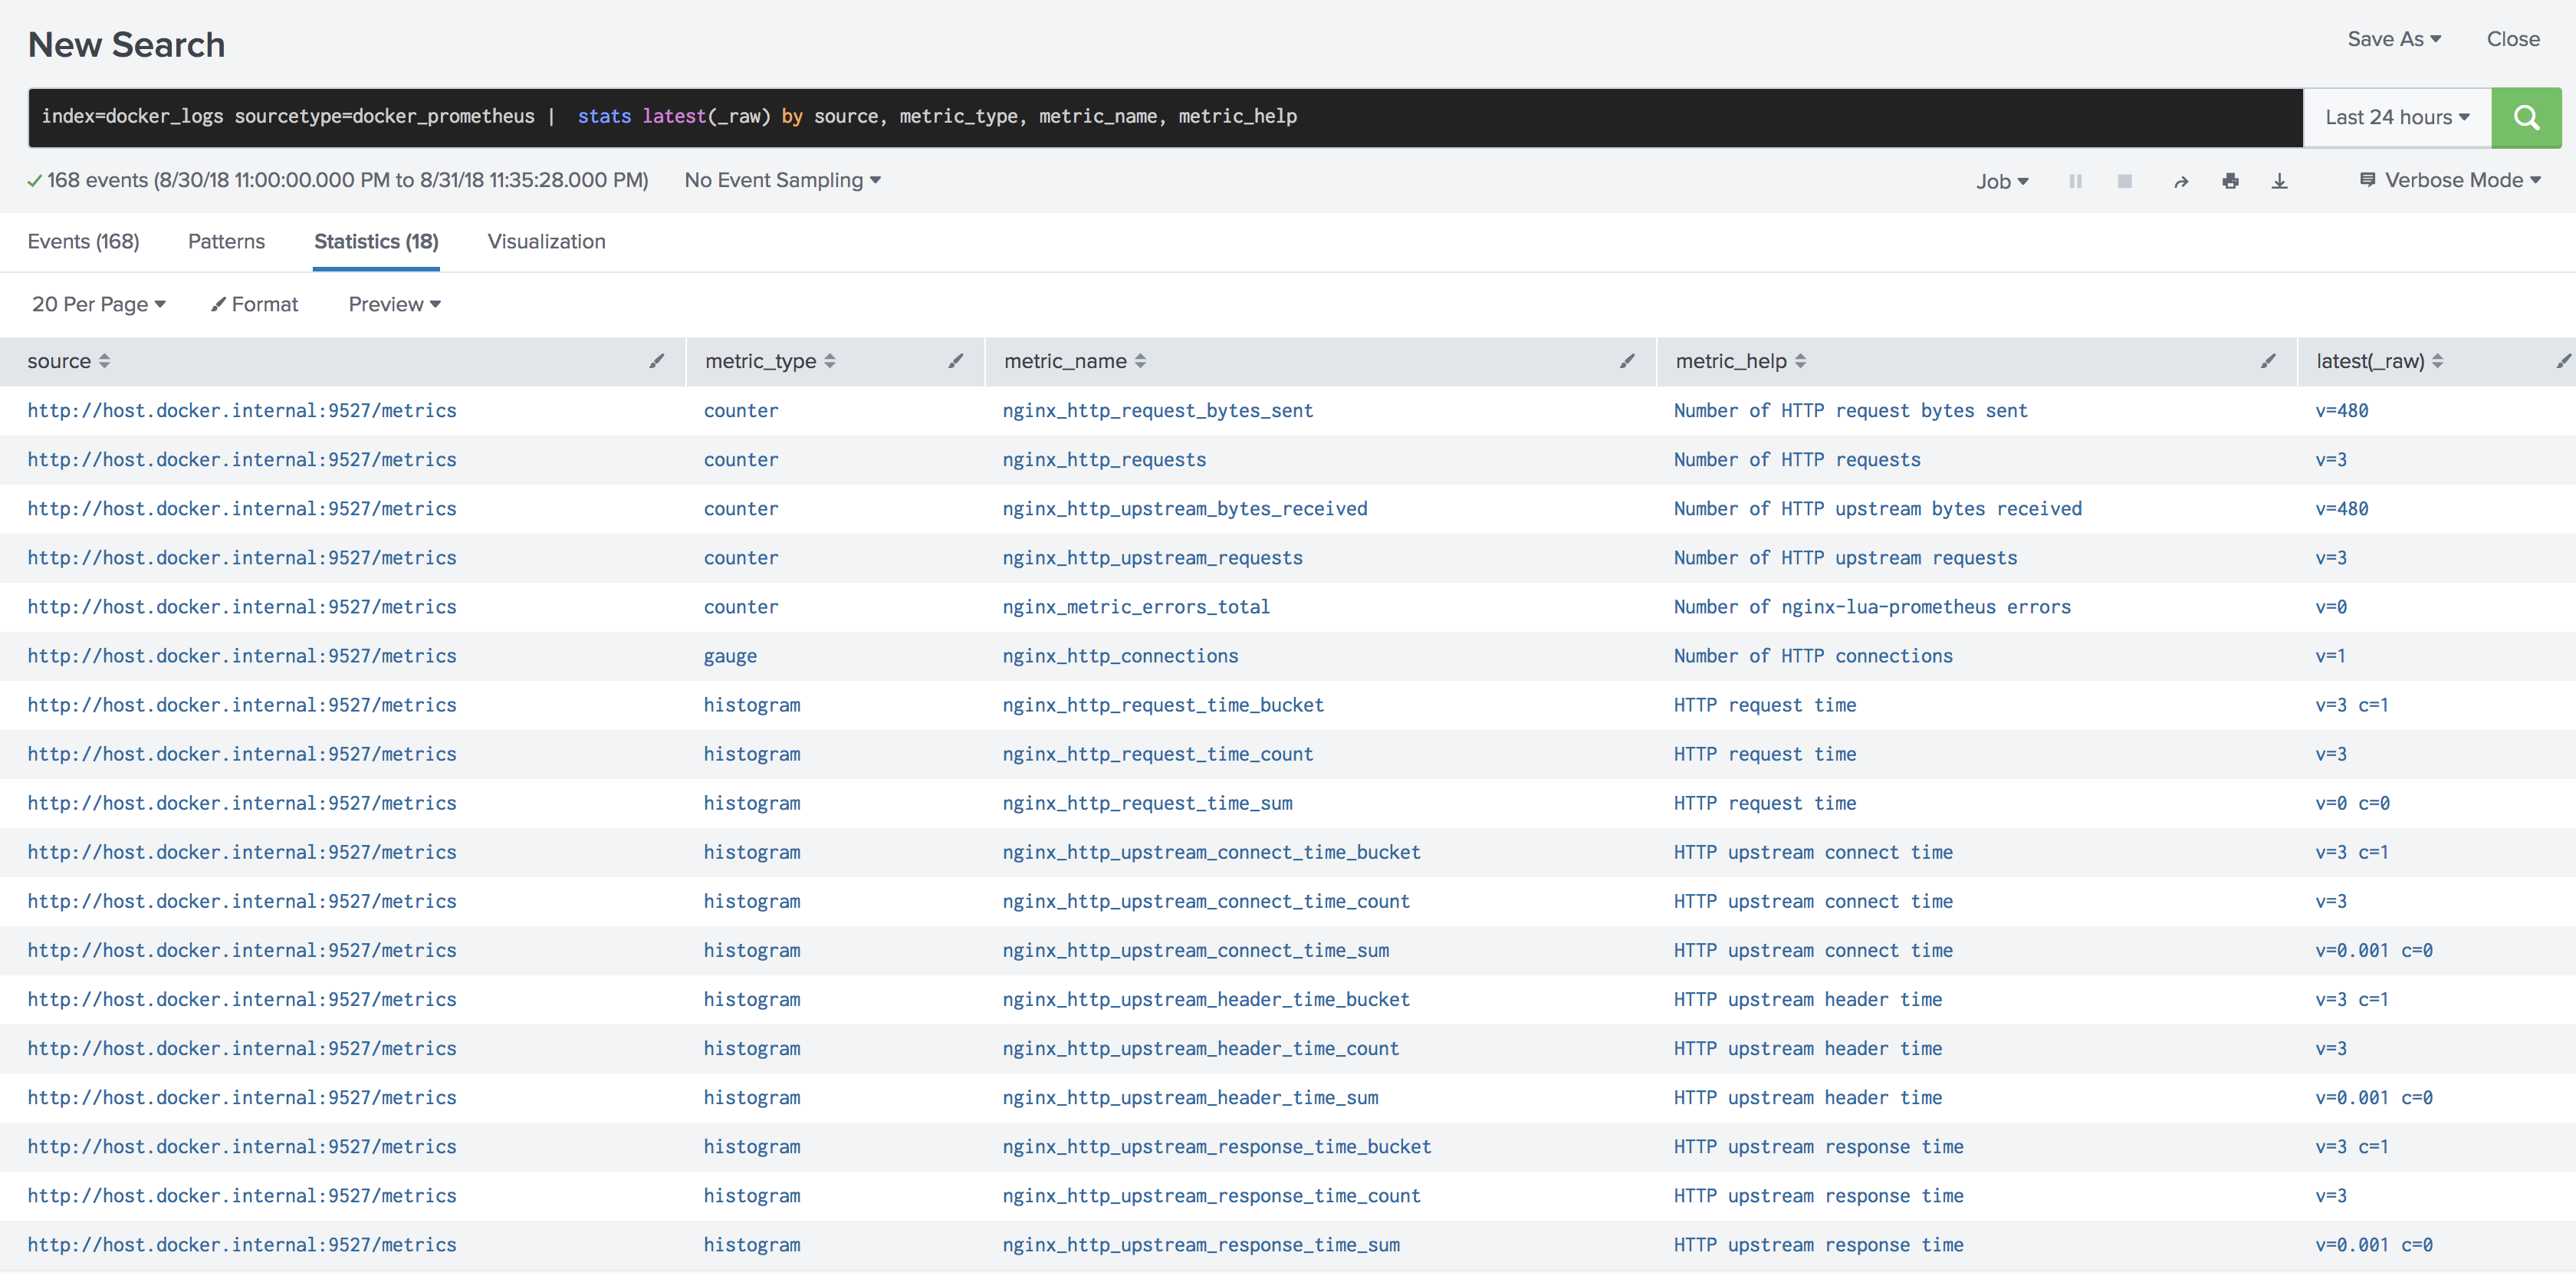
If you’ve enabled includeHelp, this search lists every metric Collectord is forwarding along with its description - handy for figuring out what’s available before building a dashboard:
1sourcetype="docker_prometheus"
2|  stats latest(_raw) by source, metric_type, metric_name, metric_help