Kubernetes Search ships a set of dashboards built entirely on its search commands. Because the commands query the API live, the dashboards show the cluster as it is right now - they’re a live console, not a view over stored history. Each dashboard has a cluster picker, so you point it at any cluster you’ve registered.
Find them under the app’s navigation, grouped as below.
Overview
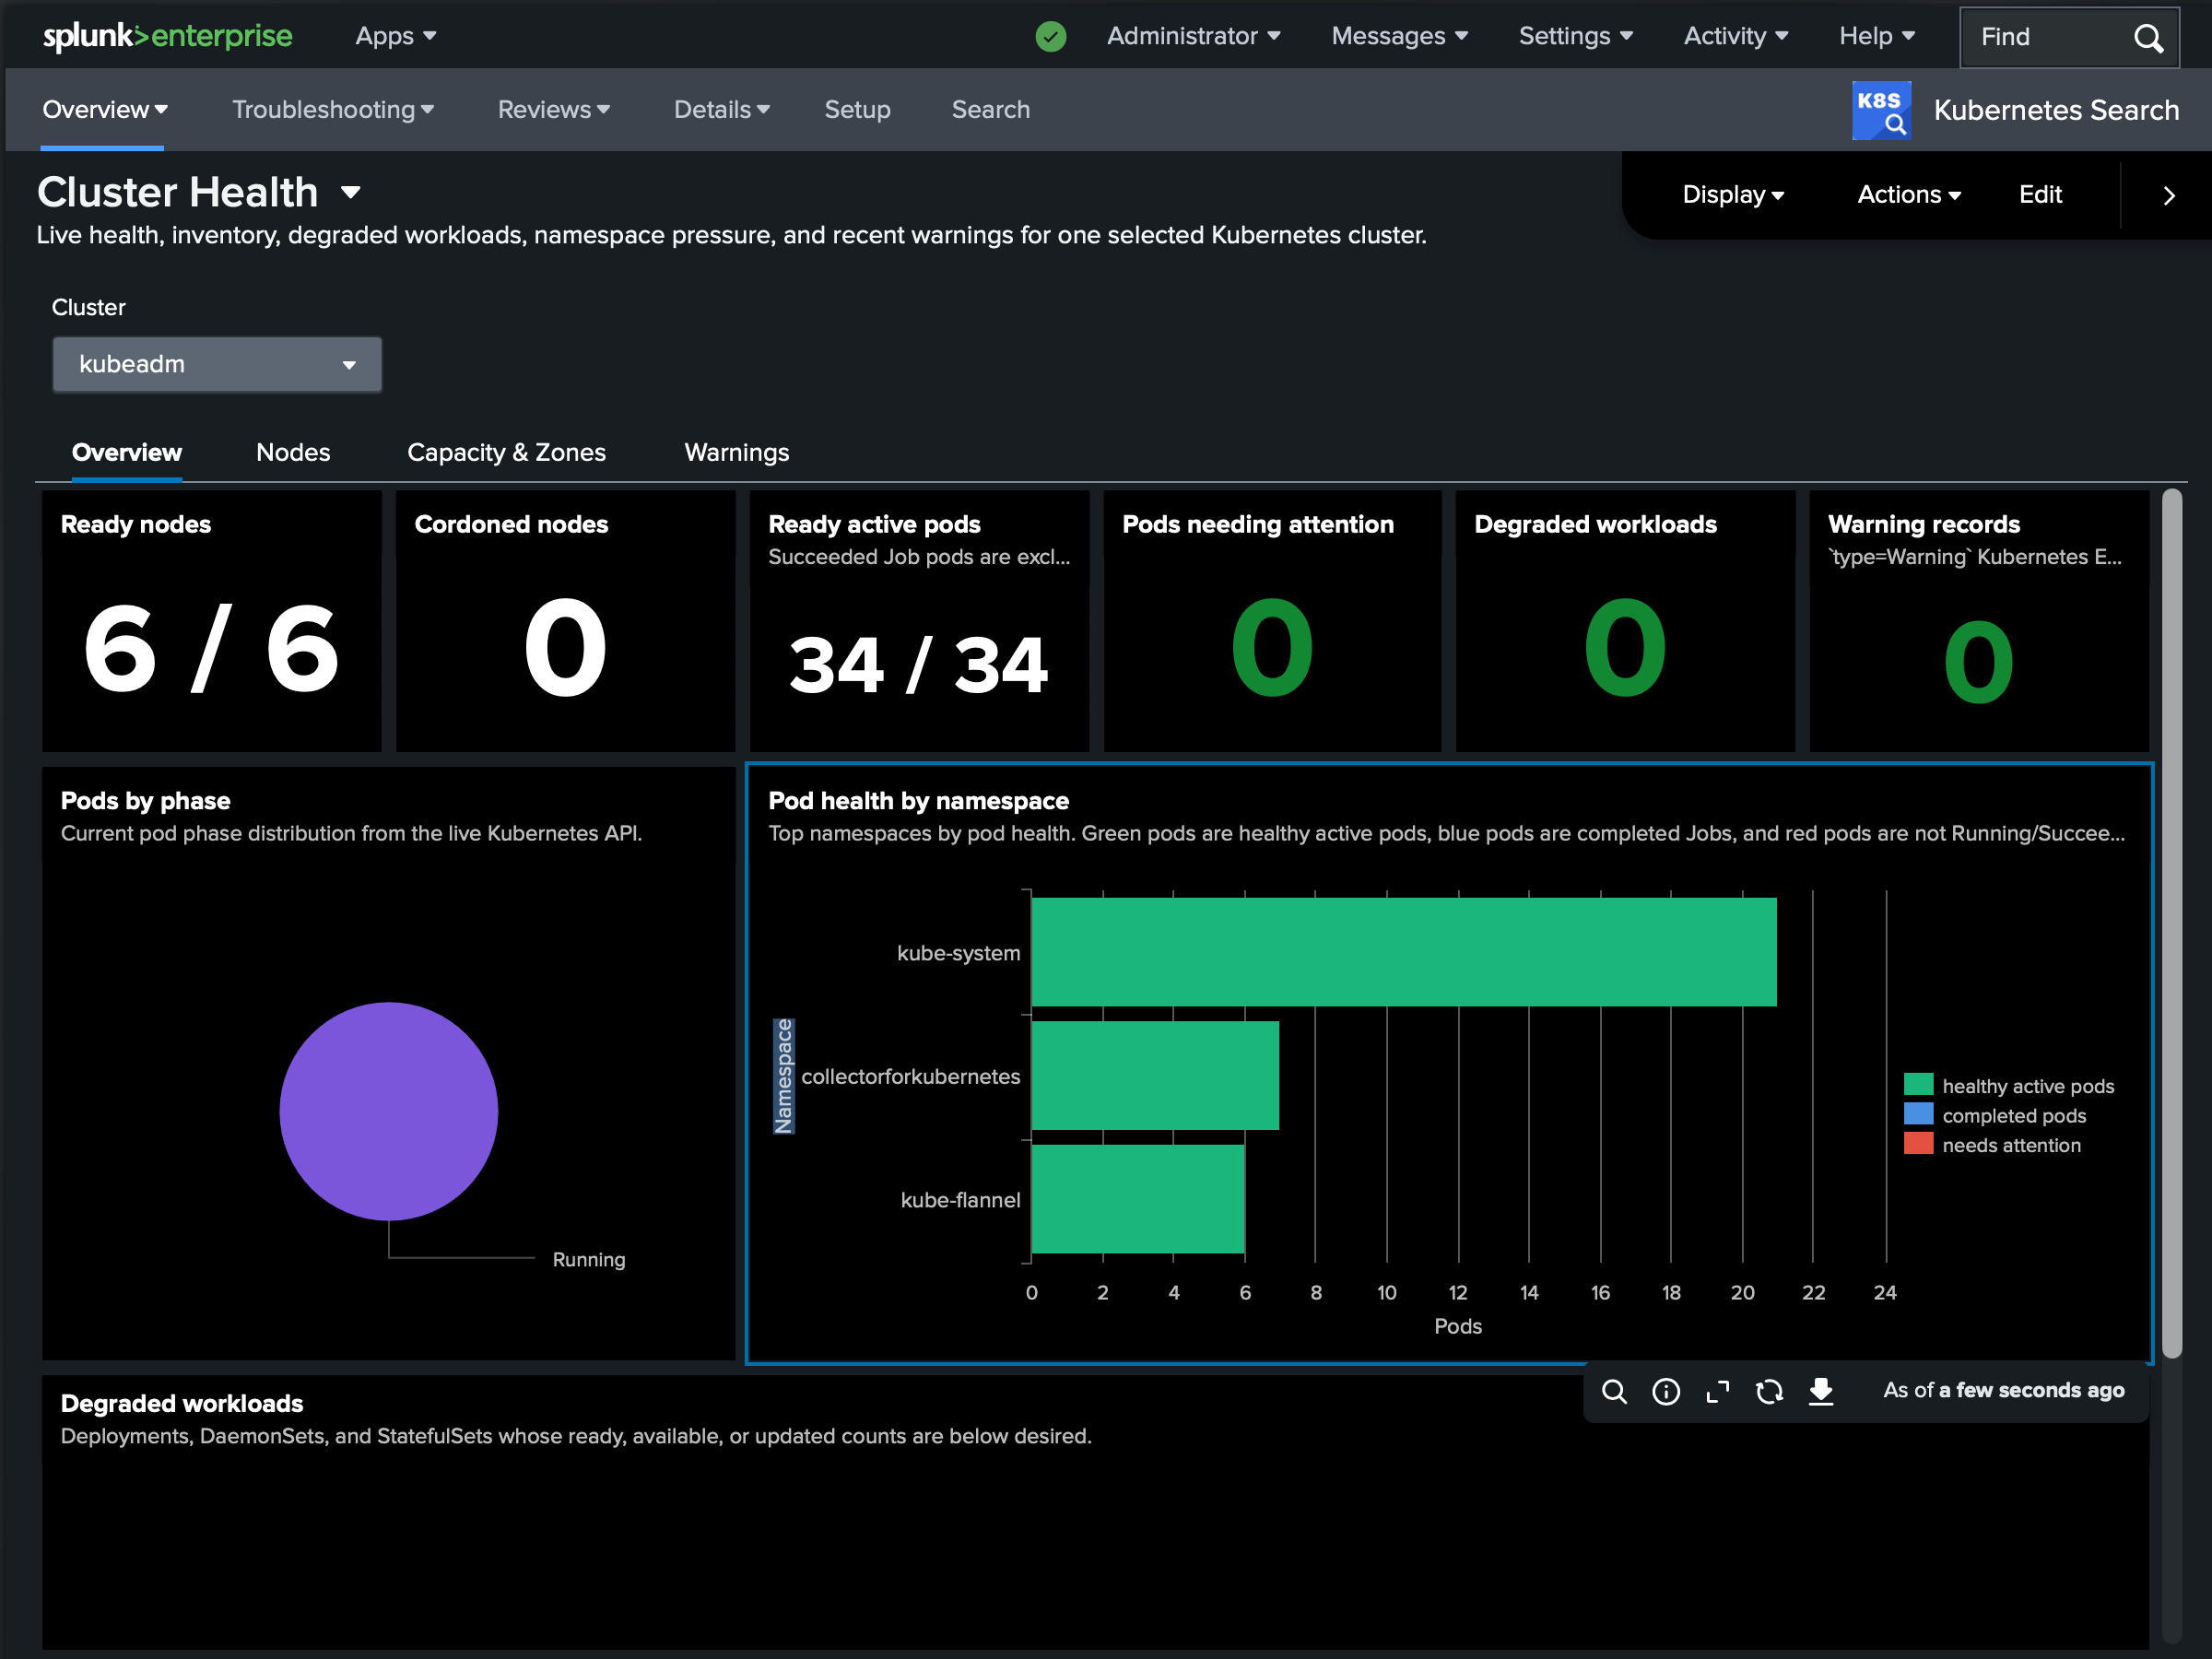
Cluster Health is the landing dashboard: live health and inventory for one cluster - node and pod counts, degraded workloads, namespaces under pressure, and the most recent warnings, on one screen.
System Components reports the state of the control plane - API server, etcd, scheduler, and controller-manager - so you can confirm the cluster’s core is healthy before digging into workloads.
Workloads summarizes Deployments, StatefulSets, and DaemonSets and their rollout status, surfacing anything that isn’t fully available.
Troubleshooting
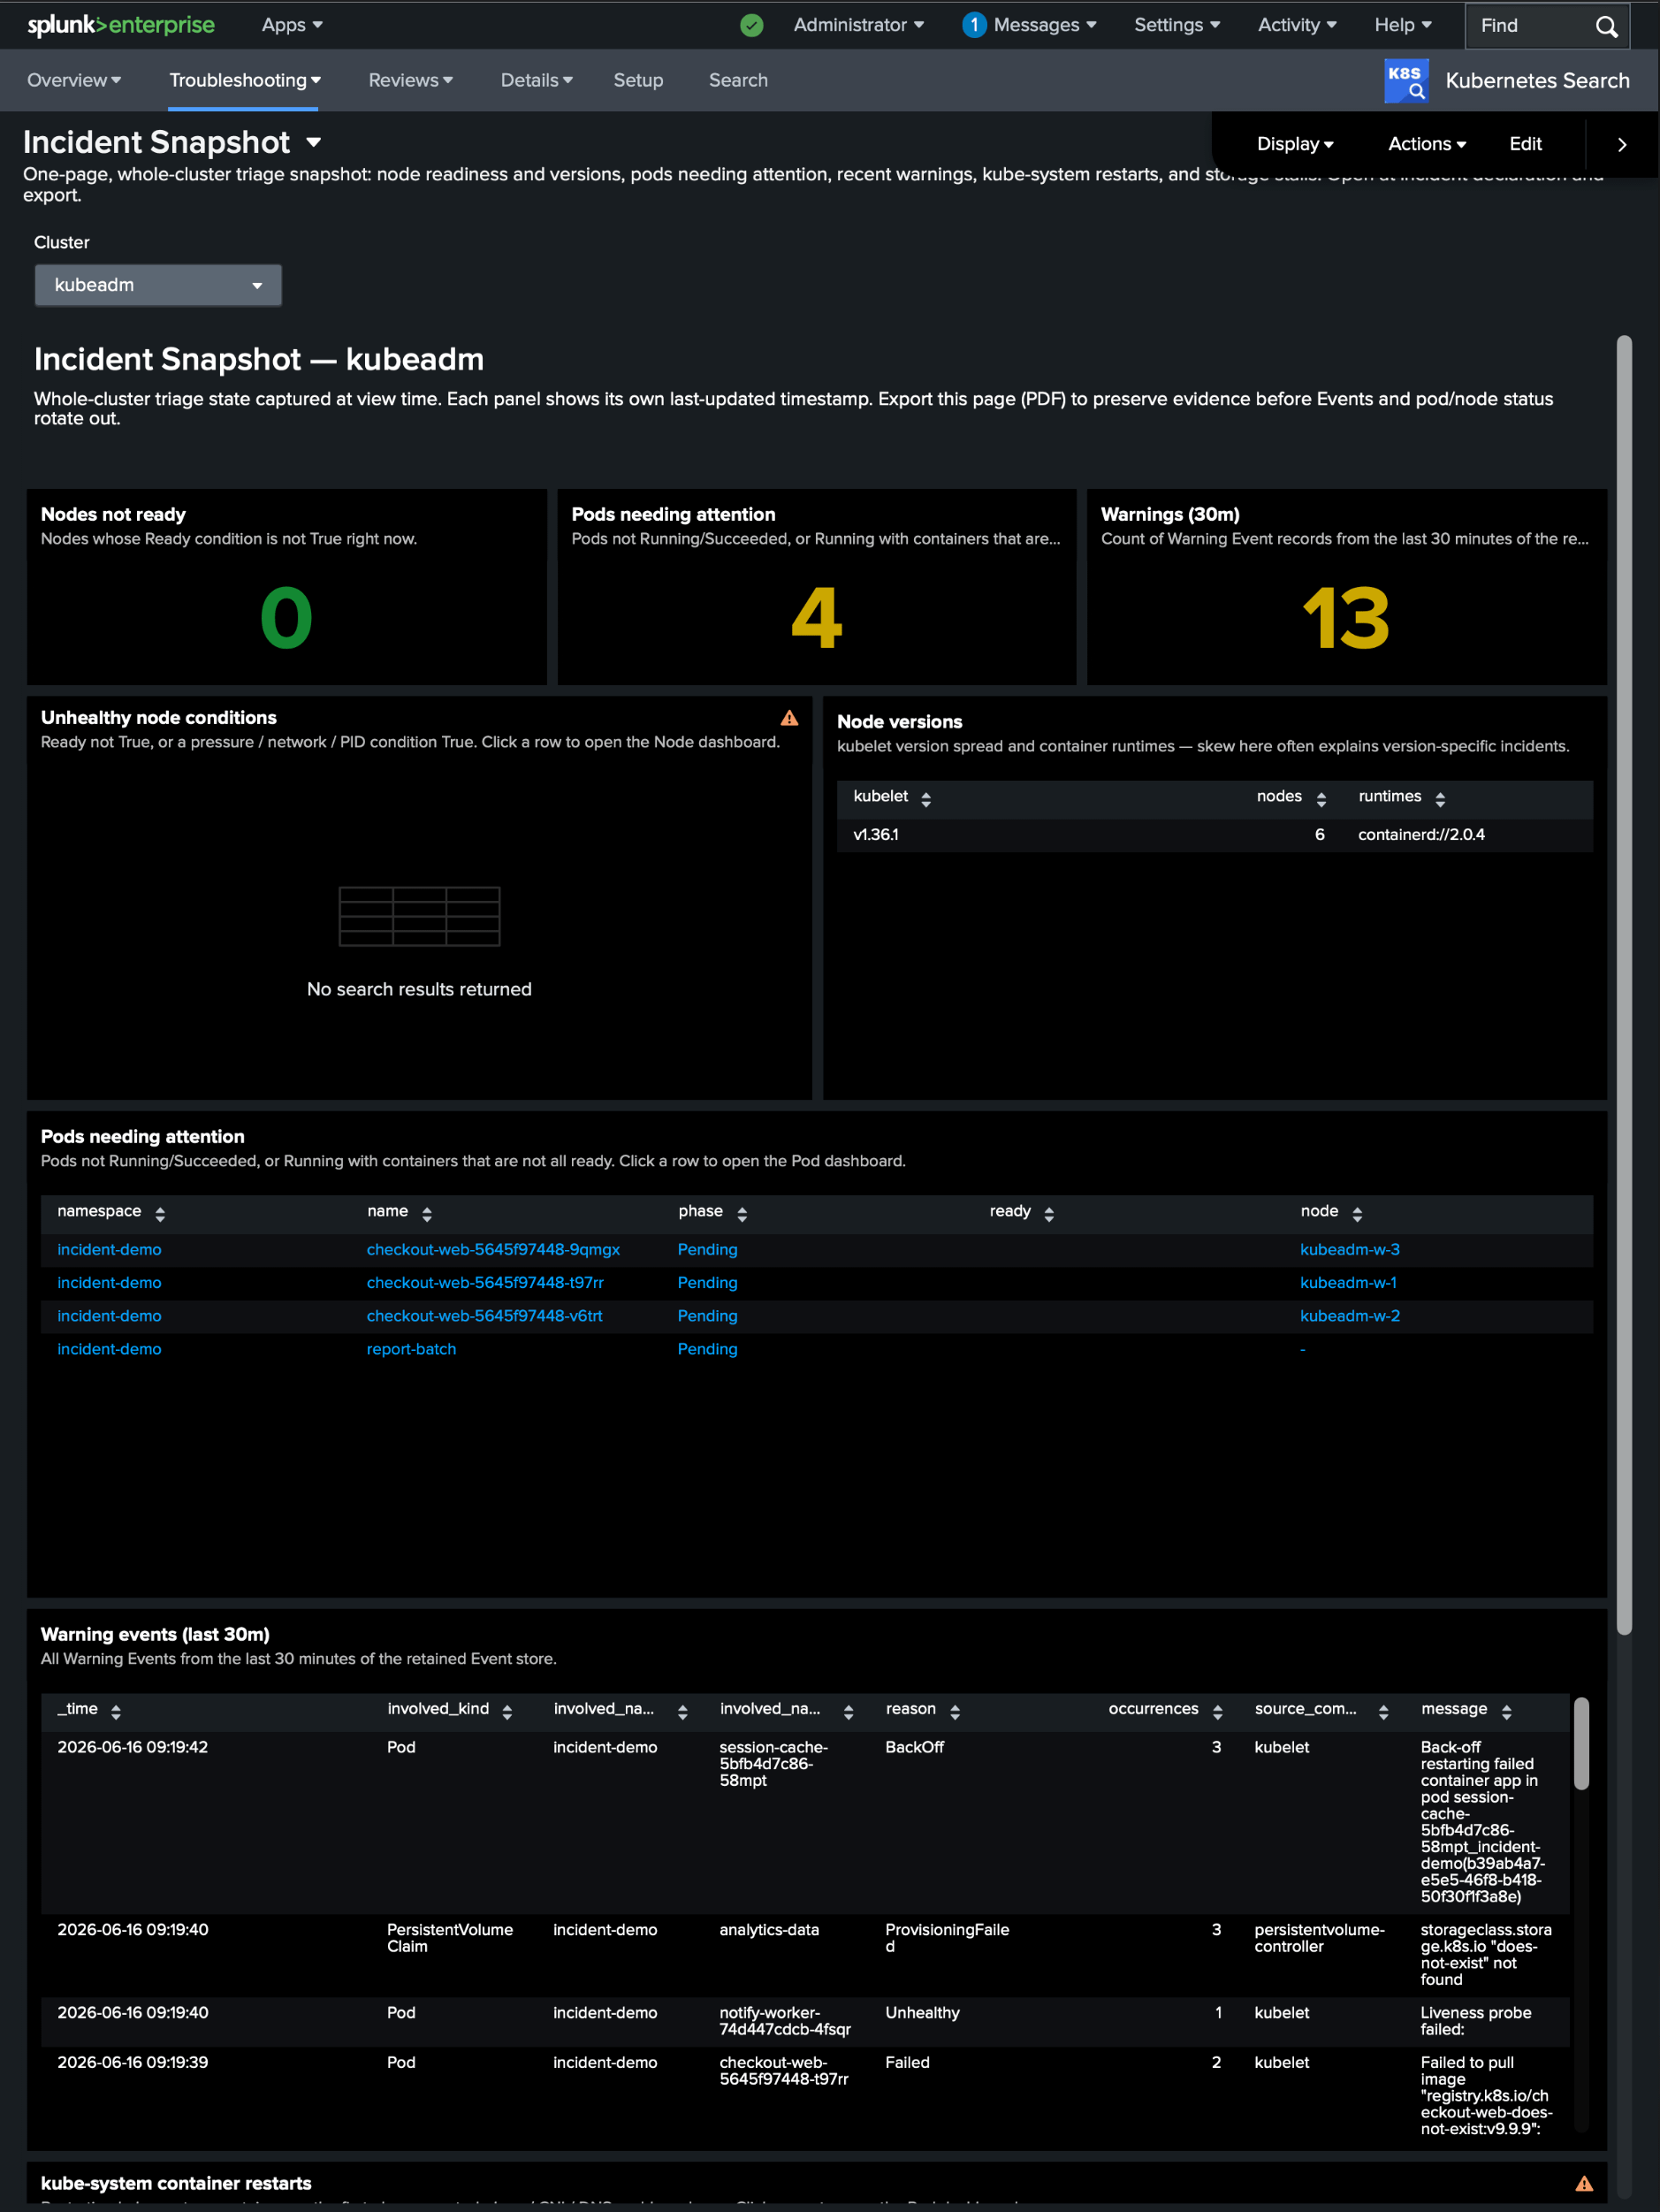
Incident Snapshot is the page to open when something is wrong: a single, dense summary of what’s unhealthy right now - failing pods, recent warning events, and restarts - so you can orient in seconds.
Reliability Troubleshooting drills into the classic failure modes: crash loops and restarts, OOM kills, pending and unschedulable pods, failing probes, image-pull failures, stale pods, and old or failed batch Jobs and CronJobs.
Events is an interactive browser over | k8sevents - filter by namespace, type, reason, and the object an event targets.
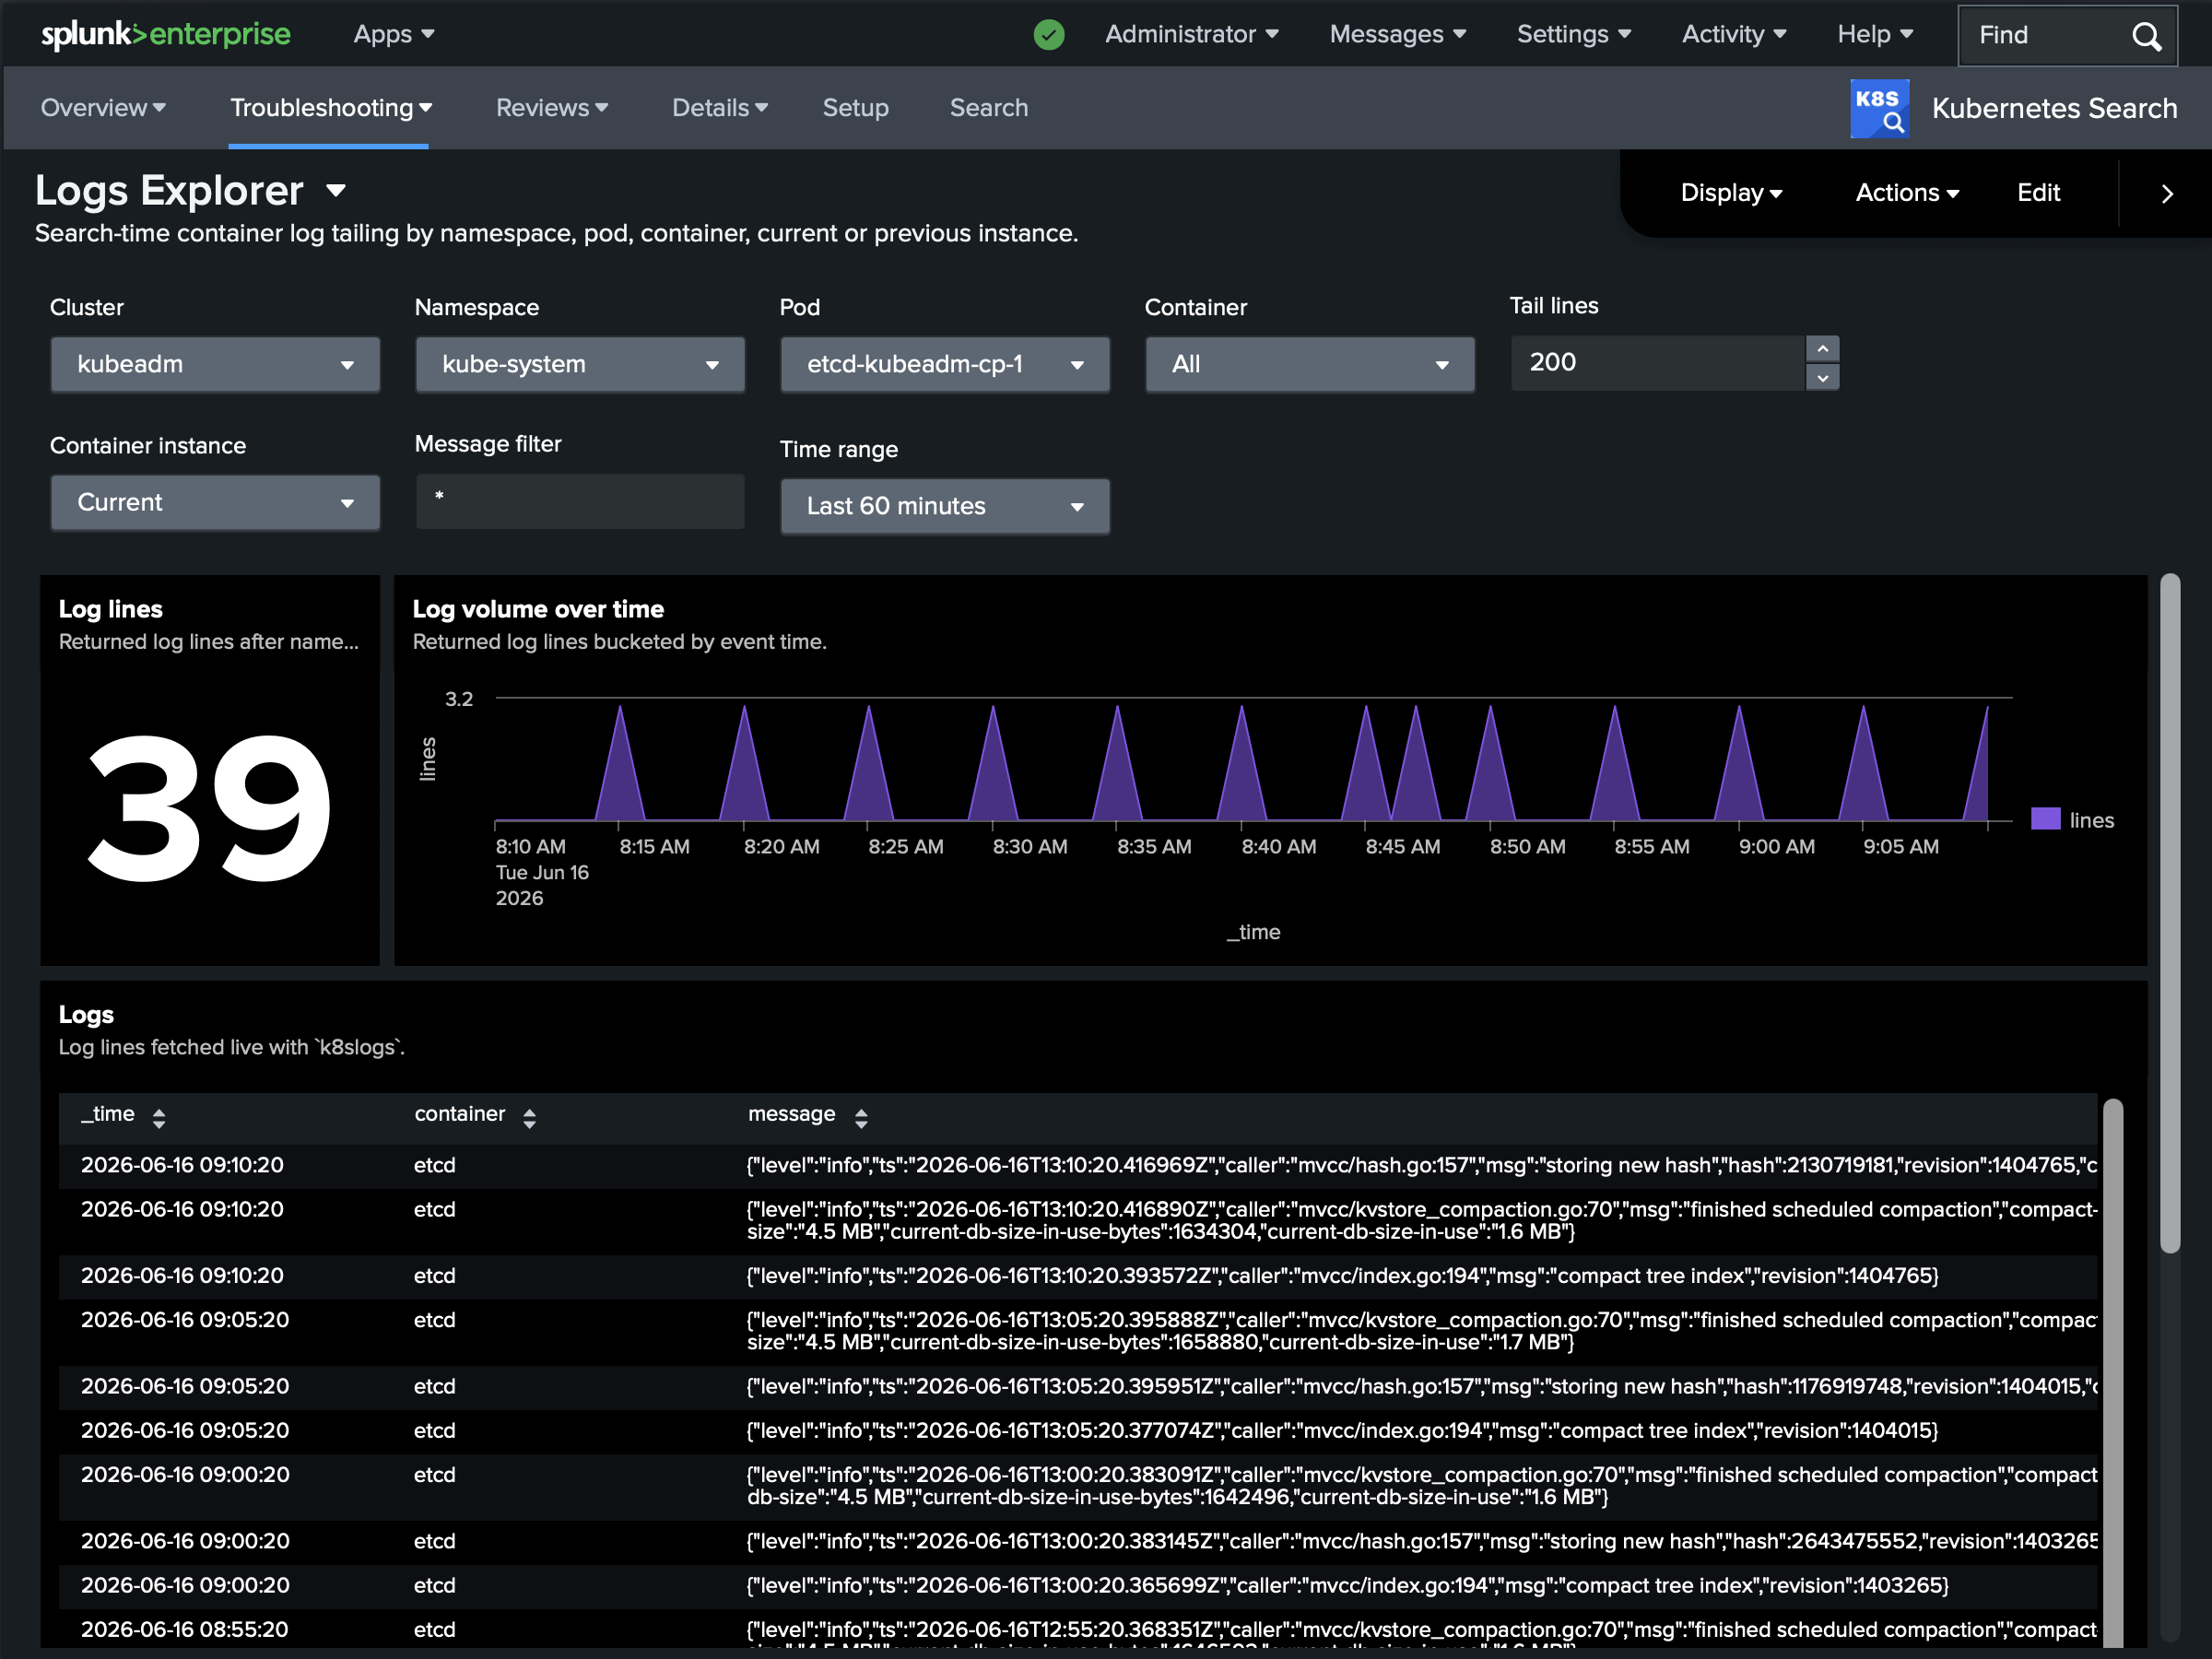
Logs Explorer is an interactive front end to | k8slogs: pick a namespace and pod pattern, set a tail or time window, and read the lines without writing SPL.
Reviews
Resource Hygiene reviews configuration quality across the cluster - containers without resource requests or limits, missing liveness and readiness probes, and stale images.
Networking & Storage reviews network and storage objects - Services (flagging any without ready endpoints), Ingresses, EndpointSlices, persistent volumes and claims, and StorageClasses.
Details
Pod shows a single pod in depth: its spec and status, per-container state, and the events that reference it - the dashboard equivalent of | k8sdescribe kind=pod/....
Node does the same for a node: capacity and allocatable resources, conditions, the pods scheduled on it, and related events.
Every dashboard is read-only and runs against the live API on the search head, so opening one is exactly as safe (and as current) as running the underlying command yourself. To build your own, start from the Command reference - the bundled dashboards are just SPL over the same five commands.