Search for AWS ships one dashboard per AWS service, built entirely on its search commands. Because the commands query AWS live, the dashboards show your accounts as they are right now - a live console, not a view over stored history. Every dashboard has an account picker and, where the service is regional, a region picker fed by the account’s allowed or enabled regions.
Two conventions run through all of them:
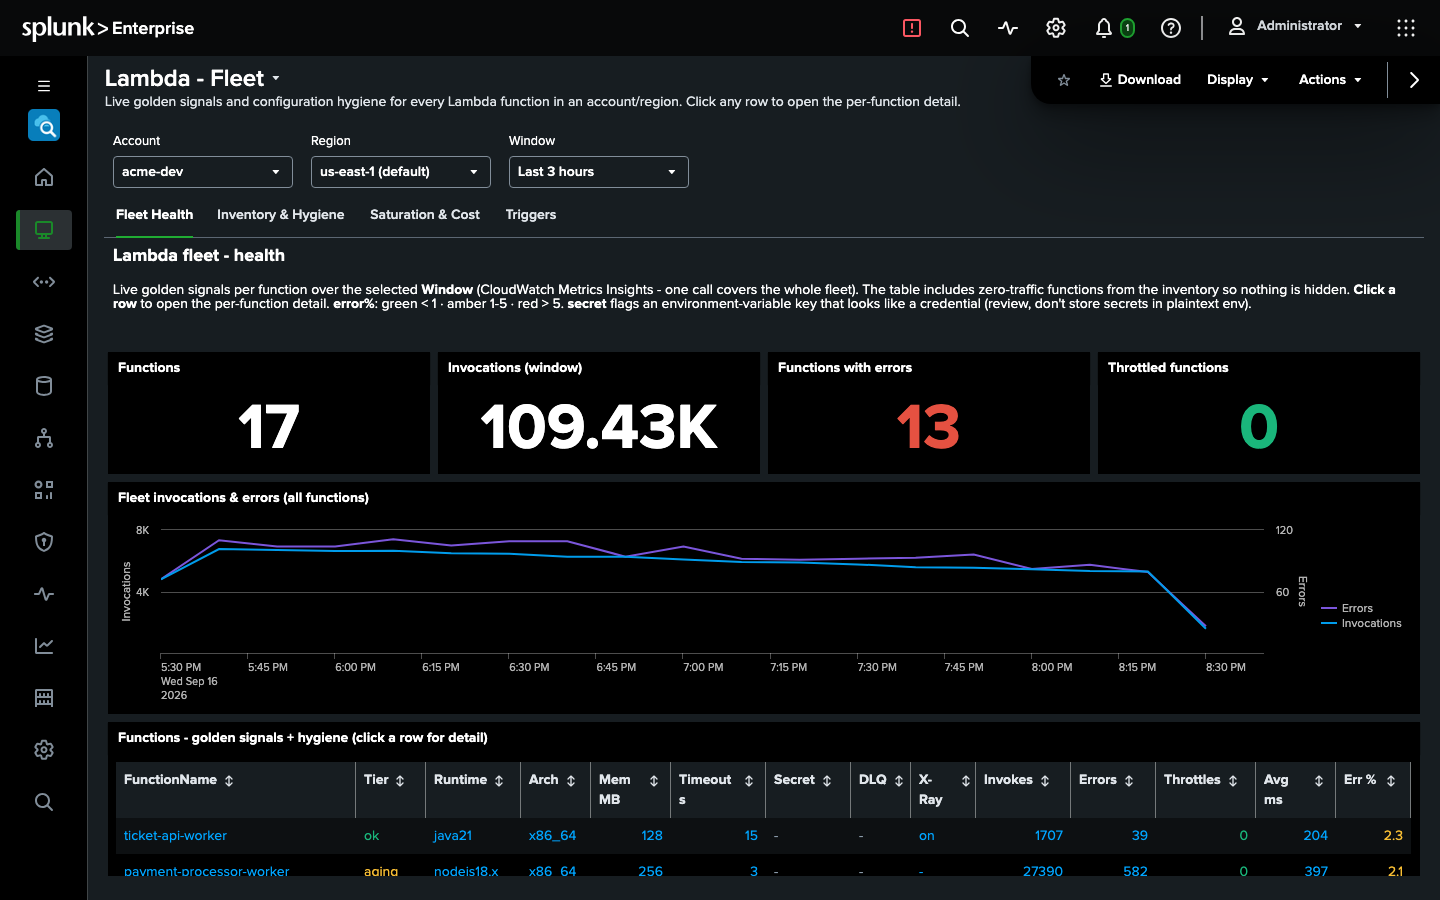
- Fleet, then detail. A service dashboard is a fleet view: inventory, posture, and hygiene for everything of that kind in the selected account and region. Clicking a row opens the detail dashboard for that one resource, carrying the account, region, and time window across. The per-resource CloudWatch metrics and logs live on the detail dashboards, so metric calls happen for the resource you asked about, not for the whole fleet on every page load. Lambda and EKS are the exceptions - their fleet views chart the whole fleet with a handful of Metrics Insights queries, and the Lambda fleet’s Saturation & Cost tab runs Logs Insights over every function’s log group; see Costs and performance.
- Documents open in place. Where a resource’s documents are the point - an IAM role’s trust and inline policies, a KMS key policy, a WAF web ACL’s rules, a CloudFormation stack’s properties - clicking the row fills an inspector directly under the table.
Find them under the app’s navigation bar, grouped as below.
Overview
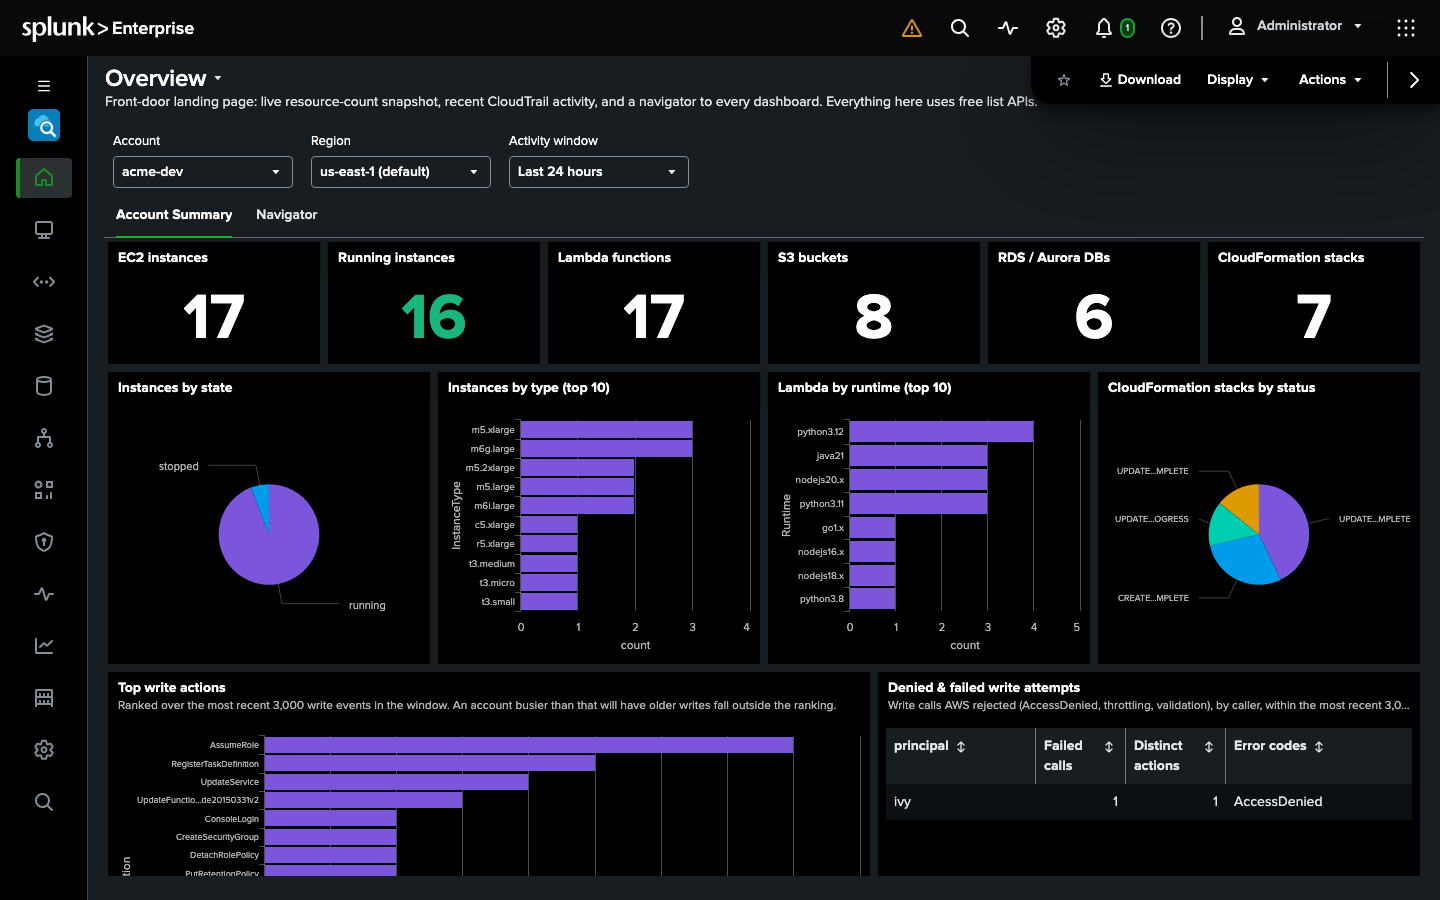
Overview is the landing dashboard: the account’s footprint at a glance, and a Navigator tab that links to every dashboard in the app.
Compute
Compute & Inventory covers EC2 - instances by type, state, and availability zone, with an instance detail dashboard for CPU, network, disk, status checks, and the instance’s CloudTrail history. Lambda lists every function with runtime, memory, timeout, and triggers; its detail dashboard adds invocations, errors, duration, throttles, concurrency, an error-class breakdown read from the function’s own log lines (timeouts and crashes), and a Logs tab that tails /aws/lambda/<name>. ECS covers clusters and services with a service detail dashboard that discovers each container’s log group from the task definition. EKS and ECR list clusters and repositories.
Networking
Networking covers VPCs, subnets, route tables, gateways, and security groups, with the rules that matter for posture called out. Load Balancers lists ALBs and NLBs with listeners and target groups. Its detail dashboard charts request, latency, and error metrics for application load balancers; a network or gateway load balancer is shown there by name, and its panels stay empty, because it publishes under a different CloudWatch namespace. API Gateway lists REST and HTTP APIs. Its detail dashboard is for REST APIs: request, latency, and error metrics for the API as a whole (by API name, not per stage) and execution logs. HTTP and WebSocket APIs are inventory only there; chart their metrics on Metrics Explorer, by ApiId.
Storage
S3 lists buckets with encryption, versioning, public-access block, and object ownership; the bucket detail dashboard adds bucket-policy statements, lifecycle rules, tags, and size and object-count trends. EBS lists volumes with type, size, encryption, and attachment; the volume detail dashboard adds IOPS, throughput, latency, queue length, and burst balance, and links through to the attached instance.
Databases
RDS & Aurora lists instances and clusters with engine, class, storage, and Multi-AZ; the instance detail dashboard adds CPU, connections, IOPS, latency, free storage, and every log type the instance exports. DynamoDB lists tables with billing mode and capacity; the table detail dashboard adds consumed capacity, throttles, and latency.
App Integration
SQS, SNS, and Step Functions each list the service’s resources with their configuration and a detail dashboard for queue depth and age, delivery metrics, and execution outcomes.
Analytics
Kinesis Data Streams and Kinesis Data Firehose list streams with shards, retention, and encryption, and detail dashboards for throughput and iterator age. Glue Data Catalog browses databases, tables, and partitions, with a table detail dashboard showing columns, format, and location - the catalog behind your Athena queries.
Security
IAM lists roles, users, and managed policies; clicking a row shows the trust policy, inline policies, and attached policies in place. KMS lists keys with rotation state and shows a key’s policy in place. WAF lists web ACLs with their rules. CloudTrail - Security & Activity summarizes recent management events by service, user, and outcome. CloudTrail - Event Explorer is an interactive front end to | awscloudtrail: it loads the most recent events, up to the limit you pick, and narrows them by event name, event source, principal, resource, and outcome without writing SPL. The filters apply to what was loaded, so an event older than that window is not found - for those, search with | awscloudtrail attribute=... value=..., which asks CloudTrail for the match itself. Its Principal investigation view follows one user name or role session across everything it did; to follow an access key, use | awscloudtrail attribute=AccessKeyId value=....
Observability
CloudWatch lists alarms and log groups; alarm rows link to the Metrics Explorer with the alarm’s metric and dimensions pre-filled, and log-group rows link to the Log Tail. Metrics Explorer charts any metric the account publishes, with Namespace, Metric, and Dimensions pickers fed from the live metric catalog (| awsmetrics list=true), so an empty chart means no data in the window, not a mistyped dimension. Logs Insights runs a Logs Insights query over one or more groups. Log Tail reads raw events from any log group, newest first, driven by a CloudWatch filter pattern.
Management
CloudFormation lists stacks with status and drift-relevant fields, and shows a stack’s parameters, outputs, and resources in place. Governance, Tagging & Resource Explorer finds resources by tag and reports tag coverage. Cost & Usage is the one place Cost Explorer is called: cost by service, region, and tag over the time picker, and a month-over-month tab. Its panels wait for a Submit, because Cost Explorer bills per request.
About
About shows the app version, links to the Setup page, and reprints the IAM policy the app needs and the Splunk Cloud egress notes.
Every dashboard is read-only and runs against the live APIs on the search head, so opening one is exactly as safe (and as current) as running the underlying command yourself. To build your own, start from the Command reference - the bundled dashboards are just SPL over the same nine commands.