Four views for whoever runs the deployment. They read the app’s usage ledger, its activity trail in _internal, its operational logs, and its KV Store collections, all of which are readable by administrators - other roles see empty panels. Token Usage and Activity Trail have a time-range picker and a user filter, Health has the time-range picker alone, and the Conversation inspector takes a conversation id and reads that conversation over all time. A row on Token Usage or Activity Trail opens the Conversation inspector for that conversation.
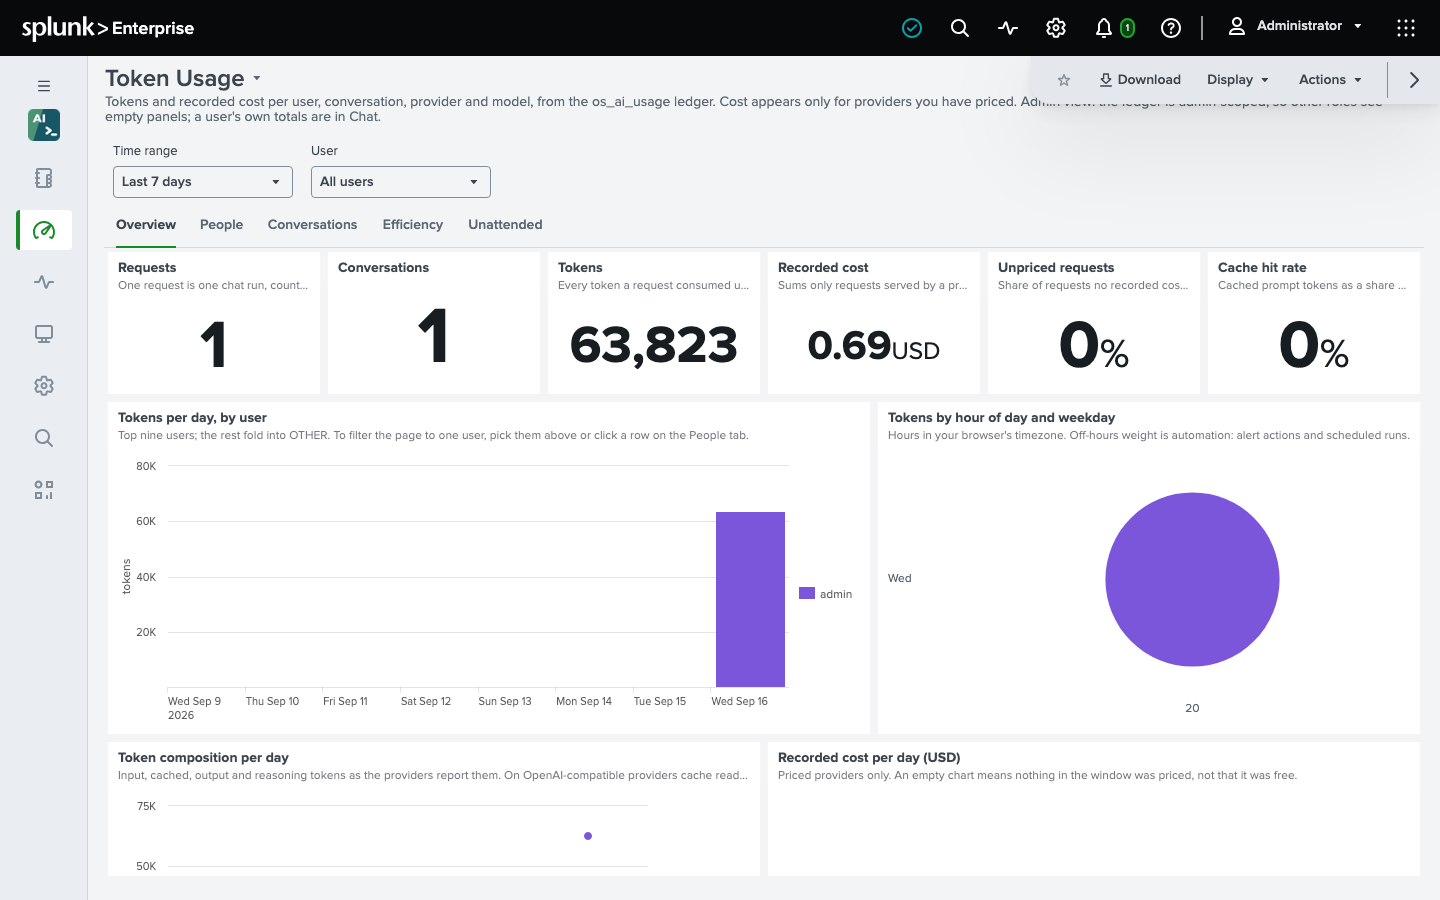
Token Usage
Who is spending, and on what. Tokens and cost per user and per day, an hour-of-week punchcard, the most expensive conversations, prompt-cache hit rate and the dollars it saved at the rates frozen on each record, the reasoning share of output per model, requests served by more than one provider, tool-call depth against tokens, and each user’s last 24 hours against the configured spend limits next to the deployment-wide budget. An Unattended tab attributes spend to the alert that triggered it, and a panel lists the | osai runs as the activity trail saw them, beside the ledger’s own record of them. See Costs and limits.
Activity Trail
Who runs which tools, and what changed. Turns by outcome and time-to-answer per model, a user-to-tool flow, tool failure rates with tail latency and the error each failed call returned, every change on a timeline per object with its approver (including approvals made on another user’s behalf), refusals classified as declined by a person, blocked by policy, budget, concurrency cap, or license, prompt-injection flags by pattern and by tool, and the searches the agent ran. See Security.
Health
For whoever operates the search head. Jobs queued and running, queue-wait and run-time percentiles, provider retries, failovers, and circuit-breaker events, warnings from the worker, new conversations and active users per day, thumbs up and down with the comments people wrote, the approval modes and tool allowlists in use, and every KV Store collection’s size next to the retention settings that bound it. The dependency checks are not on this dashboard; they are one REST call - GET /os_ai_agent/health reports whether the worker is enabled and when it last ran, whether KV Store is readable, the license state, whether any provider is configured, whether token authentication is on, and whether the trail is being written, with an overall field a saved search or an external monitor can watch.
Conversation
Not in the navigation: clicking a row on Token Usage or Activity Trail opens it for that conversation, or paste a conversation id. It lists every turn, tool call, and refusal behind the conversation in order, its usage rows, and its feedback, with a link to open it in Chat.
Each dashboard runs one base search per source and post-processes it into its panels. A base search carries at most 500,000 rows, and every dashboard has a “rows read” panel per base that turns red at that number - meaning the window is too wide and every panel on that base is a lower bound. Narrow the window, or filter by user where the dashboard has that filter.