Blog
Introducing Metrics Explorer
Splunk 10.6 released on September 30th, and brought with it a rather abrupt change: the removal of the Analytics Workspace.
That’s okay. Outcold Solutions has a solution.
Introducing… Metrics Explorer
Metrics Explorer started as a handful of mcatalog searches to find metrics by name a bit faster than drilling through Analytics Workspace to find them. We used those searches when we were building a new feature for the 26.10 release of our Monitoring Kubernetes dashboards.
When Splunk 10.6 was released, we realized that the removal of Analytics Workspace meant our tools could be useful for others who still need to sift through metrics and figure out their associated dimensions… and Metrics Explorer was born.
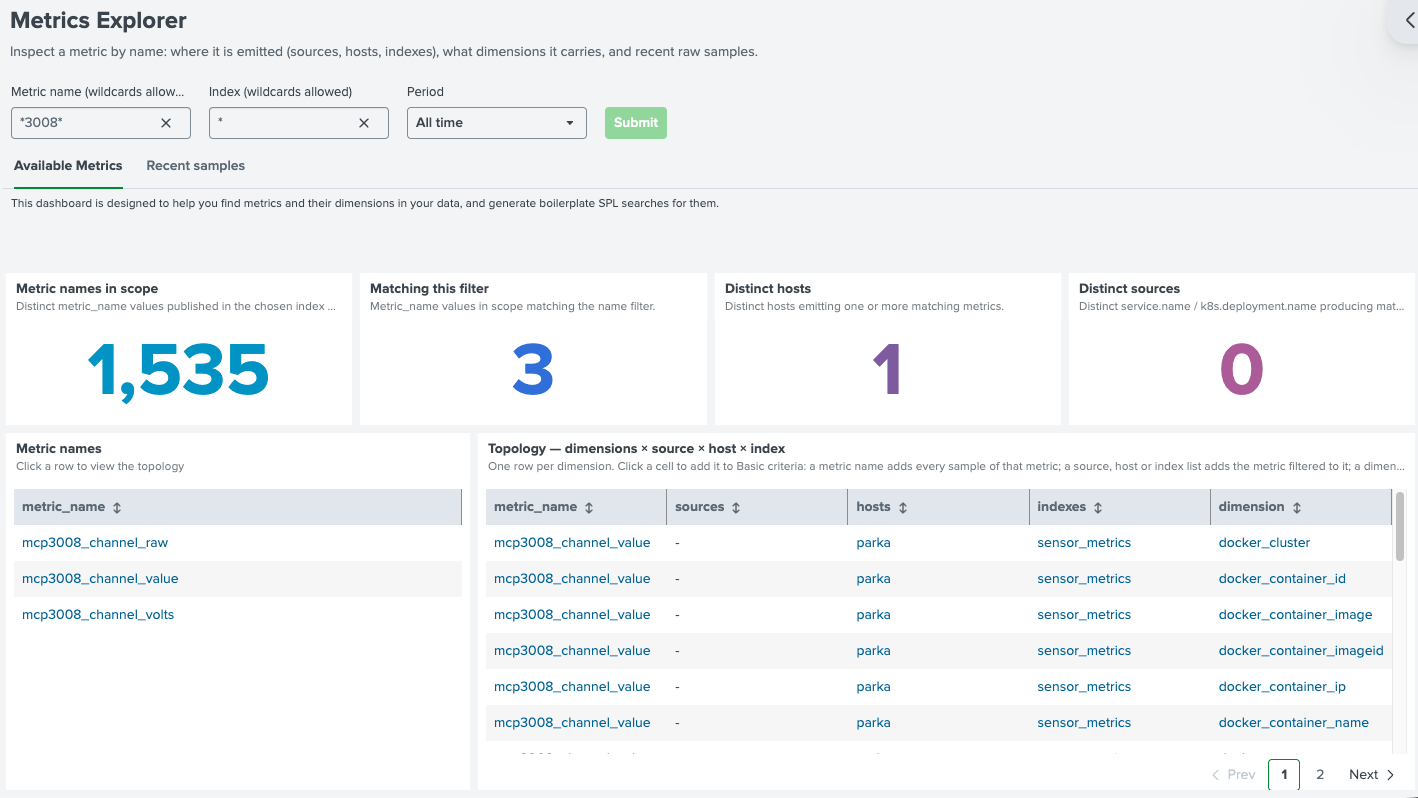
The dashboard begins with a set of single-value counters. Those are mostly helpful as a sanity check to ensure the rest of the dashboard will be useful. If a new 15-node Kubernetes cluster came online today, running Collectord to get an expected 300 metrics, but the filter only shows ten metrics from three hosts? Something else is going to need to be fixed first.
After that, the left panel runs a mcatalog search to find any metric names that match a wildcard filter. That’s particularly helpful for finding things like whether it’s “resource_usage” or “resource_use”. Once you find the right metric name, click it in that panel to set the filter for the whole dashboard, just to keep things clean.
Each metric also has dimensions with it that we can use in our mstats searches, so there’s a panel on the right that finds them all. It also shows what hosts are emitting the metrics with those dimensions, and (if it can find the information) the application source of the metric. That helps to identify that the metrics you’re expecting from a particular application have the dimensions you’re expecting.
Clicking on a dimension, source, host, or name in the Topology panel adds it to the criteria list.
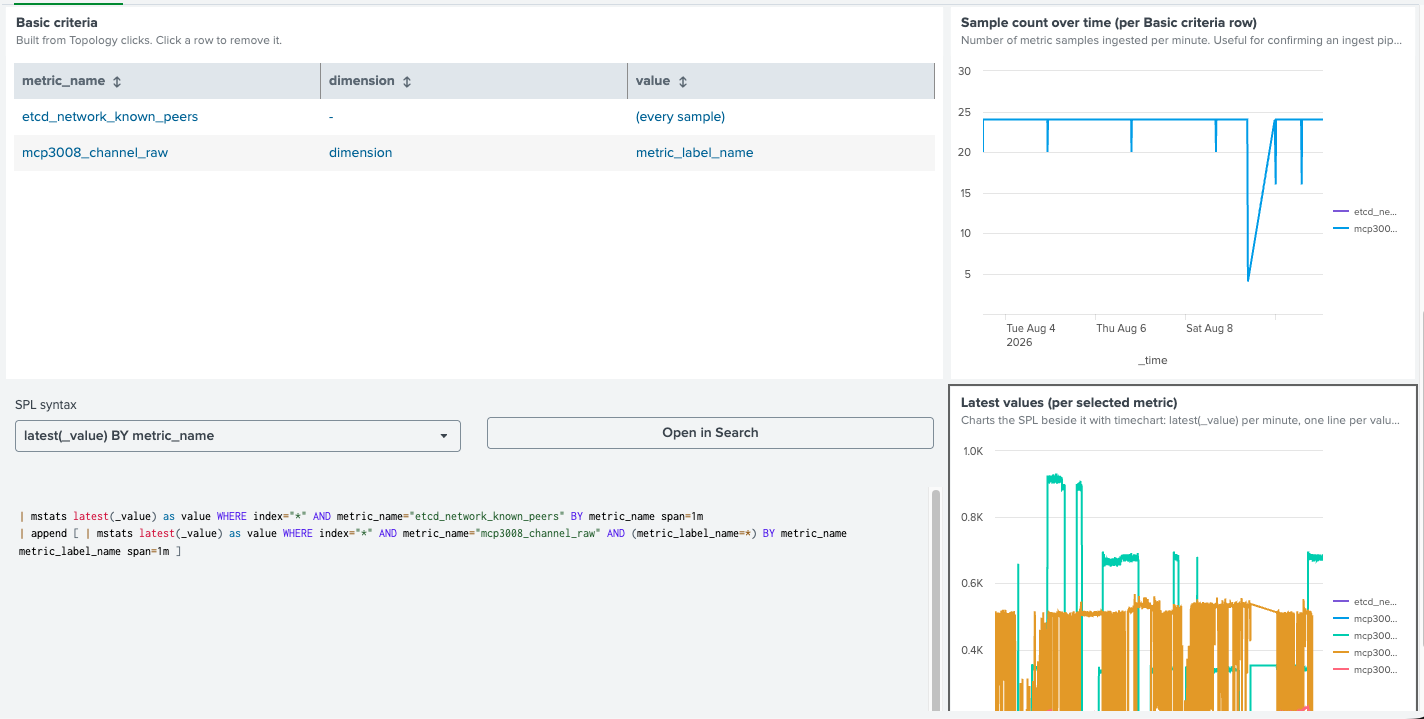
From the criteria list, several panels populate to show you how your data looks. On the top right, there’s a sample count, again just to confirm that the data is flowing as you expect. On the bottom right, there’s a chart showing the metric values, to help confirm that the data you’re looking for is actually what you’ve found.
On the bottom left is a sample search for the metrics and dimensions you’ve selected, ready to open directly in search or drop into the Outcold Solutions AI Agent, so you can change aggregations, do more statistical analysis, or whatever else you might need, with the full power of SPL.
It’s not meant to be a full replacement for the capabilities of Analytics Workspace, but it handles the main feature we needed - being able to see and search all of your metrics to find the right one. It’s simple, straightforward, is entirely self-contained in a Splunk dashboard… and now it’s open-source, too!
We’ve released the Metrics Explorer to the Splunk community as an open-source tool, so everyone can find the data they need. The source code and packages releases are on the Metrics Explorer GitHub page, and a Splunkbase listing is currently pending review.
If you find Metrics Explorer useful, and especially if you want it to have a particular feature, reach out to Scott Raiford on the Splunk Community Slack, and let us know!