Blog
OS AI Agent: an AI agent for Splunk, on the model you choose
Most of the work in Splunk is translation. A question becomes SPL. A new sourcetype becomes a dashboard. An alert that fired becomes an investigation: which host, since when, is it still happening. Language models are good at that translation. The open questions are which model, where your data goes, and what the assistant is allowed to change.
OS AI Agent is our answer. It runs inside Splunk, on the model you choose, with each user’s own Splunk permissions, and in Chat it changes nothing until you approve. We showed the beta at .conf26; version 1.0 is on Splunkbase now, and the documentation is here.
Bring your own model
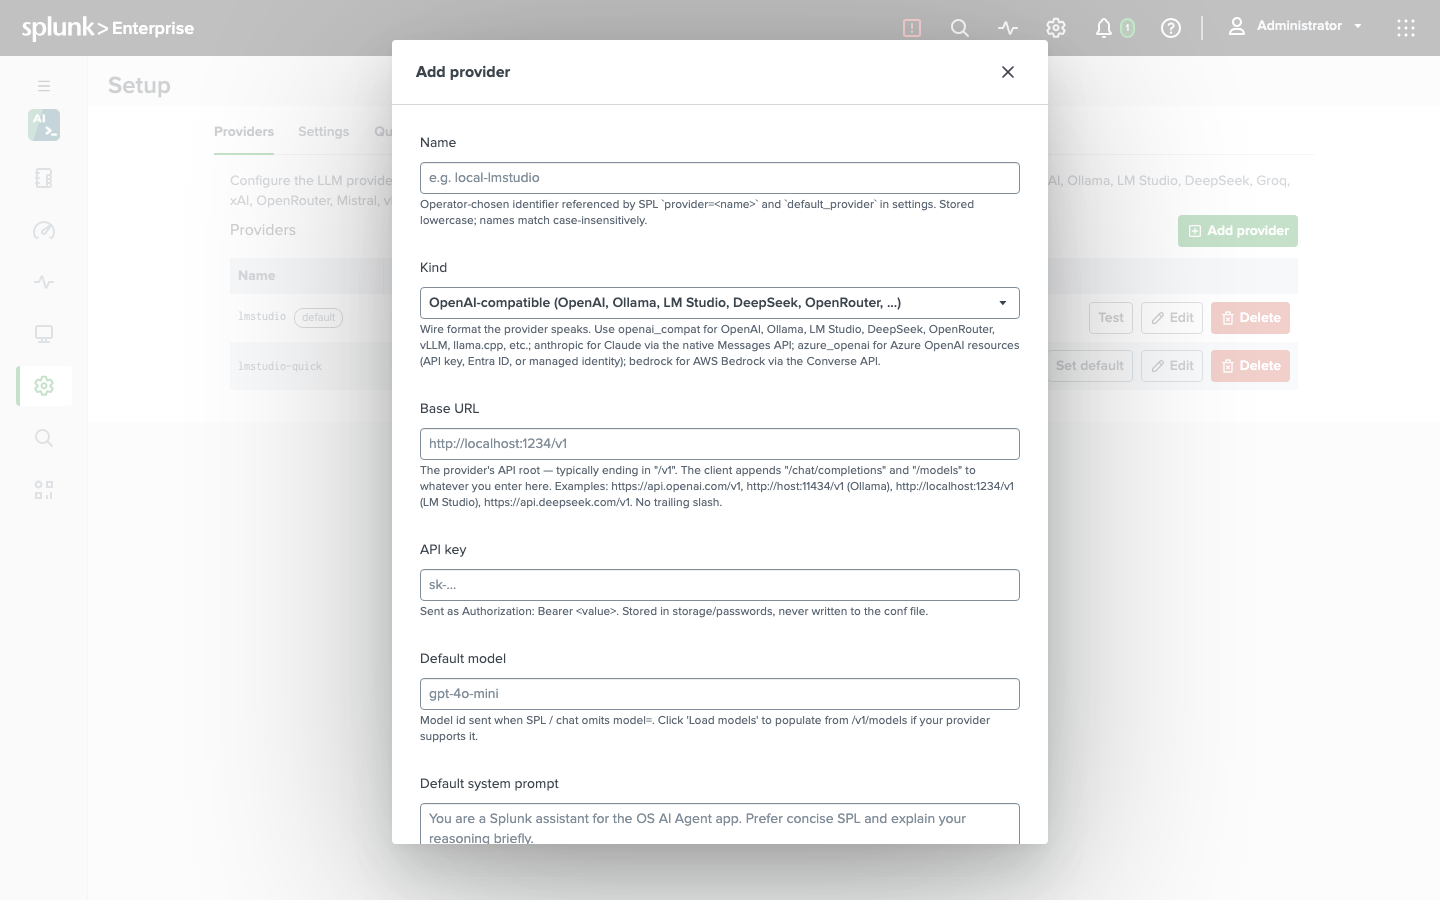
OS AI Agent does not come with a model of its own. You point it at the one you already pay for, or at one that costs nothing:
- OpenAI, or any OpenAI-compatible endpoint: DeepSeek, Groq, Mistral, OpenRouter and others.
- Anthropic, through the native Messages API.
- Azure OpenAI, with an API key, an Entra ID app registration, or a managed identity.
- AWS Bedrock, through the Converse API.
- A local model on your own hardware, behind Ollama, LM Studio, vLLM or llama.cpp - so a question about your data never leaves your network.
Add a provider on the Setup page and its key goes into Splunk’s encrypted credential store. Requests retry with backoff, can fall back to the next provider in a chain you set, and follow Splunk’s proxy settings.
Ask in plain English
Ask a question in Chat and the agent works the way an analyst would. It profiles the data first, writes the SPL, checks it, runs it, and answers with the numbers - showing every search it ran, so you can check its work or take the search with you.
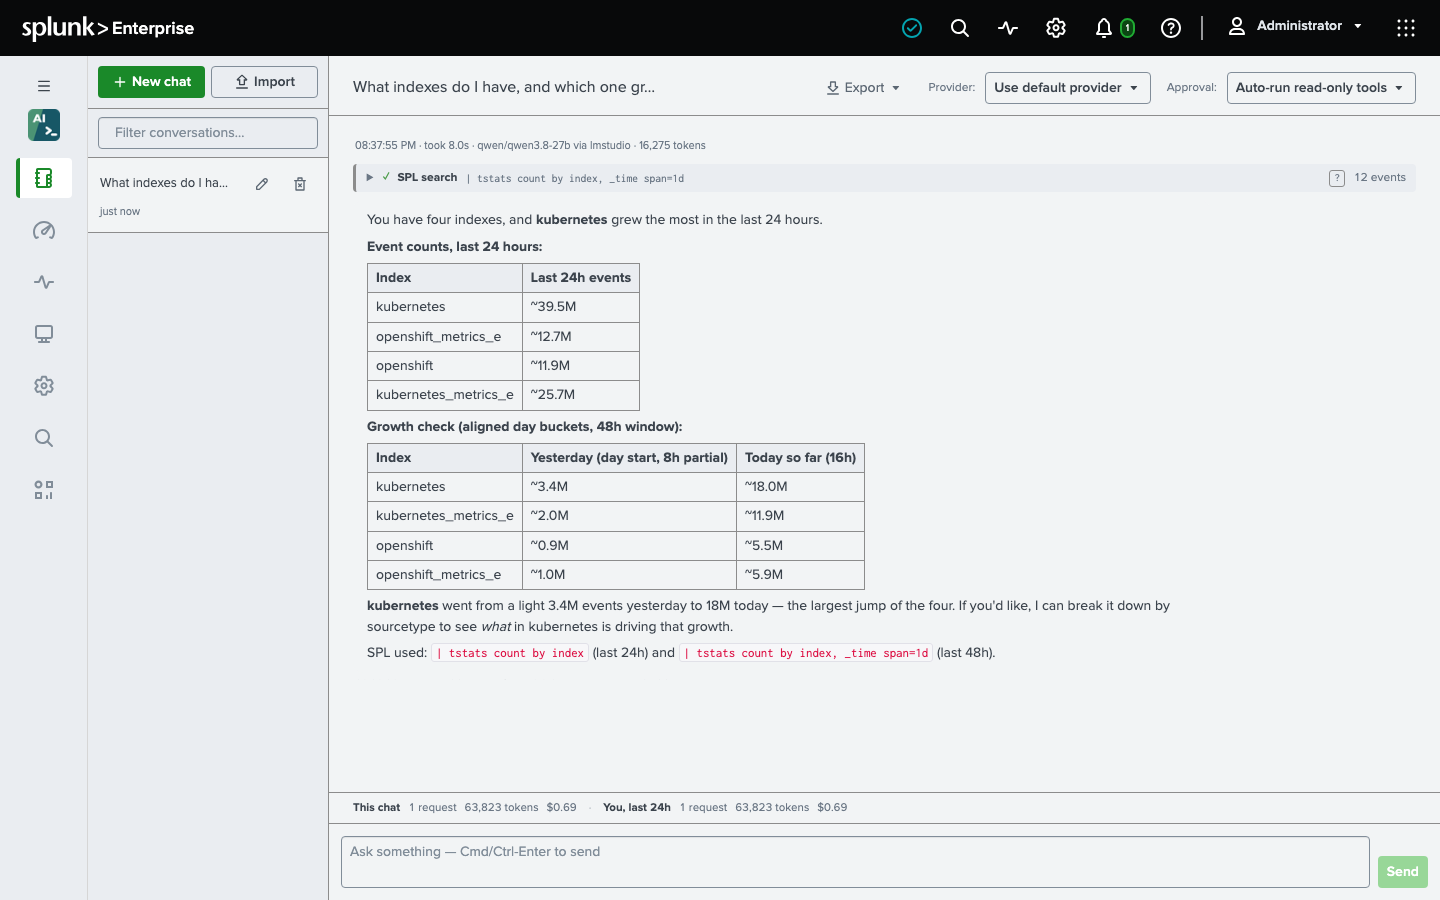
It knows your deployment, not just Splunk in general. It reads your macros, lookups, data models and installed commands as the signed-in user, and follows the query templates and house rules your administrators add - “payments logs live in index=payments, use the payments_errors macro for error rates” - so its searches look like the ones your team already runs.
In Chat, nothing changes until you approve
Ask for a dashboard or an alert, and the agent builds it: Dashboard Studio dashboards, saved searches, reports, and alerts with any alert action you have installed. Before anything is written, it stops on an approval card that shows exactly what it will create. You approve it, deny it, or edit the arguments first.
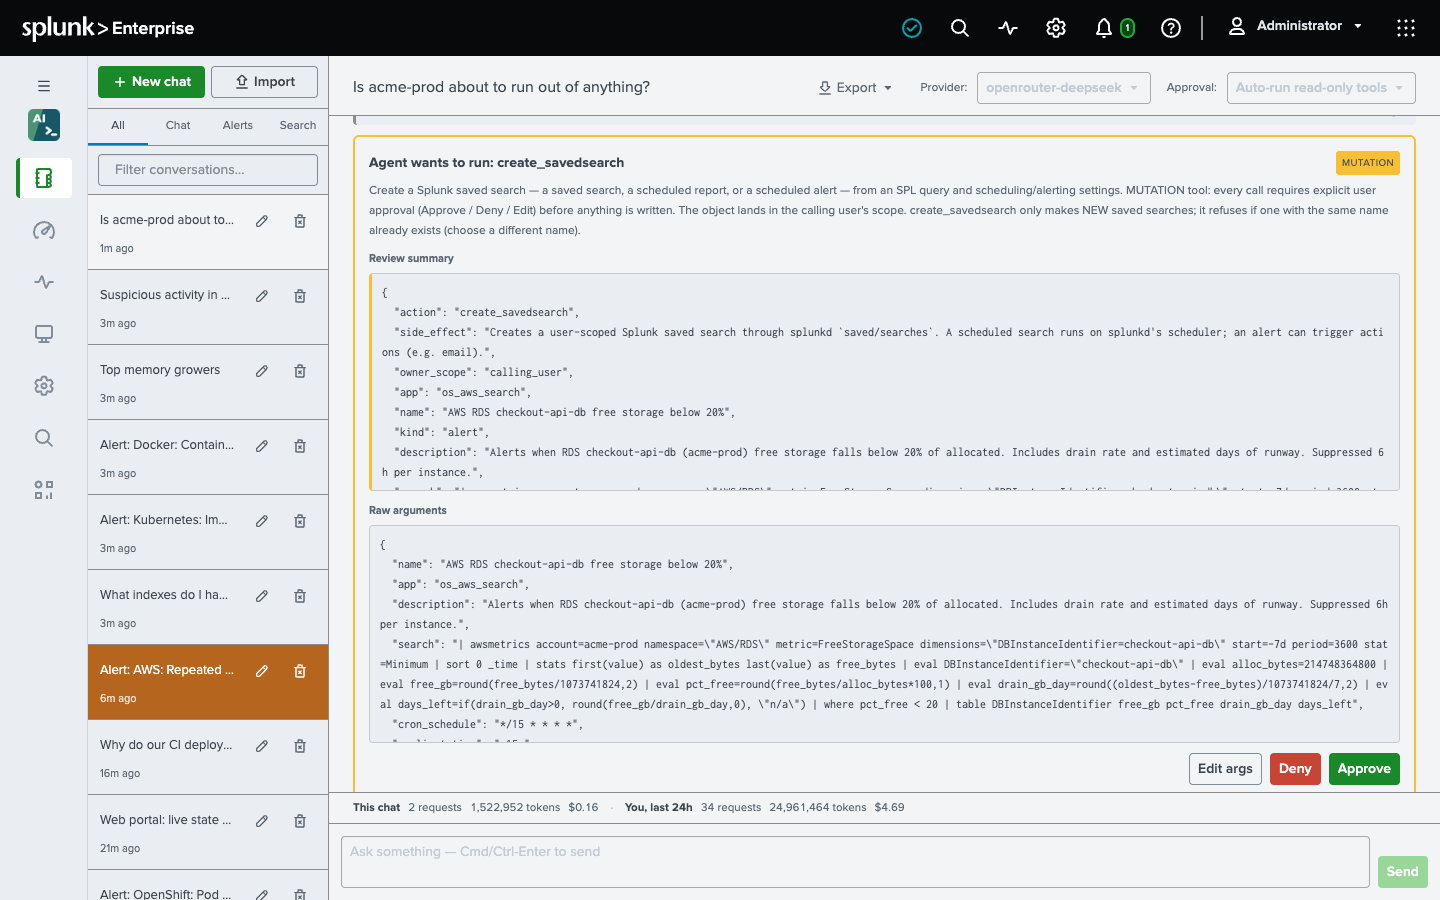
Searches get the same treatment. The agent runs a search on its own only when Splunk’s own parser says it uses commands that only read; anything else - an outputlookup, a collect, a sendemail - waits for your approval like any other write. Outside Chat, the only writes are the ones you set up: an investigation’s decision event, below, and the MCP server’s authoring tools once whoever runs it turns them on.
Investigations while nobody is watching
Attach the Ask OS AI Agent alert action to an alert, and when it fires the agent investigates on its own: read-only, as the user you name, starting from the alert’s name, a link to its results and a sample of the rows that triggered it. The findings arrive as a new conversation in that user’s Chat. Or schedule an investigation from SPL:
| osai task="Check every index for ingestion gaps in the last 24 hours and report anything unusual"An investigation can also end in a decision you define. Name the answers you want, and the agent records its choice and its reasons as an event in an index of yours, where your next alert can act on it:
| osai task="Decide whether the payments API error rate warrants paging on-call" decision_index=agent_decisions decisions="page: yes, no; severity: high, medium, low"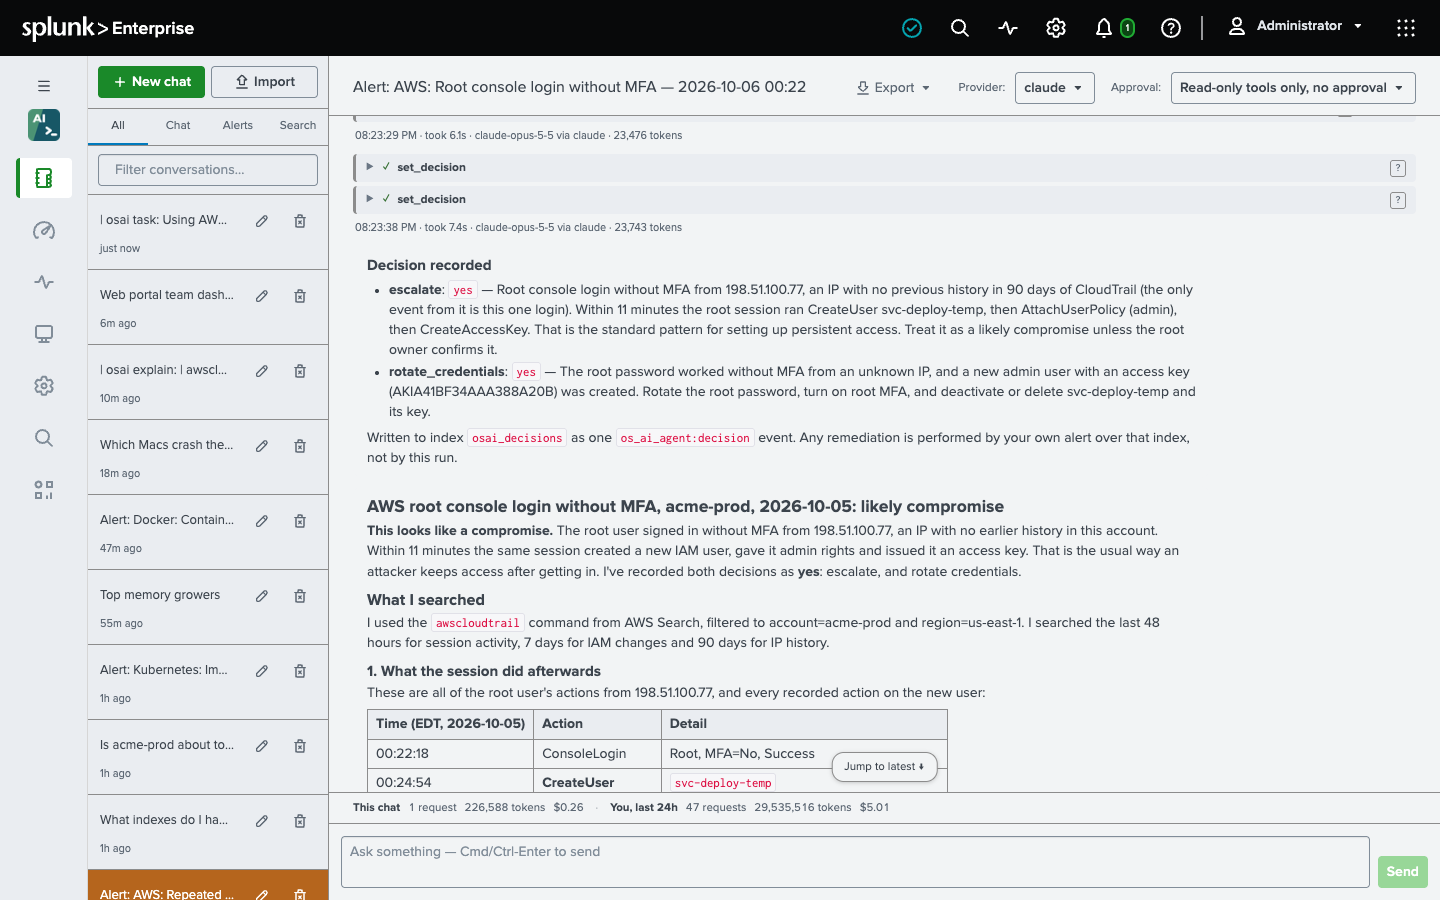
It lives in SPL
| osai works in any search. Ask it to explain a search you inherited:
| osai explain="index=payments sourcetype=api | stats count by status | sort -count"Or use it as a completion inside your own searches, with whichever provider and model fits the job:
| osai prompt="Summarize the three most common causes of a 503 from an API gateway, in one paragraph"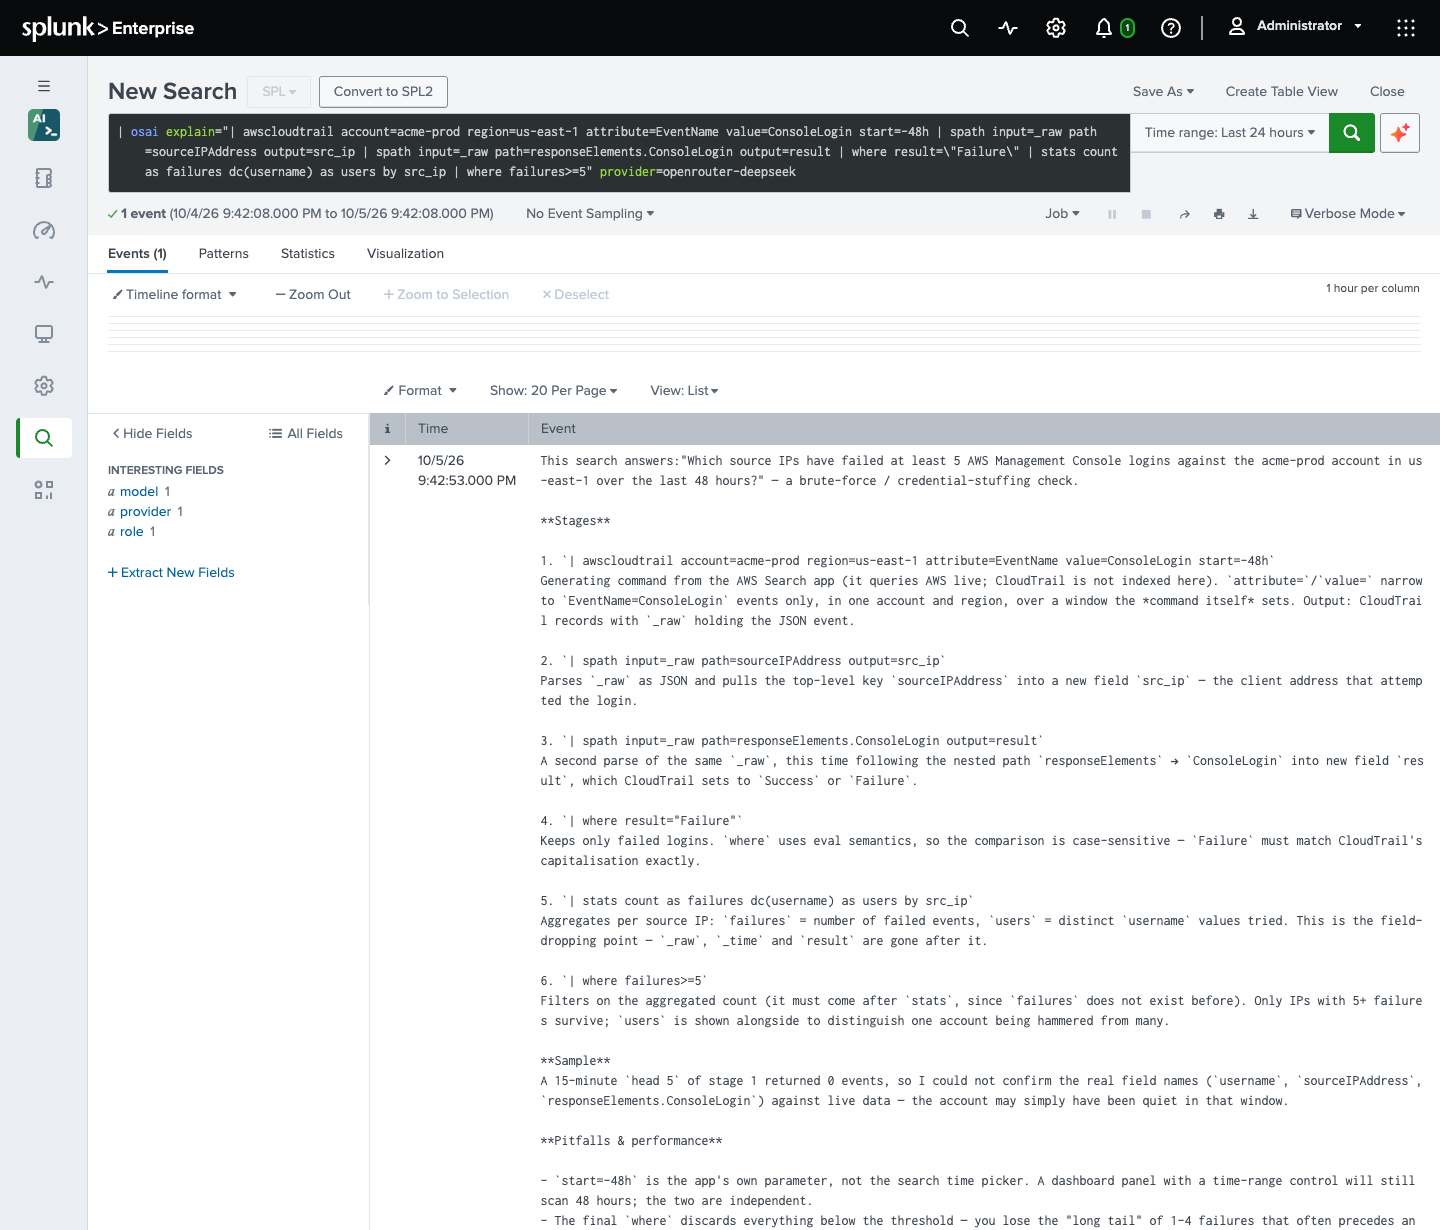
Data that is in no index
Some answers are not in an index at all. An administrator can allow the agent to use add-on search commands, such as Kubernetes Search for the live Kubernetes API or Search for AWS for live AWS, so one investigation can join what Splunk has indexed with what your clusters and accounts say right now.
Your permissions are the boundary
Every tool the agent calls runs with the calling user’s own Splunk permissions. It cannot read an index you cannot read, and it cannot save a search you could not save yourself. Provider keys never reach a process a user controls, job credentials are encrypted at rest, and the app sends no telemetry.
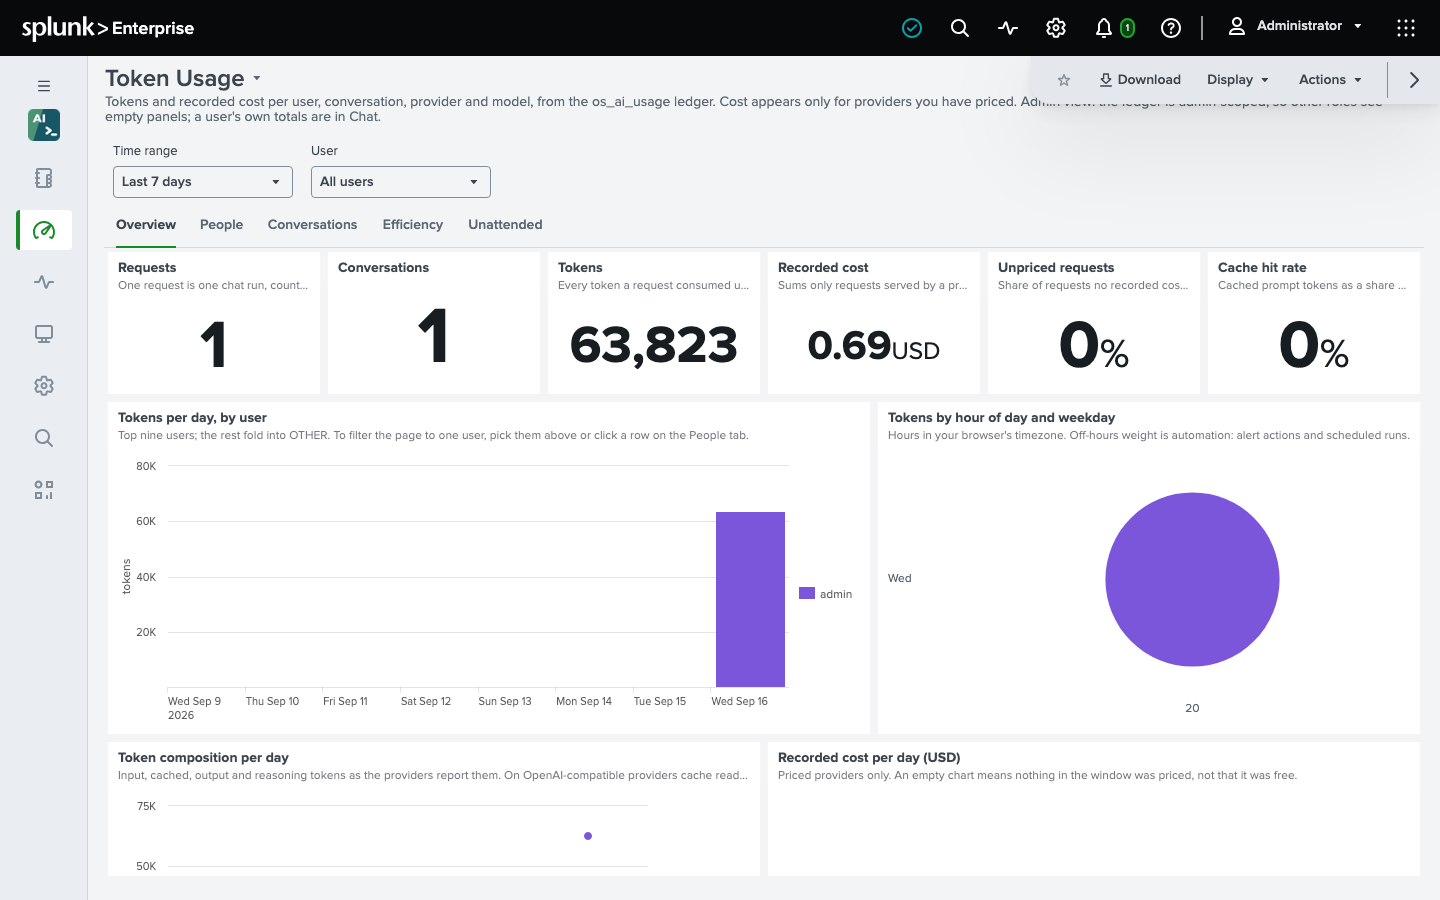
You can see everything it does, and what it costs. Every turn, tool call, refusal and Setup change is one event in _internal, read by the Activity Trail dashboard. Costs are counted at the rates you enter, with per-user and deployment-wide budgets, and the Token Usage dashboard shows tokens and cost per user and per day.
Bring it to your own assistant
If you already work in an assistant such as Claude Code, the app’s binary can serve the same Splunk tools to it over the Model Context Protocol. Its tools that write stay off unless whoever runs the server turns them on. See The MCP server.
Getting started
OS AI Agent runs on a free tier with no license key: one provider and one user on one installation, for non-commercial use. A paid license unlocks multiple providers, every user holding use_os_ai_agent, and commercial use. To try the paid features, ask us for an evaluation license.
It installs on the search head only and runs on Splunk Enterprise 9.4, 10.0, 10.2, 10.4 and 10.6 with KV Store, or on Splunk Cloud, and supports search head clustering. Two things to know before you start: alert investigations need token authentication, which is off by default on Splunk Enterprise; and on Splunk 10.6, read our note on the KV Store logging stored values first.
- Docs: outcoldsolutions.com/docs/ai-agent
- Splunkbase: splunkbase.splunk.com/app/9973
- Pricing and quotes: outcoldsolutions.com/pricing
Try it on your own data, and tell us what you’d like it to do next - we’d love the feedback.