Blog
Outcold Solutions at Splunk .conf26 in Denver
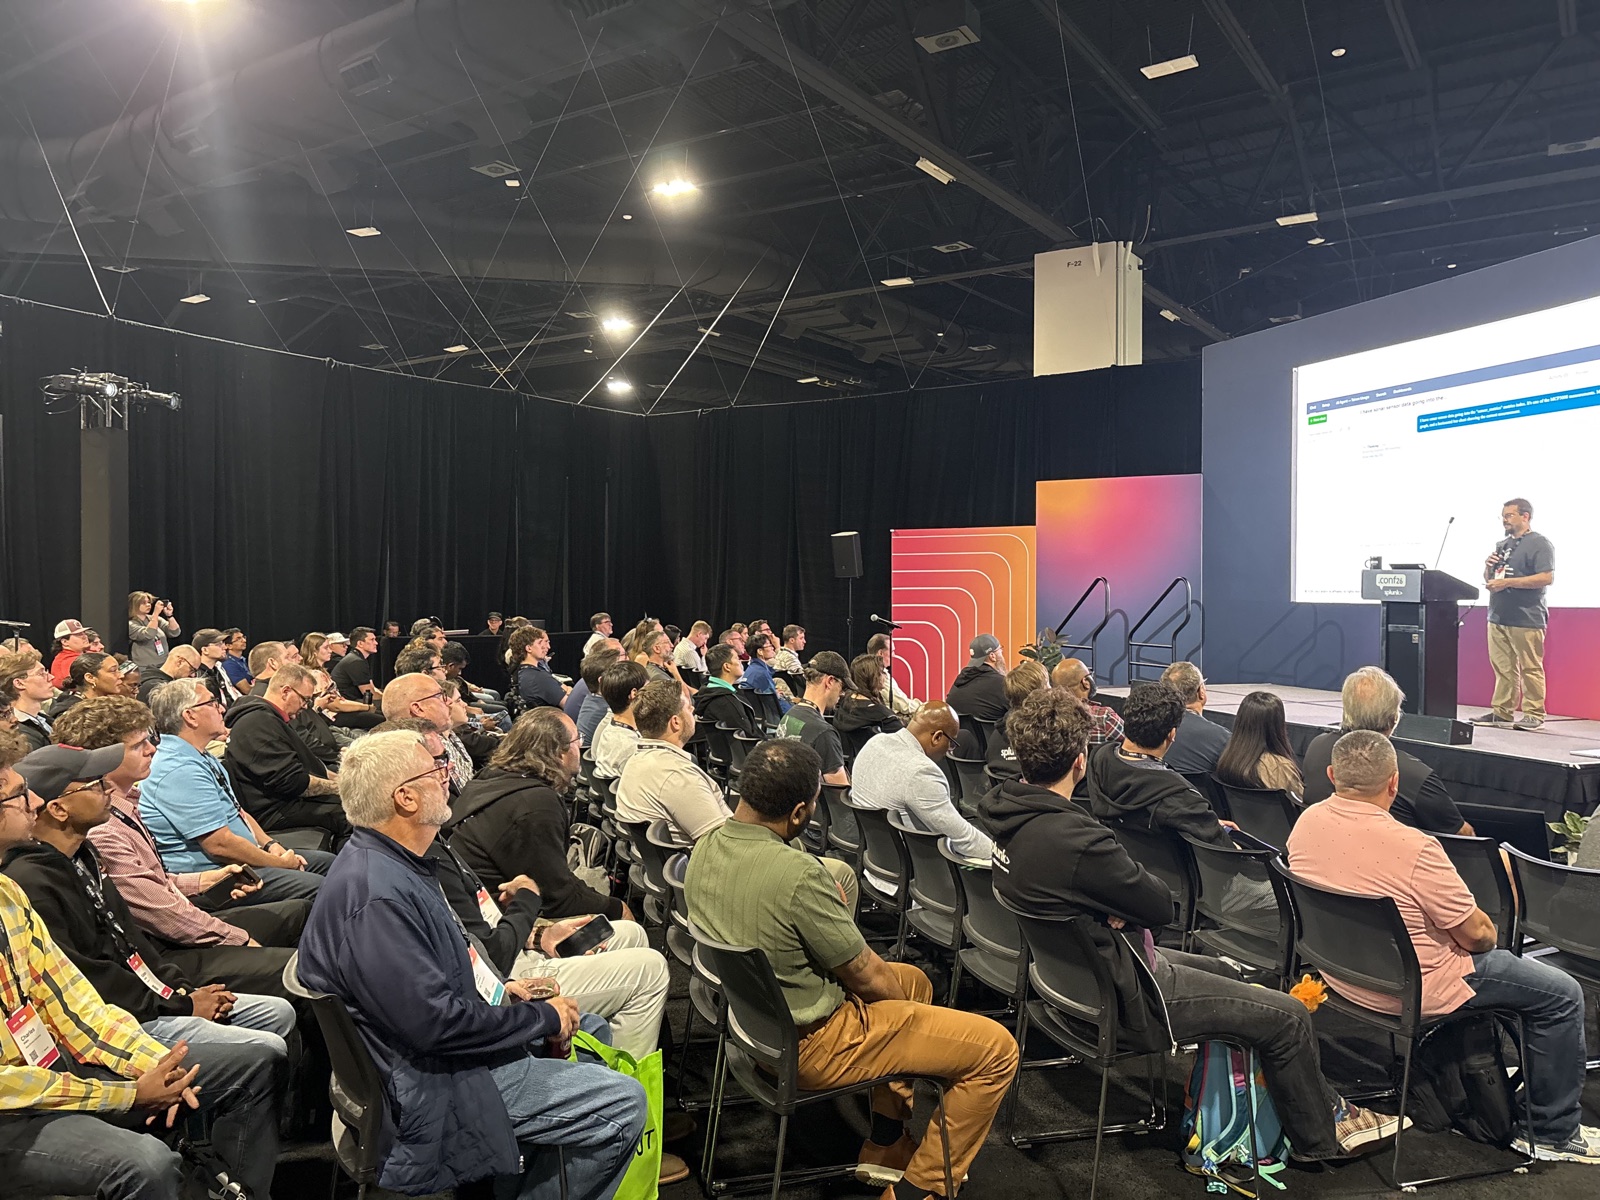
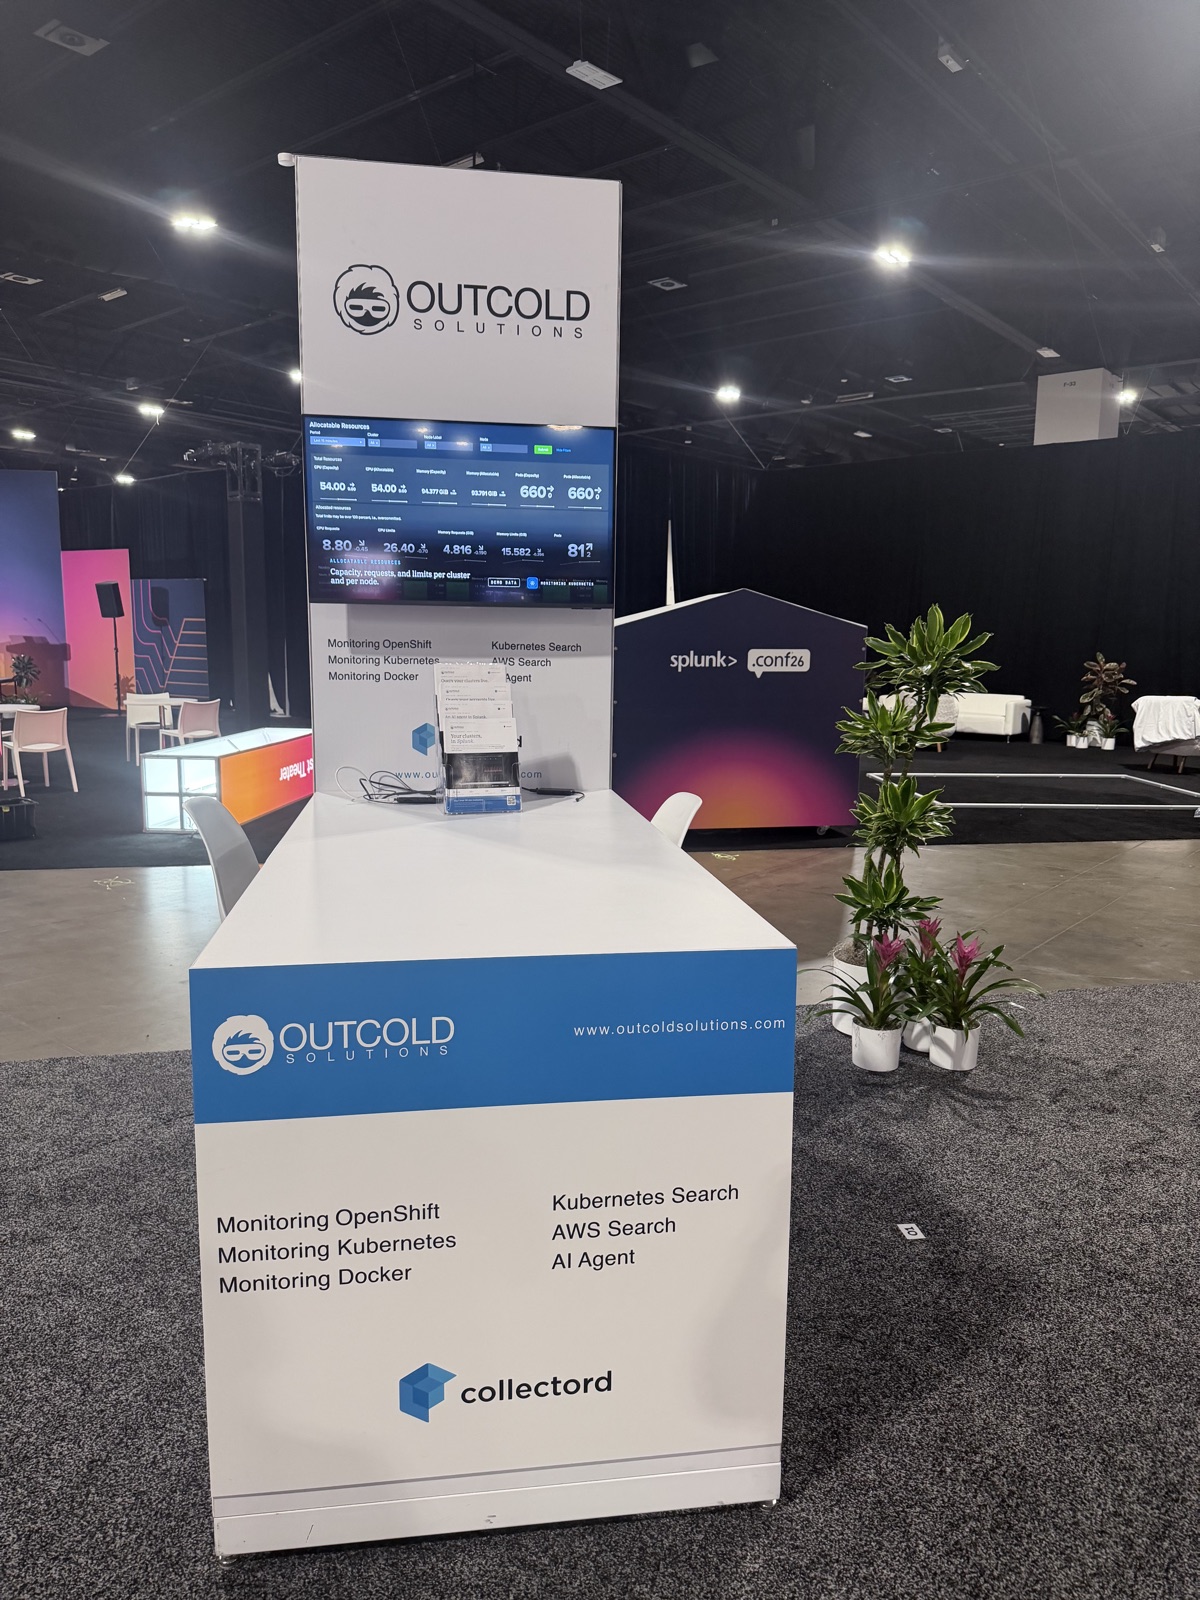
Last week we were in Denver for Splunk .conf26, September 14 to 17 at the Colorado Convention Center, as a sponsor. We had a booth on the expo floor, Scott gave a session on building dashboards with AI, and we sponsored the happy hour on Tuesday. Thank you to everyone who stopped by: the questions were sharp, the conversations were long, and a good number of you had been running Collectord for years and came to see what is next.
This post is the recap for those who asked for one, and for those who could not make it.
What we showed at the booth
Three things sat on the booth: the next release of the monitoring apps, one new product that is already on Splunkbase, and two that are in beta.
Monitoring Kubernetes, OpenShift and Docker 26.10
The 26.10 release of Collectord and the three monitoring apps ships in October, and it has been in the works for a while. Three of the longest-standing requests turned out to be one piece of work. Sending metrics to a Splunk metrics index meant rewriting every dashboard that reads them. Rewriting the dashboards was the moment to make them about what needs action rather than inventory, which many of you had asked for. And alerts that a team can scope to its own clusters, and on Kubernetes and OpenShift to its own namespaces, another long ask, meant rewriting the alerts as well. Rather than ship the pieces one at a time, we waited until all of it was done and could land together. These are the parts we demoed:
- The app opens on a verdict. The Overview of Monitoring Kubernetes and Monitoring OpenShift is rebuilt around health rather than inventory. It opens with one verdict for the fleet - Healthy, Warning, Critical, or Unknown when the data to decide is missing - and the numbers behind it: clusters gone silent, nodes not ready, pods needing attention, crash loops, warning events in the period, and Collectord’s own problems. The Workloads menu folds into it as tabs.
- An Alert Catalog. The apps ship 94, 92 and 25 alert templates for Kubernetes, OpenShift and Docker, grouped by who acts on them - Splunk admins, the platform team, security, application teams. You scope a template to clusters, and on Kubernetes and OpenShift to namespaces, set its thresholds, and create it as a saved search. The shipped alerts of previous releases are deprecated in favour of the catalog.
- Metrics into a Splunk metrics index. Every metrics-producing input can send events, metrics-index records, or both at once, so you can switch dashboards over without a gap. The catalog’s templates carry a metrics-index body wherever the data can go there.
- One DaemonSet on every node. The separate control-plane DaemonSet is gone. The one DaemonSet tolerates every taint, and the control-plane scrapes find their components as pods, by label, so the same configuration works across distributions.
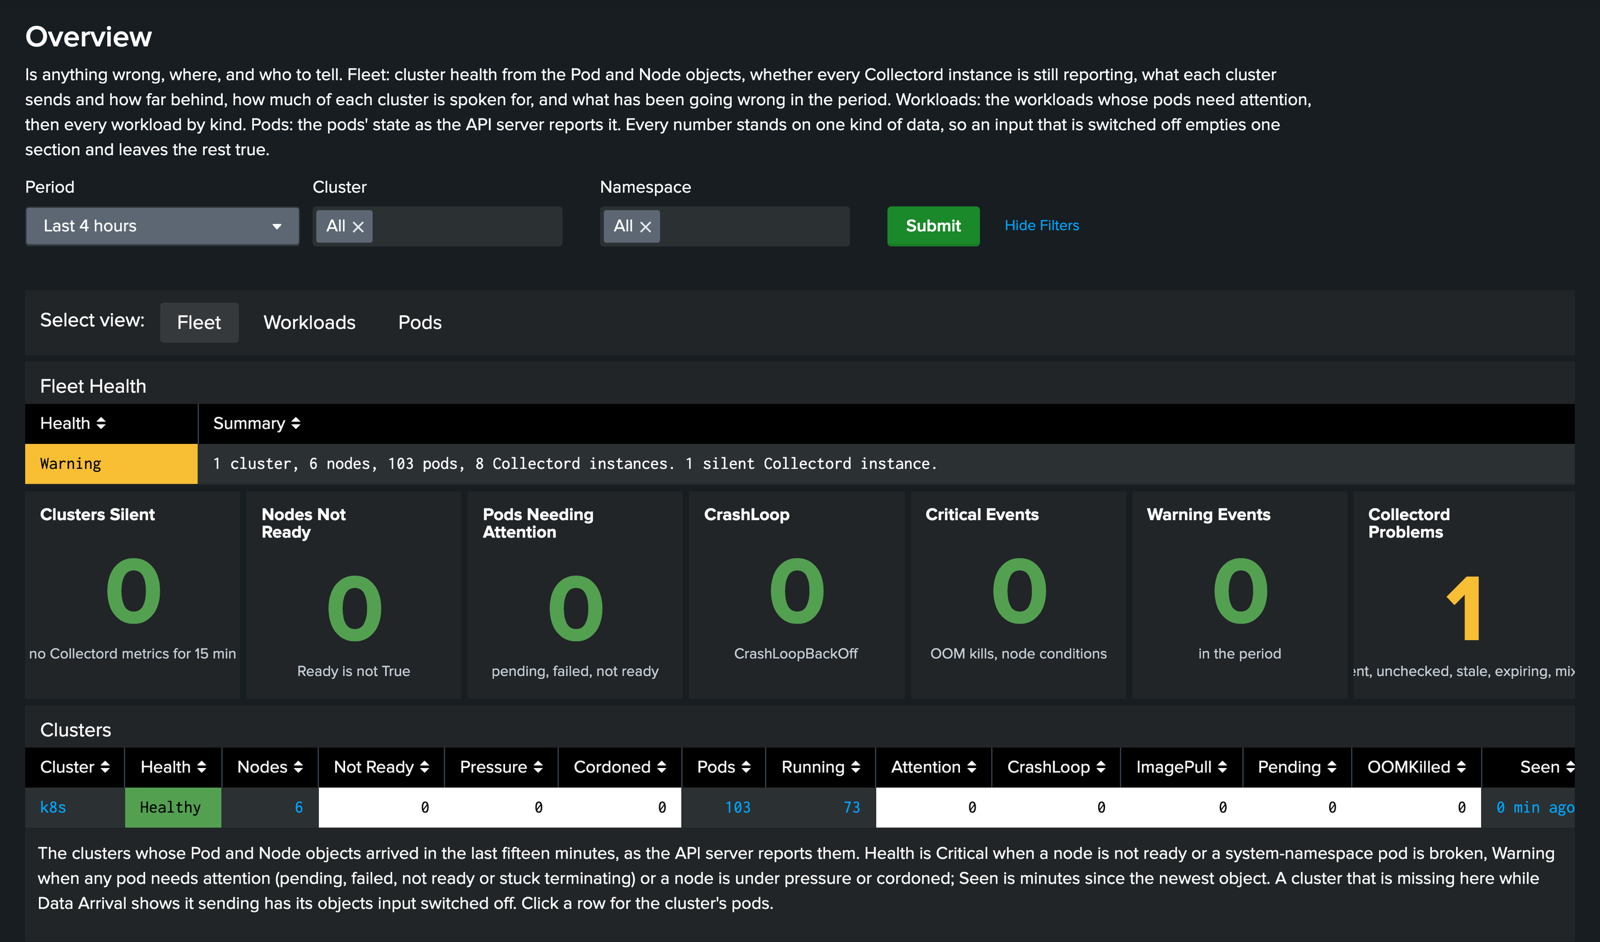
The Overview in 26.10 opens on one verdict for the fleet and the numbers behind it. Every tile is a green zero when there is nothing to report.
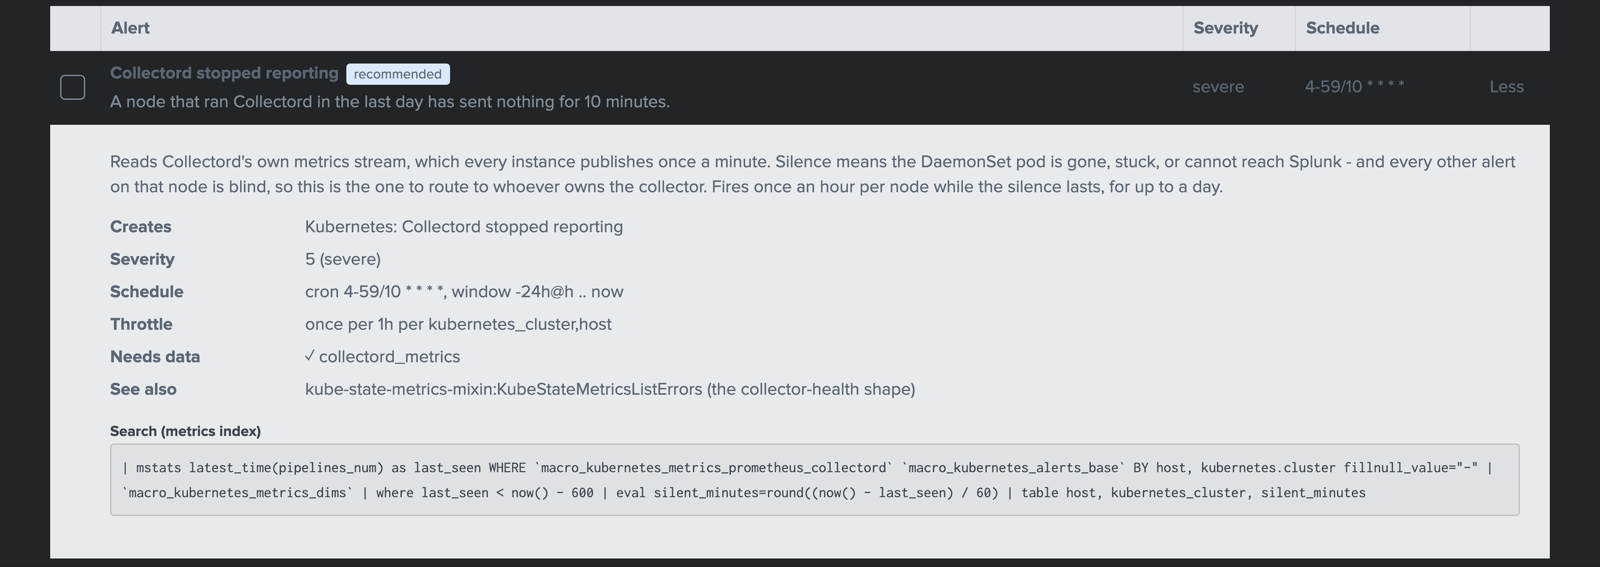
One template from the Alert Catalog, expanded: what it reads, how often it fires, what it needs, and the search behind it in its metrics-index form. Pick the templates a team needs, scope them to its clusters and namespaces, and create them as saved searches.
The release post in October will carry the full list.
Kubernetes Search, on Splunkbase now
Kubernetes Search is the live Kubernetes API from the Splunk search bar. | k8s kind=pods namespace=payments context=* lists the pods of one namespace across every cluster you registered, | k8slogs namespace=payments pods=* streams their logs, and the Events and Networking & Storage dashboards read the cluster as it is right now - no agent in the cluster, no ingestion, no extra index storage. It is a different question from the one the monitoring apps answer, and it is why the two are separate products: the monitoring apps tell you what happened over the last hour, Kubernetes Search tells you whether the pod is still crash-looping this second. It is on Splunkbase today.
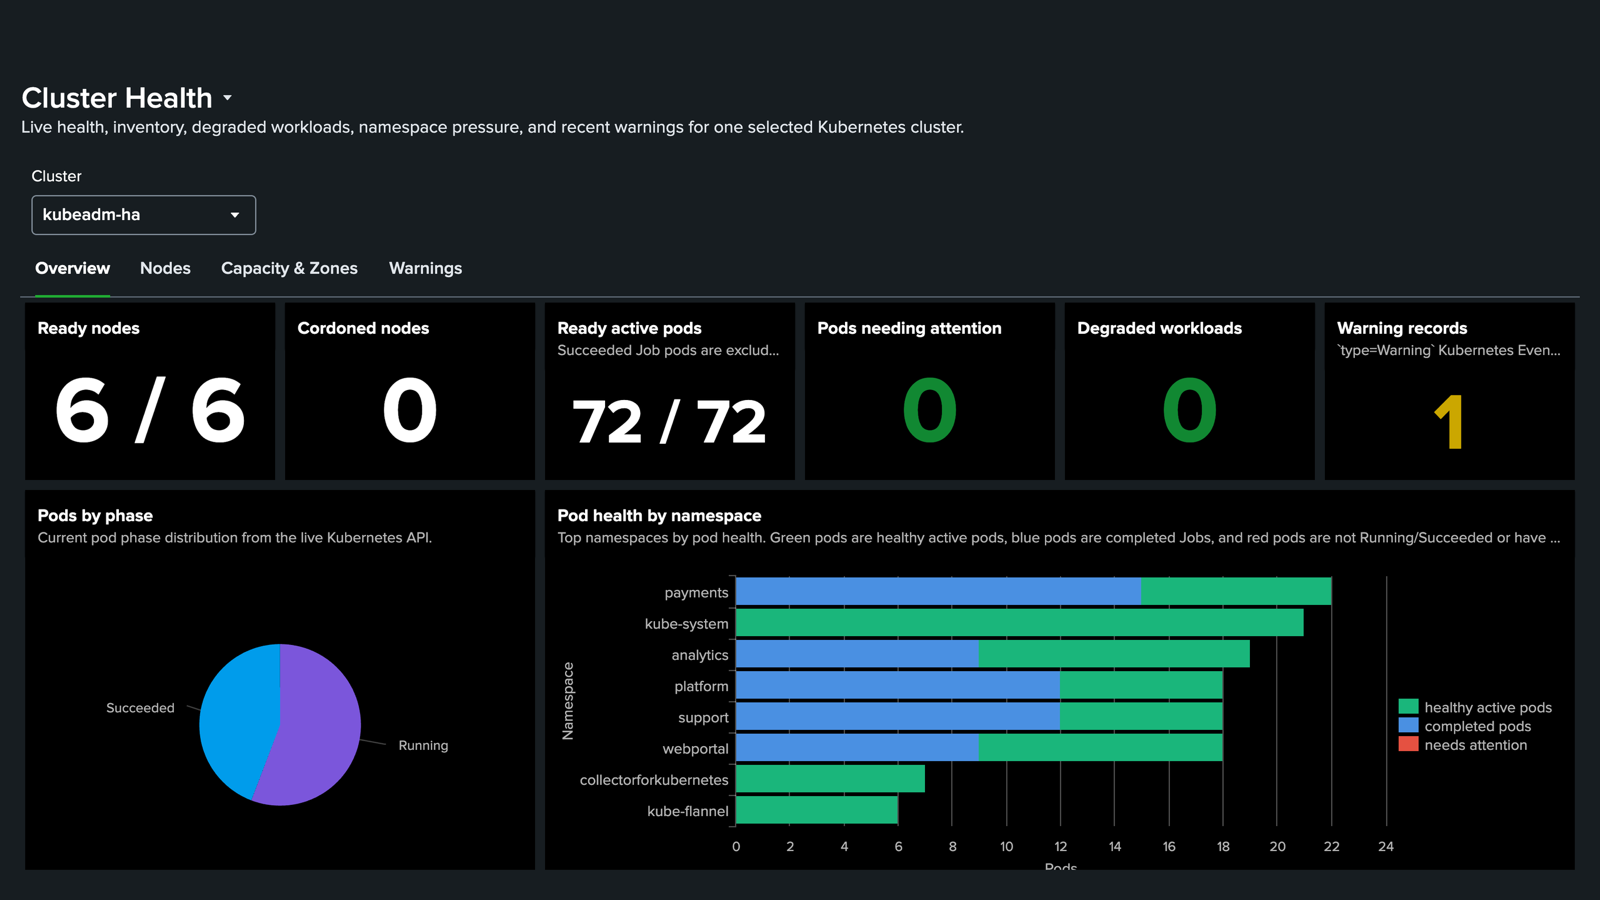
Cluster Health in Kubernetes Search, read from the live API at the moment the page loads.
Search for AWS, in beta
Search for AWS - AWS Search on the booth sign - is the same idea pointed at AWS: query the live AWS APIs from Splunk with nothing ingested. | awsget lists resources of any kind over Cloud Control and takes any CloudFormation type name, so a resource type AWS adds next year works without a new release of the app; | awslogs and | awsmetrics read CloudWatch, | awscloudtrail looks up management events, | awscost pulls Cost Explorer, | awsathena runs Athena queries, and | awsglue reads the Glue catalog, across every account and region you register. It is not on Splunkbase yet. The beta, with a license for it, is available on request: write to sales@outcoldsolutions.com.
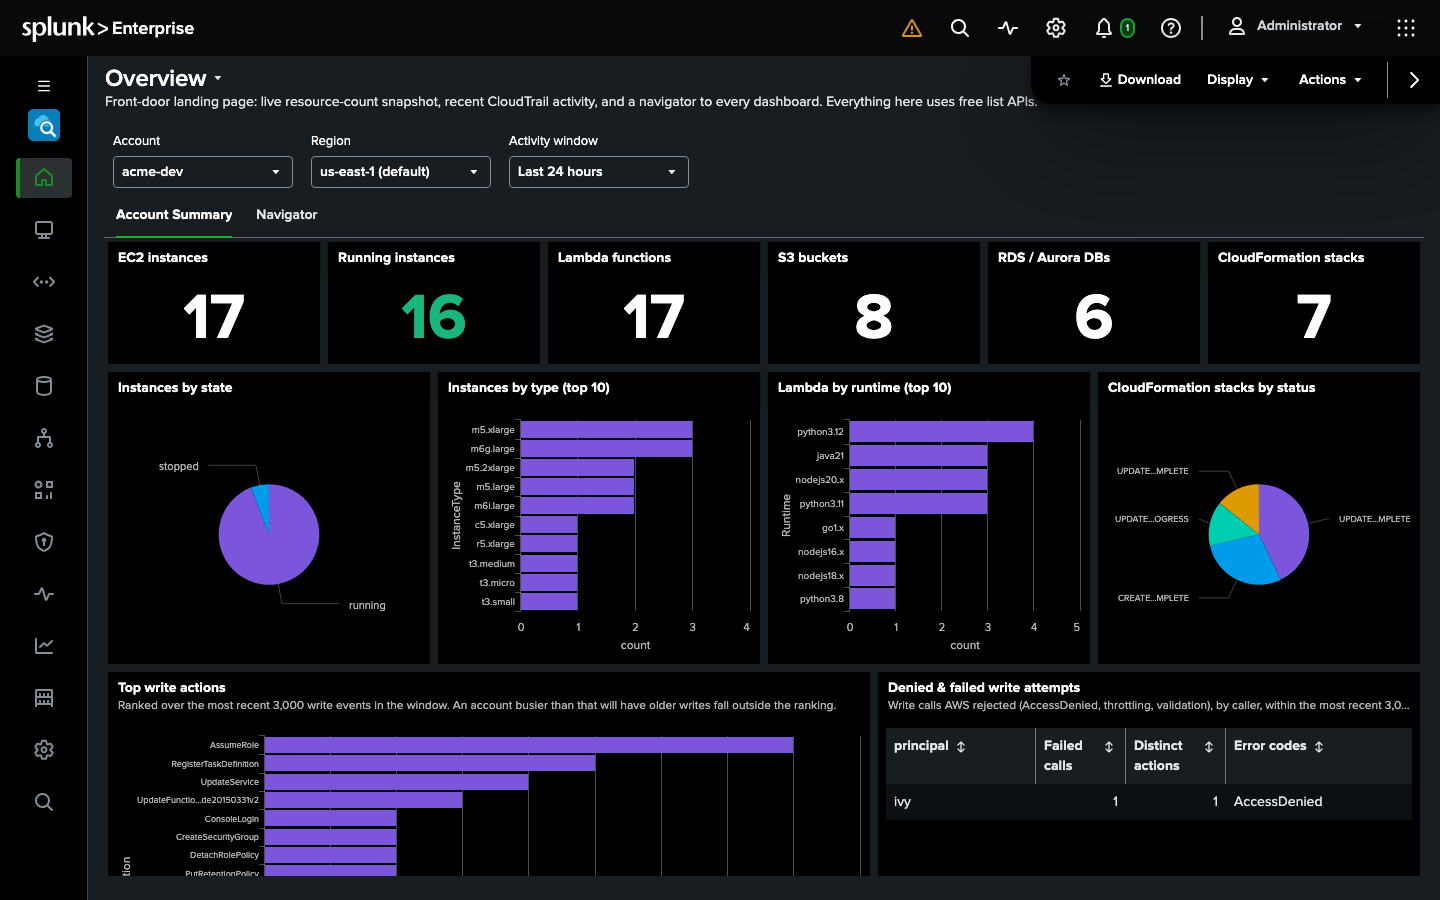
The Search for AWS Overview: a live resource snapshot and recent CloudTrail activity for one account and region, from free list APIs.
OS AI Agent, in beta
OS AI Agent - the AI Agent on the booth sign - is a vendor-agnostic AI assistant that runs inside Splunk. Bring your own model - OpenAI, Anthropic, Azure OpenAI, AWS Bedrock, or a local model behind an OpenAI-compatible endpoint such as Ollama, LM Studio, or vLLM - and it profiles your data, writes and verifies SPL, reads your macros and data models, and builds dashboards and alerts that pause for your approval before anything is written. Chat with it, call it from SPL with | osai, or let it investigate an alert while nobody is watching. Every action runs with the calling user’s own Splunk permissions. It is the agent Scott used on stage, and the beta is open through the same address.
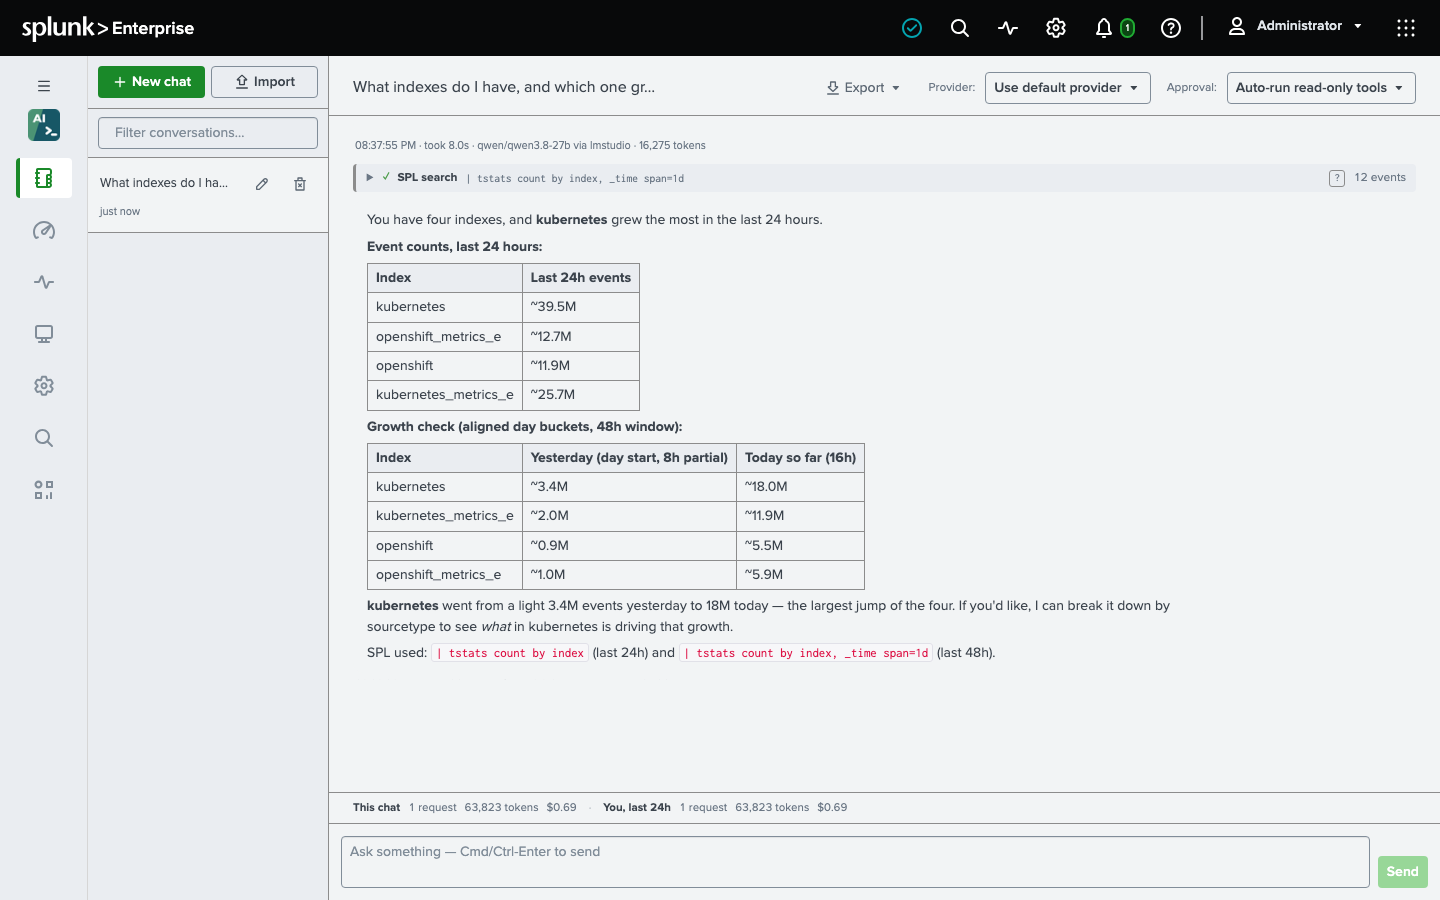
The OS AI Agent chat, here on a local model: the question, the SPL it ran and verified, and the answer with the numbers behind it.
Scott’s session: Turning Data into Doing with Day-1 Dashboards
The room was full, and the argument was simple: the day data lands in Splunk is the day you should have a dashboard for it. Waiting a quarter for the dashboard project to be scheduled is how data sits in an index unused. Scott showed the path from a fresh sourcetype to a working dashboard on day one, with the OS AI Agent profiling the data and drafting the searches and the dashboard definition, pausing for approval before anything is written, and a person deciding what stays, what the thresholds are, and what the dashboard is for.
If you were in the session and want the same agent against your own Splunk, the beta is open.
The happy hour
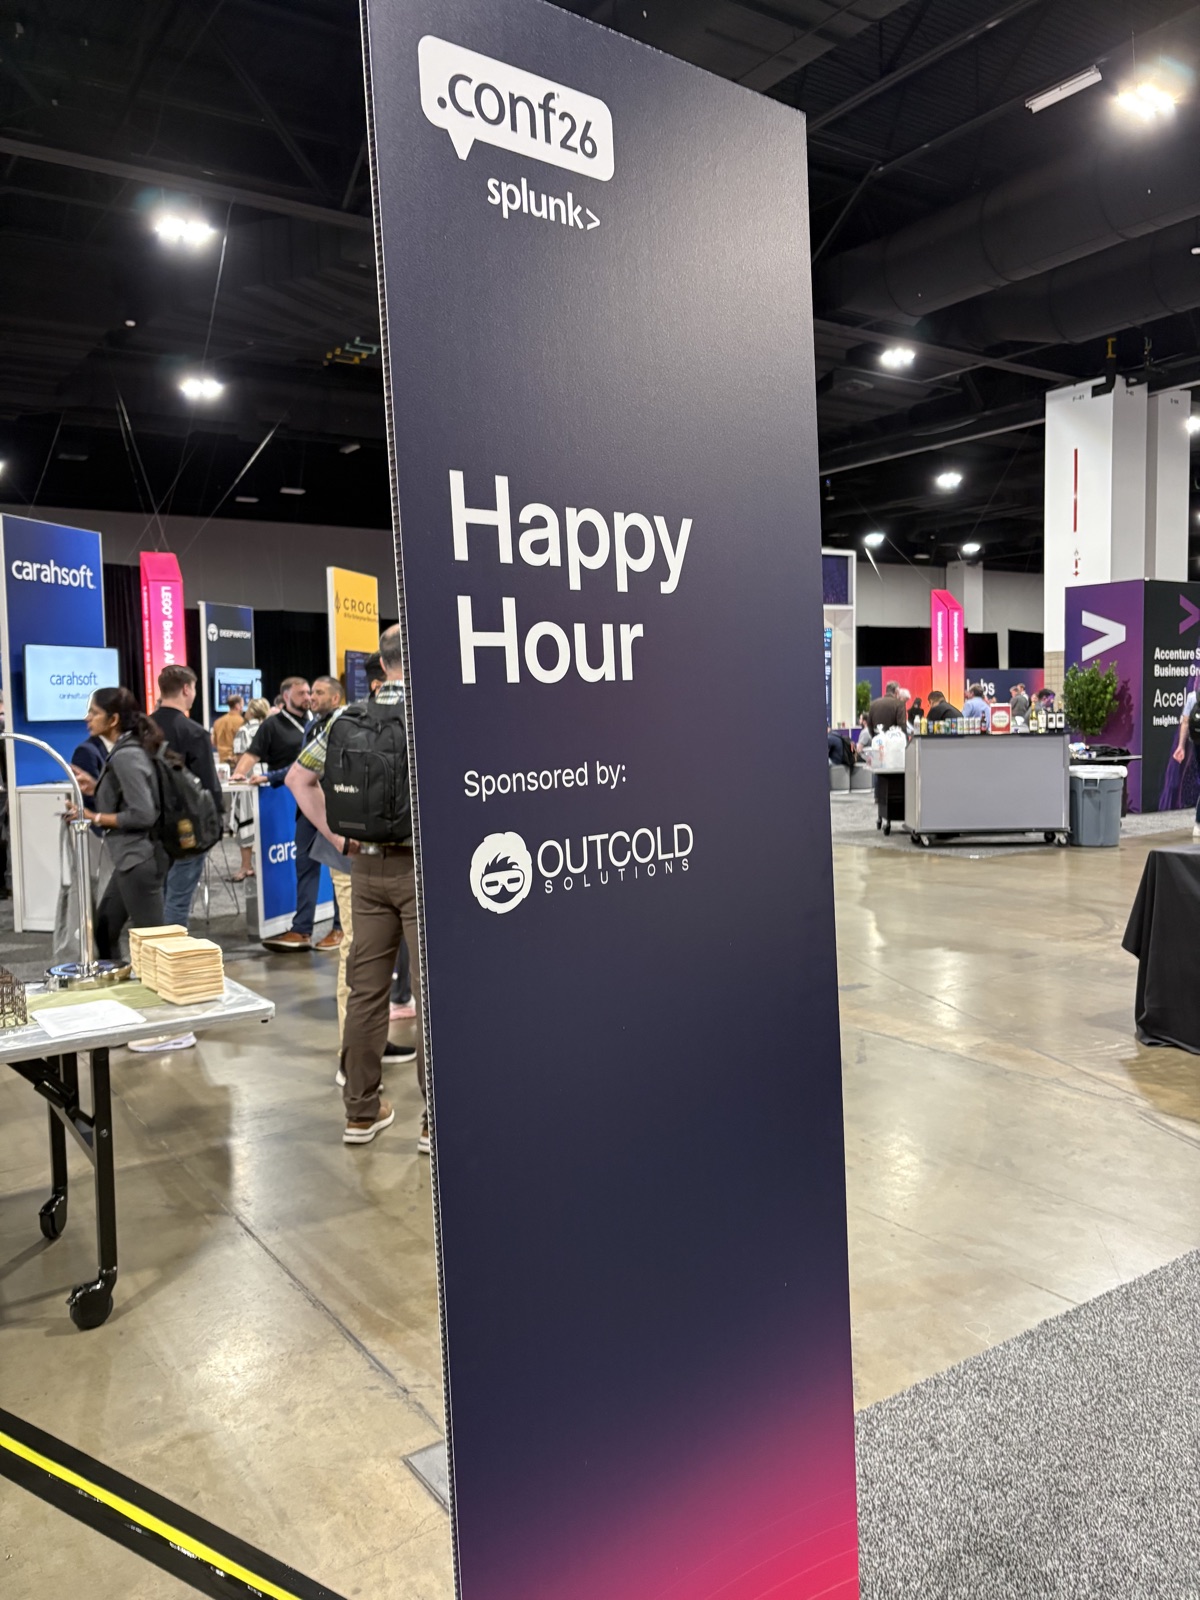
We sponsored the Tuesday happy hour on the expo floor. It turned out to be the best hour of conversations of the week, so if we met you there and you are reading this, thank you.
What we heard
A few questions came up often enough to answer here:
- “How does this compare to the OpenTelemetry Collector?” We wrote it up last month, task by task: Collectord vs the OpenTelemetry Collector for Kubernetes logs in Splunk. Short version: if the job is Kubernetes telemetry into Splunk, a purpose-built agent is simpler to run; if you need traces or several OTLP backends, run the OTel Collector for those, and the two coexist.
- “Does it run offline?” Yes, with one thing to ask us for. Images mirror to your own registry, and a license server inside the enclave hands the key to every cluster. The default license, though, verifies against our license server over the internet, so an air-gapped deployment needs a license issued without that verification, which we provide on request. The FIPS image is the same agent with the Go FIPS 140 module.
- “What does the security team get out of it?” More of you were on the security side than the platform side this year. The answer is the Kubernetes audit log and the object inventory in Splunk next to the container logs, and masking of sensitive values before an event leaves the cluster.
- “We are moving to Splunk. Where do we start?” With the data that has dashboards waiting for it. Kubernetes container logs, metrics and events through Collectord land with the monitoring app’s dashboards and the Alert Catalog on day one.
What happens next
- 26.10 ships in October. The release post will have the full notes. Subscribe if you want it in your inbox.
- Try the monitoring apps. Request an evaluation license and 26.10 will land on a cluster you already have wired up.
- Install Kubernetes Search from Splunkbase and register a cluster; the docs are short.
- Join a beta. Search for AWS and the OS AI Agent are available on request, with a license for the beta: sales@outcoldsolutions.com.
See you at .conf27.