Blog
Kubernetes Search: query your clusters live from the Splunk search bar
There are two kinds of Kubernetes questions. What happened over the last hour? is a question for ingested data - logs and metrics already sitting in a Splunk index. What is true in my cluster right now? - is that pod still crash-looping, what do its events say, is the node Ready - is a question for the live API. Until now, answering the second kind meant leaving Splunk for a terminal and holding cluster credentials.
Kubernetes Search answers it from inside Splunk. It’s kubectl, reimagined as SPL: list resources, stream pod logs, read events, and describe objects across every cluster you register - with no agent in the cluster, no ingestion, and no index storage. It’s available on Splunkbase now, and the documentation is here.
Live access, not ingestion
Most Splunk content - including our own Monitoring Kubernetes - works by ingesting: an agent collects logs, metrics, and events and forwards them into an index, where you search the stored copy. That gives you history, retention, and trend-based alerting, at the cost of storage and license volume, and it shows you the cluster as of the last sample.
Kubernetes Search works the other way around. When you run a command, it calls the Kubernetes API live from the search head and streams the answer straight into your search. Nothing is written to an index. You see the cluster exactly as it is at the moment you search, it costs no disk and counts against no ingest quota, and it is strictly read-only - it queries your clusters, it never changes them.
Five commands
Five search commands cover the everyday kubectl verbs. Four are generating commands - they start a search and emit one row per object straight from the API; the fifth formats results.
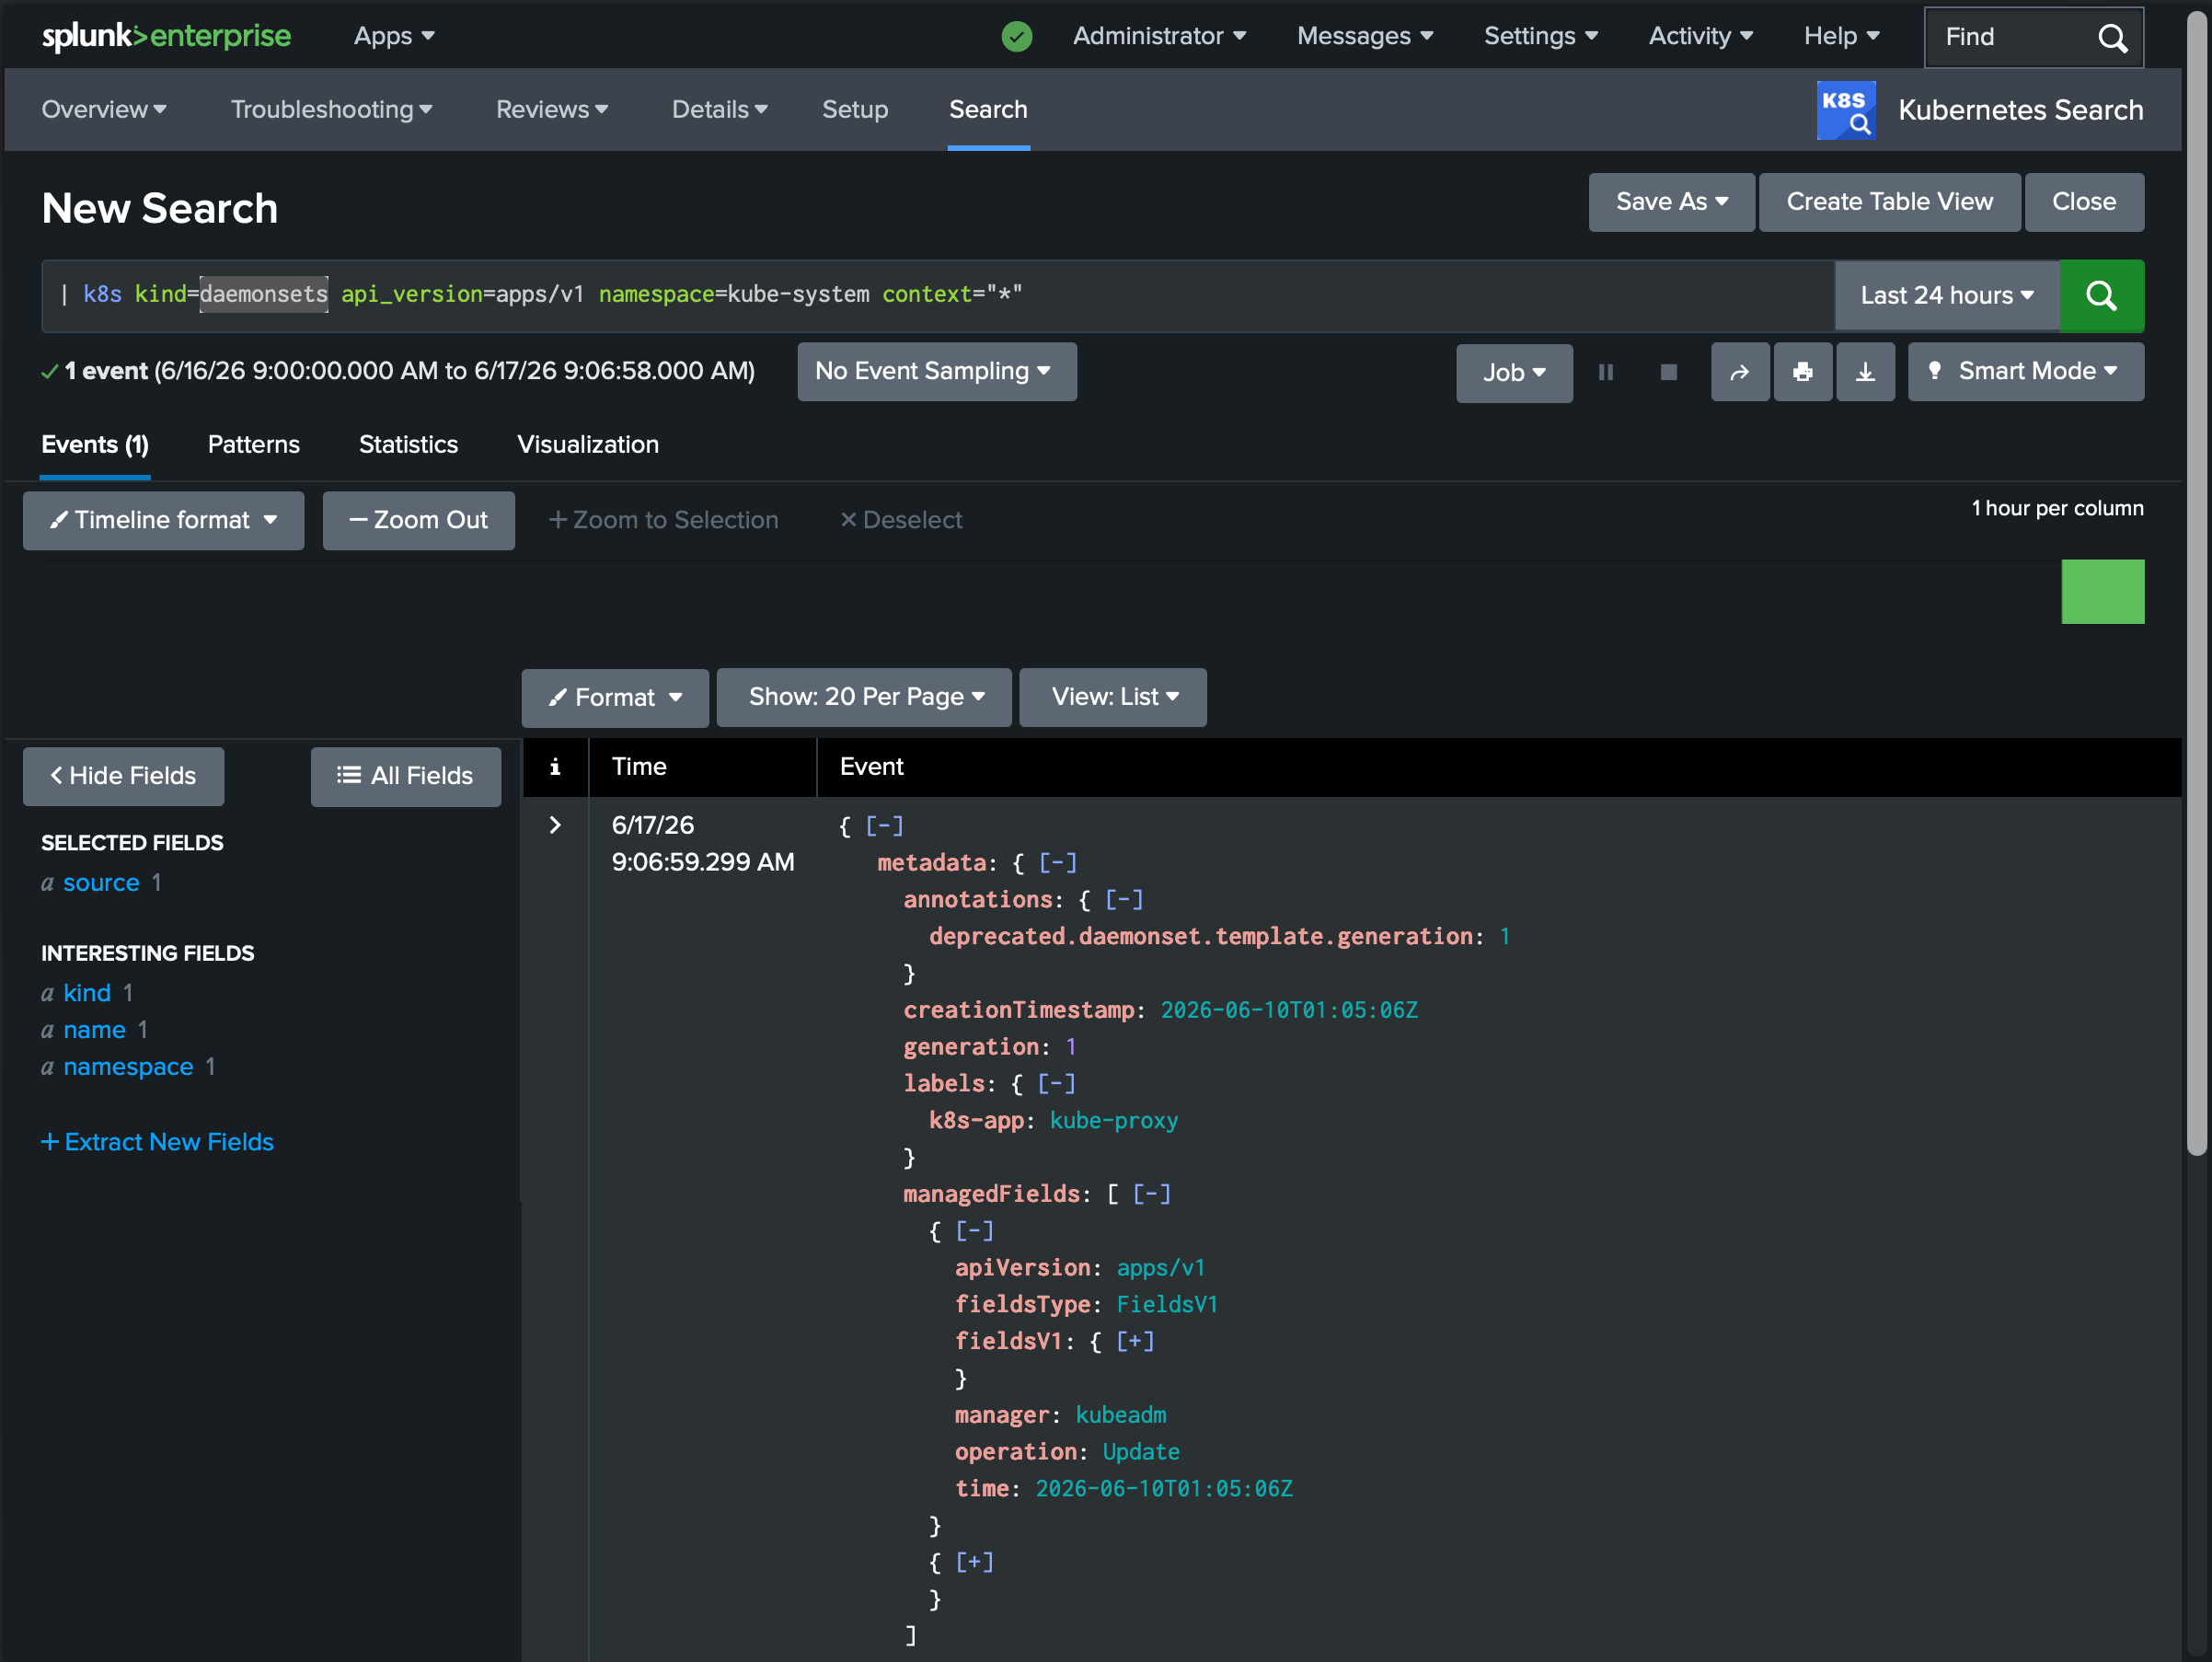
Listing resources looks like what you’d expect:
| k8s kind=pods namespace=paymentsEach row is one object, with the full JSON in _raw - so you pipe into the SPL you already know:
| k8s kind=pods namespace=payments
| spath path=status.phase output=phase
| stats count by phase
The rest follow the same shape: | k8slogs streams pod logs (with tail, since, and previous-container support), | k8sevents reads cluster events filtered by reason or the object they target, | k8sdescribe returns an object together with its events the way kubectl describe does, and | k8syaml reformats any result as kubectl-style YAML.
| k8slogs namespace=payments pods=payments-api-* tail=200The full syntax for every command is in the command reference.
Nothing to deploy, nothing to maintain
Because the work happens on the search head, there is no agent in your cluster and nothing to install cluster-side. The only things Kubernetes Search needs are a network route from the search head to the API server and a credential. It writes nothing to an index, defines no source types, and maintains no field extractions - there is no index= to search and nothing to break when your data model changes. A short-lived on-disk cache keeps repeated searches and dashboard panels from hammering your API servers; Secrets are never cached.
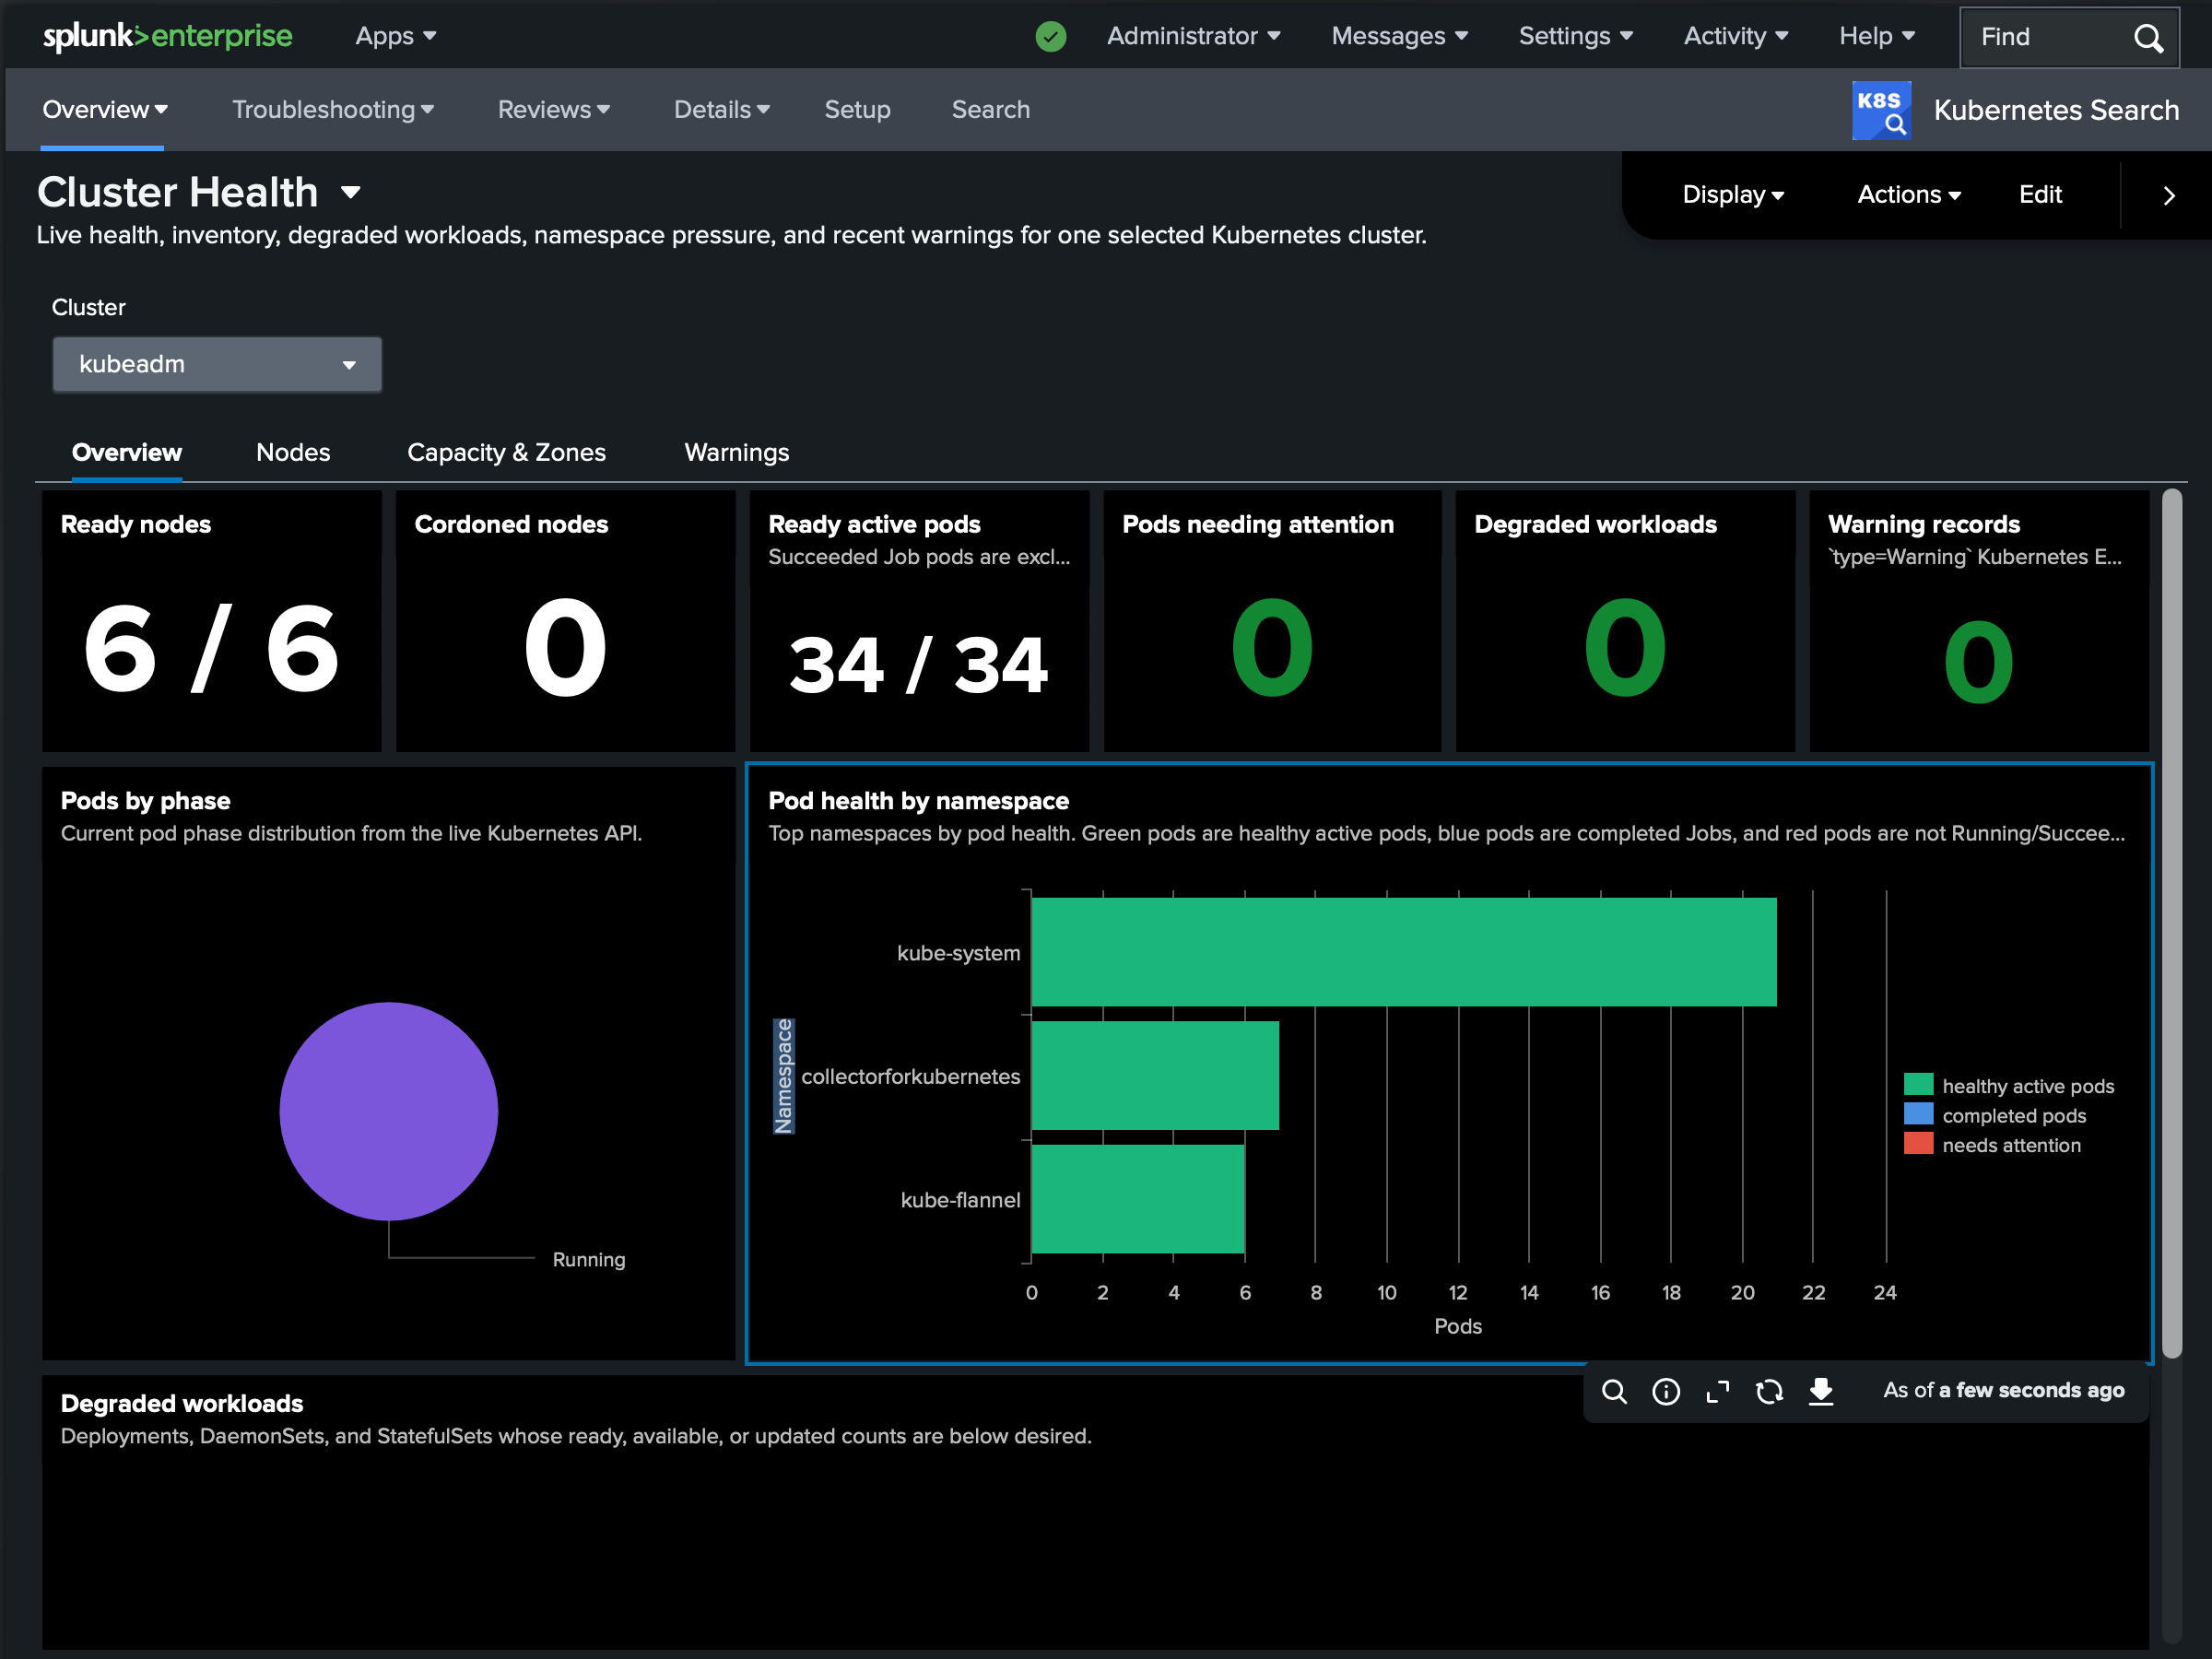
A live console for your cluster
Kubernetes Search ships a set of dashboards built entirely on its own commands - Cluster Health, Incident Snapshot, Reliability Troubleshooting, a Logs Explorer, per-pod and per-node detail views, and more. Because the commands query the API live, the dashboards show the cluster as it is right now, with a picker for any cluster you’ve registered.
Every cluster, from one pane
Register as many clusters as your license allows and target them with context=. A glob or context=* fans out to every matching cluster in parallel, and each row carries a cluster field so you can tell results apart and aggregate across the fleet:
| k8s kind=nodes context=*
| stats count by cluster
If one cluster can’t be reached, it emits a single error row and the others still return - one bad cluster never sinks the whole query.
Controlled, audited read access
Kubernetes Search is also a way to give people a window into clusters without handing out kubectl or cluster credentials. Two things gate a search: a Splunk capability decides who can run the commands at all, and a per-cluster credential model decides whose Kubernetes permissions each search runs under - a shared service account, per-user tokens, or Kubernetes impersonation, where the API server enforces each Splunk user’s own RBAC. Every query is recorded in the Splunk audit log; with impersonation, it’s attributed to the individual user in the cluster’s audit trail too. The details are in Access control.
Use it alongside ingestion
This isn’t a replacement for ingesting your logs and metrics - the two are complementary, and the strongest setup uses both in the same Splunk session. History tells you what happened; the live query tells you whether it’s still happening. A typical incident flow: you alert and triage on ingested data (Monitoring Kubernetes shows the error spike and the OOM kills over the last hour), identify the offending workload, then switch to Kubernetes Search to see its state right now - is the pod still crash-looping, what do its current events say, is it scheduled - without leaving Splunk.
Getting started
Kubernetes Search runs on a free tier with no license key: one cluster on a single standalone search head. Install it from Splunkbase on a search head, register a cluster on the Setup page, and run your first | k8s - a typical setup takes under ten minutes. A paid license unlocks multiple clusters, search head clustering, per-user credentials, and impersonation.
It runs on self-managed Splunk Enterprise (9.4, 10.0, 10.2, 10.4) and talks to any conformant Kubernetes 1.20+ cluster - EKS, GKE, AKS, OpenShift, or self-hosted.
- Docs: outcoldsolutions.com/docs/kubernetes-search
- Splunkbase: splunkbase.splunk.com/app/8858
- Pricing and quotes: outcoldsolutions.com/pricing
Try it on your own cluster, and tell us what you’d like to query next - we’d love the feedback.


