Blog
Monitoring Docker, OpenShift, Kubernetes - Version 26.04
We are happy to share the 26.04 release of our monitoring solutions.
This release was heavily focused on stability and performance, with over a dozen bug fixes and a reworked log forwarding implementation for PVC volumes. On the features side, we redesigned the events investigation experience in the Splunk apps for Kubernetes and OpenShift, published FIPS 140-compliant container images for regulated environments, and brought Prometheus metrics auto-discovery to Collectord for Docker through container labels.
Now let’s talk about the new features in this release.
Events dashboards
Monitoring Kubernetes and Monitoring OpenShift applications bring a new set of dashboards for analyzing events produced by the Kubernetes API Server. The legacy single “Events” view has been replaced with five focused dashboards designed around real investigation workflows:
- Events Timeline - the main event search and filtering interface, with severity classification (critical/high/warning/info), color-coded rows, and filters for cluster, namespace, kind, reason, and event type. A “Hide Deleted” checkbox lets you exclude garbage-collected events when investigating what’s active right now, while keeping them available for historical investigation.
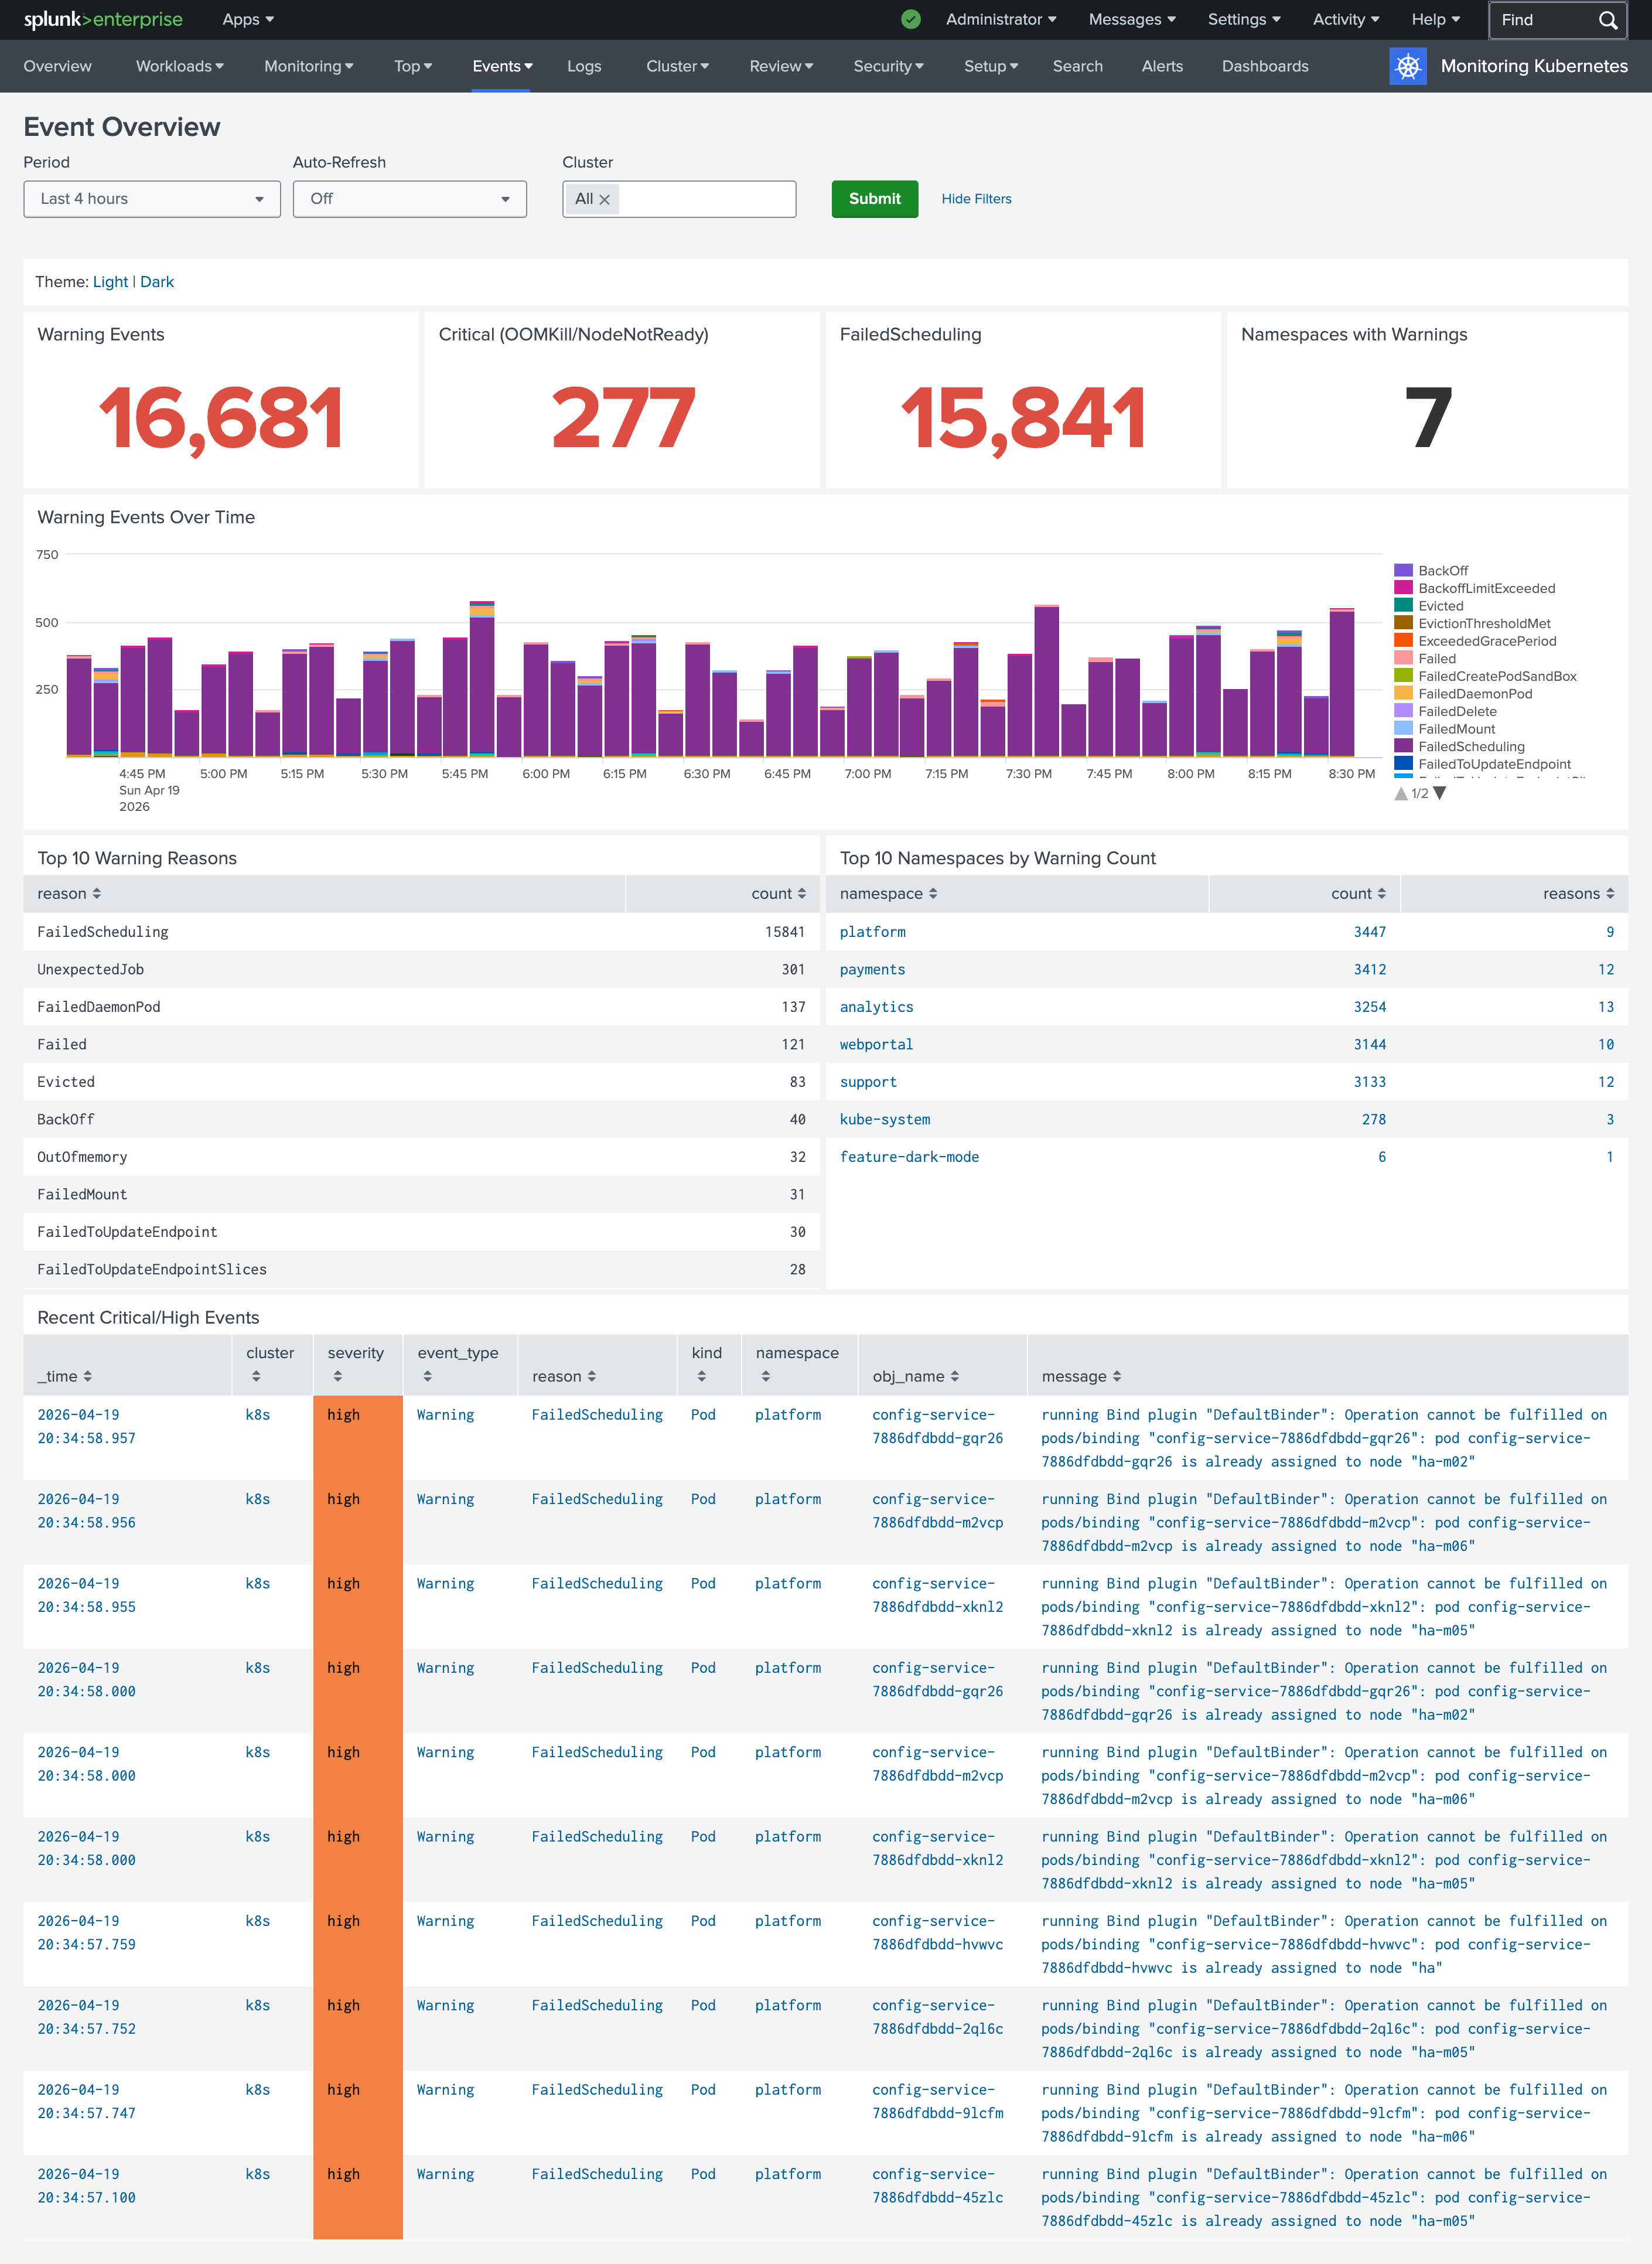
- Events Overview - a high-level landing page with KPI panels for warning events, critical conditions, failed scheduling, and namespaces with warnings. Each KPI drills down into the specialized dashboard for that category, so you can start from a bird’s-eye view and navigate directly to details.
- Workload Failures - dedicated sections for the most common pod-level problems: CrashLoopBackOff, OOMKilled, image pull failures, and probe failures. Each section shows a count KPI and a detailed table, making it easy to identify which pods are affected and why.
- Scheduling and Node Health - tracks FailedScheduling events, NodeNotReady conditions, evictions, and node pressure events (MemoryPressure, DiskPressure, PIDPressure). Useful for diagnosing cluster-level capacity and scheduling issues.
- Recurring Problems - a 7-day default window that surfaces patterns: top recurring warning reasons, namespaces with the most warnings, and problematic workloads. Great for identifying systemic issues that single-incident views miss.
Collectord describe command shows the source of the annotations
Collectord provides flexible ways to configure how data should be forwarded to outputs. You can have configurations in a ConfigMap for the Collectord deployment, but you can also change the way Collectord forwards data by using annotations on Namespaces, Workloads (like Deployments), directly on Pods, or by using Collectord CRD Configurations. This layered approach is powerful in multi-team environments - a platform team can set organization-wide defaults in a CRD, and individual teams can override them on their own workloads - but when the same annotation is defined at multiple levels, it can be hard to track which one Collectord actually uses for a given pod.
In this version, the collectord describe command now shows where each annotation came from. Each resolved
field is tagged in brackets with its origin - [pod] for pod metadata, [namespace] for namespace
annotations, and [configuration:<name>] for a specific Collectord CRD Configuration - making it trivial
to trace which level is winning:
1$ kubectl exec -n collectorforkubernetes collectorforkubernetes-fqhmv -- /collectord describe --namespace webportal --pod audit-logger-774675c89c-rpfwx | grep '\['
2logs-type [pod] = audit_logs
3volume.1-logs-name [pod] = data
4volume.1-logs-glob [pod] = *.log
This is especially useful when debugging why a pod is routing to an unexpected output, using the wrong sourcetype, or picking up a field extraction you didn’t expect.
For more information please read
- Monitoring Kubernetes - Troubleshooting - Describe Command
- Monitoring OpenShift - Troubleshooting - Describe Command
Collectord for Docker now allows you to forward Prometheus metrics by specifying annotations as well
Similar to Kubernetes and OpenShift, Collectord can now be configured with Docker labels to discover containers that expose metrics in Prometheus format and forward them to your configured output. This removes the need for a central configuration listing every container and endpoint - each container declares its own scraping configuration through labels that Collectord picks up automatically.
1docker run -d \
2    --label 'collectord.io/prometheus.1-port=9527' \
3    --label 'collectord.io/prometheus.1-path=/metrics' \
4    sophos/nginx-prometheus-metrics
The 1- prefix allows a single container to expose multiple Prometheus endpoints - use prometheus.1-*,
prometheus.2-*, and so on. Beyond port and path, you can configure the scrape interval, scheme
(http/https) with optional TLS settings (insecure, caname), basic authentication (username/password),
metric whitelist/blacklist regex filters, and routing options like output to send these metrics to a
specific configured endpoint.
For more information, please read Monitoring Docker - Annotations - Forwarding Prometheus metrics
FIPS-compliant images
For customers in regulated environments - federal agencies, healthcare, finance, and any organization with a FedRAMP, FISMA, or similar compliance requirement - we now publish FIPS 140-compliant images. FIPS 140 is a U.S. government standard that certifies cryptographic modules, and workloads deployed in regulated environments are frequently required to use only certified implementations for any operation involving encryption, signing, or hashing.
The FIPS images are built against Go’s native FIPS 140 module and are published alongside the regular
images with a -fips suffix:
outcoldsolutions/collectorforkubernetes:26.04.4-fipsBy default, the FIPS images use FIPS-certified algorithms but still allow Collectord to fall back to
non-approved algorithms if needed. If your compliance posture requires strict enforcement, you can set the
environment variable GODEBUG=fips140=only. In that mode, any attempt to use a non-FIPS-140-compliant
algorithm will crash Collectord immediately - which is exactly what you want in an audit scenario where
silent fallback would be a violation.
Collectord logs its FIPS state at startup (“FIPS 140 mode enabled” or “FIPS 140 mode enforced”), and the
same information is available in the output of collectord diag and collectord verify for documenting
the deployment’s compliance posture.
Follow the link FIPS 140-3 Compliance to learn more about the Go implementation and details.
Other notable changes
- Updated GPU Monitoring dashboards - the OpenShift and Kubernetes GPU dashboards have been updated to
work with the latest
nvidia-smi dmonandnvidia-smi pmonfield layouts, so you can take advantage of the newer NVIDIA driver and CLI versions without manual field mapping. - Improved PVC volume log forwarding - the implementation for collecting logs from PersistentVolumeClaims
(via
collectord.io/volume.N-*annotations) has been significantly reworked for better performance and reliability, especially in cases where multiple pods share a PVC or when files rotate under load. - Per-datatype output routing for events - you can now route events from a specific namespace or
workload to a different output than the one handling its logs and metrics, using the annotation
collectord.io/events-output=splunk::<outputname>. This complements the existingcollectord.io/output(global) andcollectord.io/logs-outputannotations, and is useful when you want Kubernetes events in a dedicated Splunk index for alerting while keeping pod logs in a different index for day-to-day debugging. - Stability and performance fixes - more than a dozen bug fixes addressing memory usage, reconnection behavior, and edge cases around pod lifecycle transitions.
Links
You can find more information about other minor updates by following the links below.
Release notes
- Monitoring OpenShift - Release notes
- Monitoring Kubernetes - Release notes
- Monitoring Docker - Release notes


