Blog
Complete guide for forwarding application logs from Kubernetes and OpenShift environments to Splunk
We have helped many of our customers forward various logs from their Kubernetes and OpenShift environments to Splunk. We have learned a lot, and that has helped us build many features in Collectord. And we do understand that some of the features could be hard to discover, so we would like to share our guide on how to set up proper forwarding of application logs to Splunk.
In our documentation, we have an example of how to easily forward application logs from a PostgreSQL database running inside a container. This time we will look at the JIRA application.
We assume that you already have Splunk and Kubernetes (or OpenShift) configured and have installed our solution for forwarding logs and metrics (if not, it takes 5 minutes, and you can request a trial license with our automated forms; please follow our documentation).
And one more thing: no sidecar containers are required! Collectord is the container-native solution for forwarding logs from Docker, Kubernetes, and OpenShift environments.
This guide looks pretty long. The reason for that is because we are going into a lot of detail and picked one of the most complicated examples.
1. Defining the logs
The first step is simple: let’s find the logs that we want to forward. As we mentioned above, we will use a JIRA application running in a container. For simplicity, we will define it as a single Pod
 1apiVersion: v1
 2kind: Pod
 3metadata:
 4  name: jira
 5spec:
 6  containers:
 7  - name: jira
 8    image: atlassian/jira-software:8.14
 9    volumeMounts:
10    - name: data
11      mountPath: /var/atlassian/application-data/jira
12  volumes:
13  - name: data
14    emptyDir: {}
Let’s open a shell for this application and look at what the log files look like.
1user@host# kubectl exec -it jira -- bash
2root@jira:/var/atlassian/application-data/jira# cd log
3root@jira:/var/atlassian/application-data/jira/log# ls -alh
4total 36K
5drwxr-x--- 2 jira jira 4.0K Dec 15 21:44 .
6drwxr-xr-x 9 jira jira 4.0K Dec 15 21:44 ..
7-rw-r----- 1 jira jira  27K Dec 15 21:44 atlassian-jira.log
And we will tail atlassian-jira.log to see how the logs are structured:
 12020-12-15 21:44:25,771+0000 JIRA-Bootstrap INFO      [c.a.j.config.database.DatabaseConfigurationManagerImpl] The database is not yet configured. Enqueuing Database Checklist Launcher on post-database-configured-but-pre-database-activated queue
 22020-12-15 21:44:25,771+0000 JIRA-Bootstrap INFO      [c.a.j.config.database.DatabaseConfigurationManagerImpl] The database is not yet configured. Enqueuing Post database-configuration launchers on post-database-activated queue
 32020-12-15 21:44:25,776+0000 JIRA-Bootstrap INFO      [c.a.jira.startup.LauncherContextListener] Startup is complete. Jira is ready to serve.
 42020-12-15 21:44:25,778+0000 JIRA-Bootstrap INFO      [c.a.jira.startup.LauncherContextListener] Memory Usage:
 5    ---------------------------------------------------------------------------------
 6      Heap memory     :  Used:  102 MiB.  Committed:  371 MiB.  Max: 1980 MiB
 7      Non-heap memory :  Used:   71 MiB.  Committed:   89 MiB.  Max: 1536 MiB
 8    ---------------------------------------------------------------------------------
 9      TOTAL           :  Used:  173 MiB.  Committed:  460 MiB.  Max: 3516 MiB
10    ---------------------------------------------------------------------------------
2. Telling Collectord to forward logs
The best scenario is when we can define a dedicated mount just for the path where the logs will be located. That will be the most
performant way of setting up the forwarding pipeline. But considering that JIRA recommends mounting the data volume for
all the data at /var/atlassian/application-data/jira, we can use that as well.
You can tell collectord to match the logs by glob or match (regexp; we
like to use regex101.com for testing - make sure to switch to Golang flavor). Glob is the easier
and more performant way for matching logs, as we can split the glob pattern into parts of the path and be able to know how
deep we should go inside the volume to match the logs. With match, it is a bit more complicated as .* can match
any symbol in the path, including the path separator. So every time you are configuring the match with regexp, make sure
that your volume does not have a really deep structure of folders inside.
We always recommend starting with glob. If you specify both glob and match patterns, only match will be used.
The data volume is mounted at /var/atlassian/application-data/jira/log.
We can test the glob pattern by executing the shell in the container and staying in the path of the mounted volume,
then try to execute the glob pattern with ls
1root@jira:/var/atlassian/application-data/jira# ls log/*.log*
2log/atlassian-jira.log
OK, so now we know the glob pattern log/*.log*. We are going to annotate the Pod. These annotations will tell Collectord
to look at the data volume recursively and try to find the logs that match log/*.log*.
1kubectl annotate pod jira \
2    collectord.io/volume.1-logs-name=data \
3    collectord.io/volume.1-logs-recursive=true \
4    collectord.io/volume.1-logs-glob='log/*.log*'
After doing that, you can check the logs on the Collectord pod to see if the new logs were discovered. You should see something similar to:
1INFO 2020/12/15 21:59:29.359039 outcoldsolutions.com/collectord/pipeline/input/file/dir/watcher.go:76: watching /rootfs/var/lib/kubelet/pods/007be5c2-cd20-4d5e-8044-5e2399e28764/volumes/kubernetes.io~empty-dir/data/(glob = log/*.log*, match = )
2INFO 2020/12/15 21:59:29.359651 outcoldsolutions.com/collectord/pipeline/input/file/dir/watcher.go:178: data - added file /rootfs/var/lib/kubelet/pods/007be5c2-cd20-4d5e-8044-5e2399e28764/volumes/kubernetes.io~empty-dir/data/log/atlassian-jira.log
If you see only the 1st line, that means that Collectord recognized the logs but could not find any logs matching the pattern. It’s also possible the configuration is incorrect, and maybe you need to run the troubleshooting steps to see if Collectord can see the volumes.
At this point, we can go to Splunk and discover the logs in the Monitoring Kubernetes application.
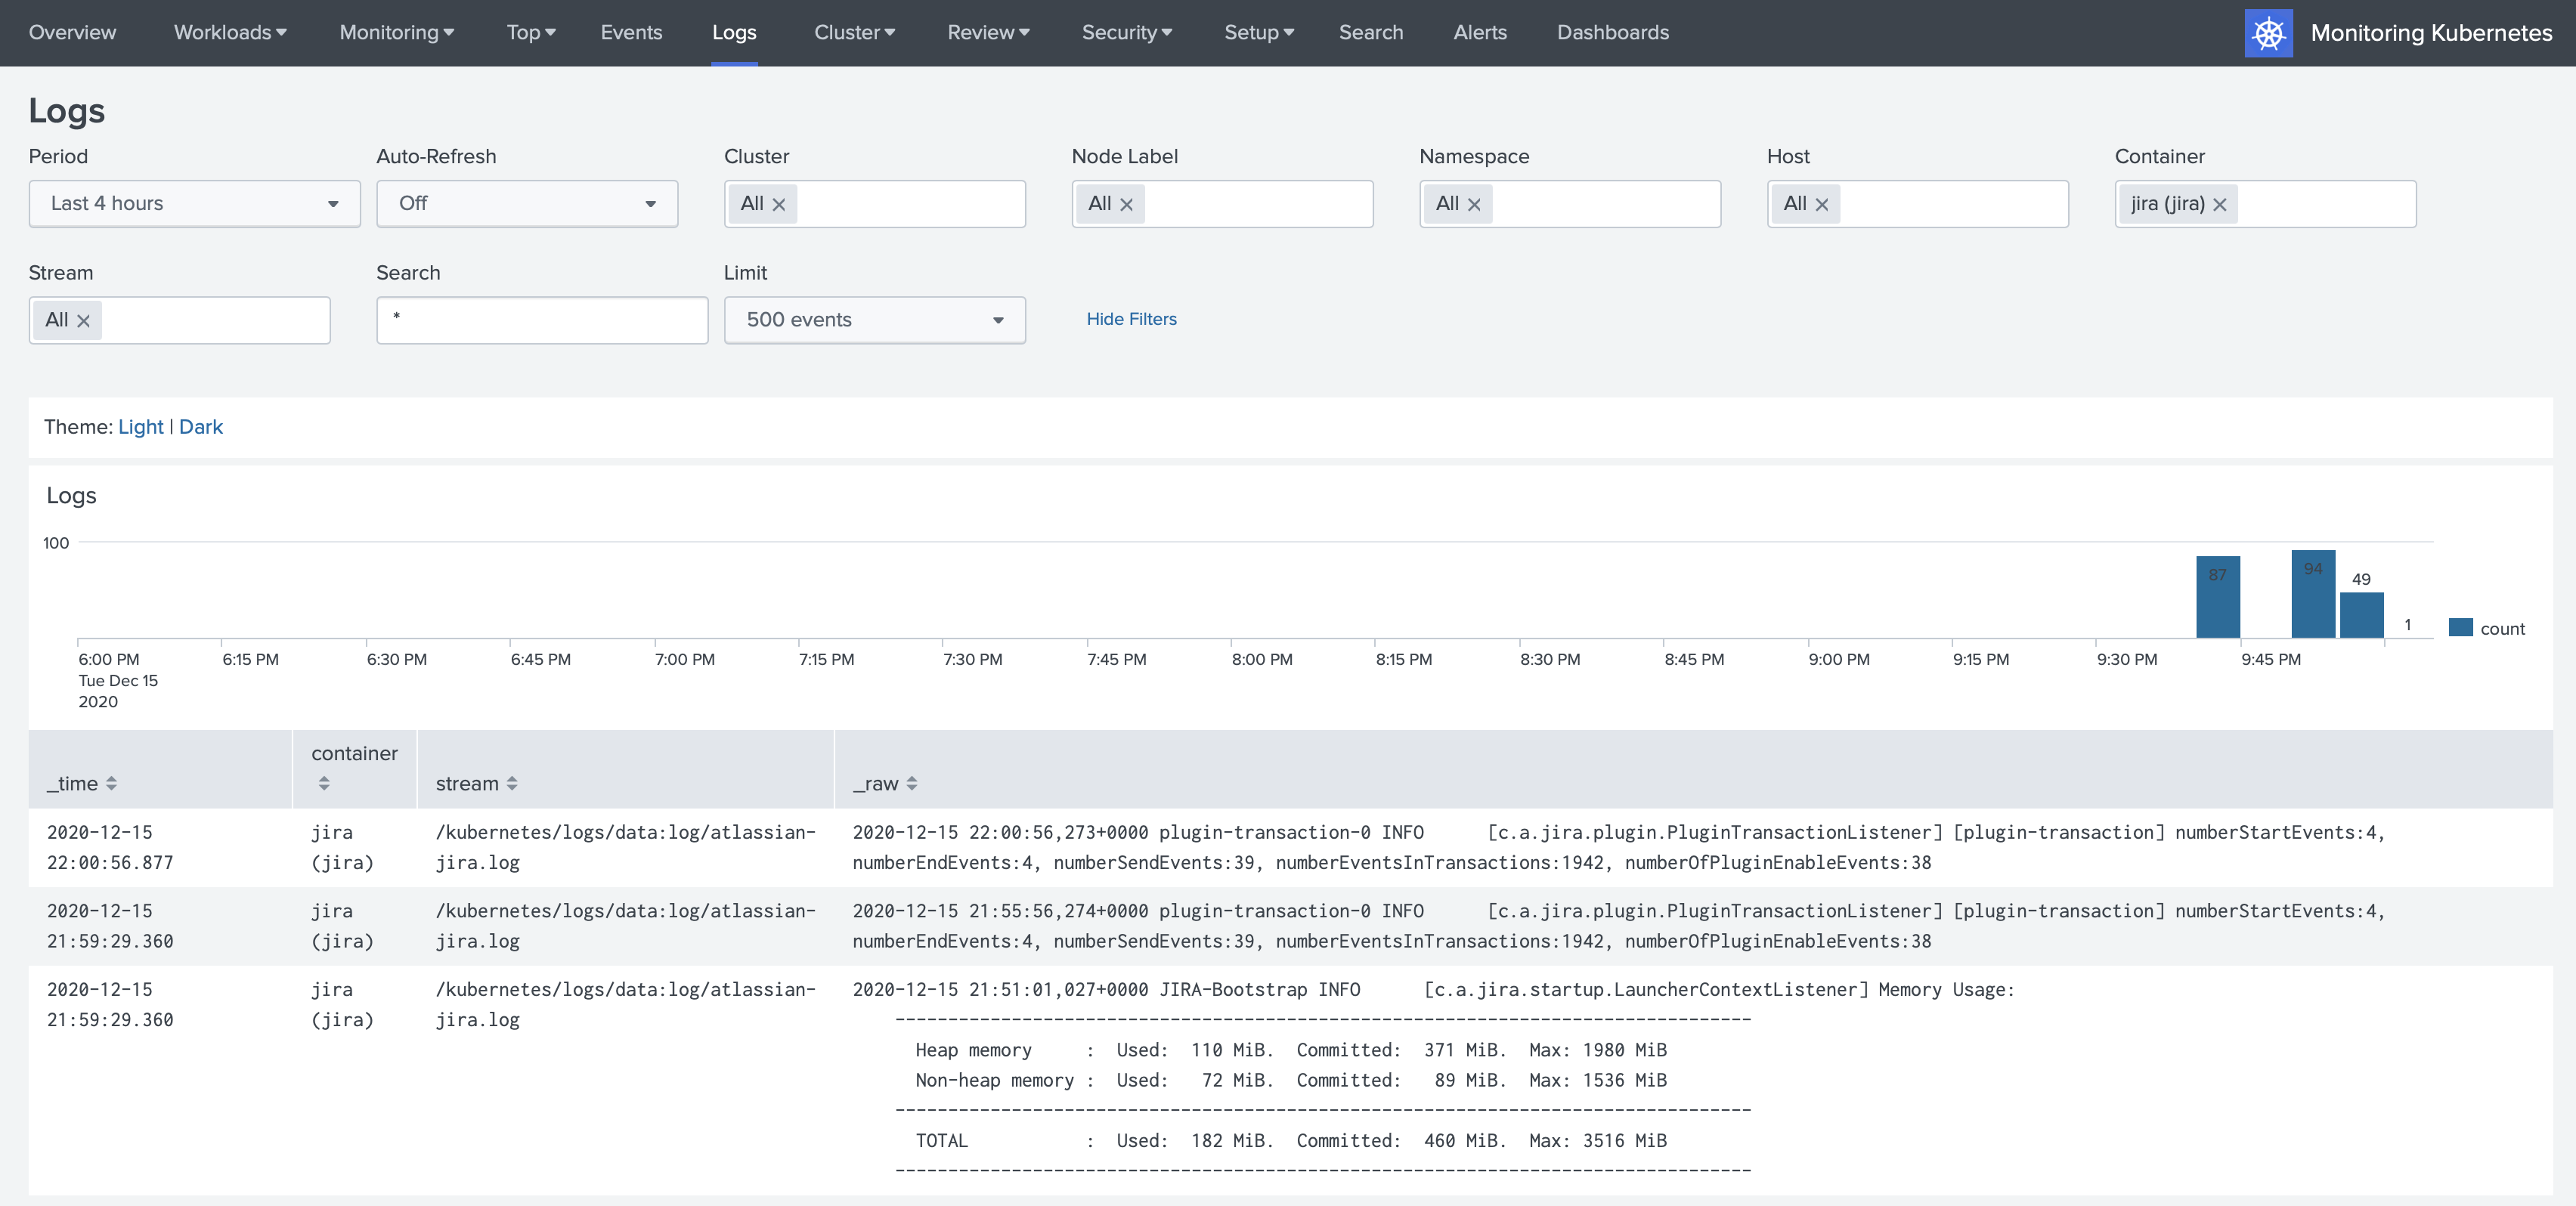
3. Multiline events
By default, Collectord merges all the lines starting with spaces with the previous lines. All the default configurations
are under [input.app_logs] in the ConfigMap that you deploy with Collectord. Let’s cover the most important of them.
disabled = false- the feature of discovering application logs is enabled by default. Obviously, if there are no annotations telling Collectord to pick up the logs from Containers, nothing is going to be forwarded.walkingInterval = 5s- how often Collectord will walk the path and see if there are new files matching the pattern.glob = *.log*- default glob pattern; in our example above we override it withlog/*.log*type = kubernetes_logs- default source type for the logs forwarded from containerseventPatternRegex = ^[^\s]- that is the default pattern for how the new event should start (should not start with a space character). That is how we see that some of the logs are already forwarded as multiline events.eventPatternMaxInterval = 100ms- we expect that every line in the message should be written to the file within 100ms. When we see that there is a larger interval between the lines, we assume those are different messages.eventPatternMaxWait = 1s- the maximum amount of time we are going to wait for new lines in the pipeline. We never want to block the pipeline, so we will wait a maximum of1safter the first line of the event before we decide to forward the event as-is to Splunk.
The default pattern for matching multiline events works great, but considering that we know exactly how to identify the
new event by looking at the pattern of the messages, we can define a unique pattern for this pod with regexp
^\d{4}-\d{2}-\d{2} \d{2}:\d{2}:\d{2},\d{3}\+[^\s]+, where we are telling Collectord that every event should start
with the timestamp like 2020-12-15 21:44:25,771+0000.
Let’s add one more annotation
1kubectl annotate pod jira \
2    collectord.io/volume.1-logs-eventpattern='^\d{4}-\d{2}-\d{2} \d{2}:\d{2}:\d{2},\d{3}\+[^\s]+'
4. Extracting time
If you look at the events forwarded to Splunk, you will see that the timestamp of the event in Splunk does not match the timestamp of the event in the log line. Also, including the timestamp in the logs adds additional licensing cost for Splunk as well.

For container logs, we recommend just completely removing the timestamp in the log line, as the container runtime provides an accurate timestamp for every log line. See Timestamps in container logs.
We will try to extract the timestamp from the log lines and forward it as the correct timestamp of the event. In most cases, it is way easier to do, but with the current format in JIRA it is a little bit trickier, so we will need to include some magic.
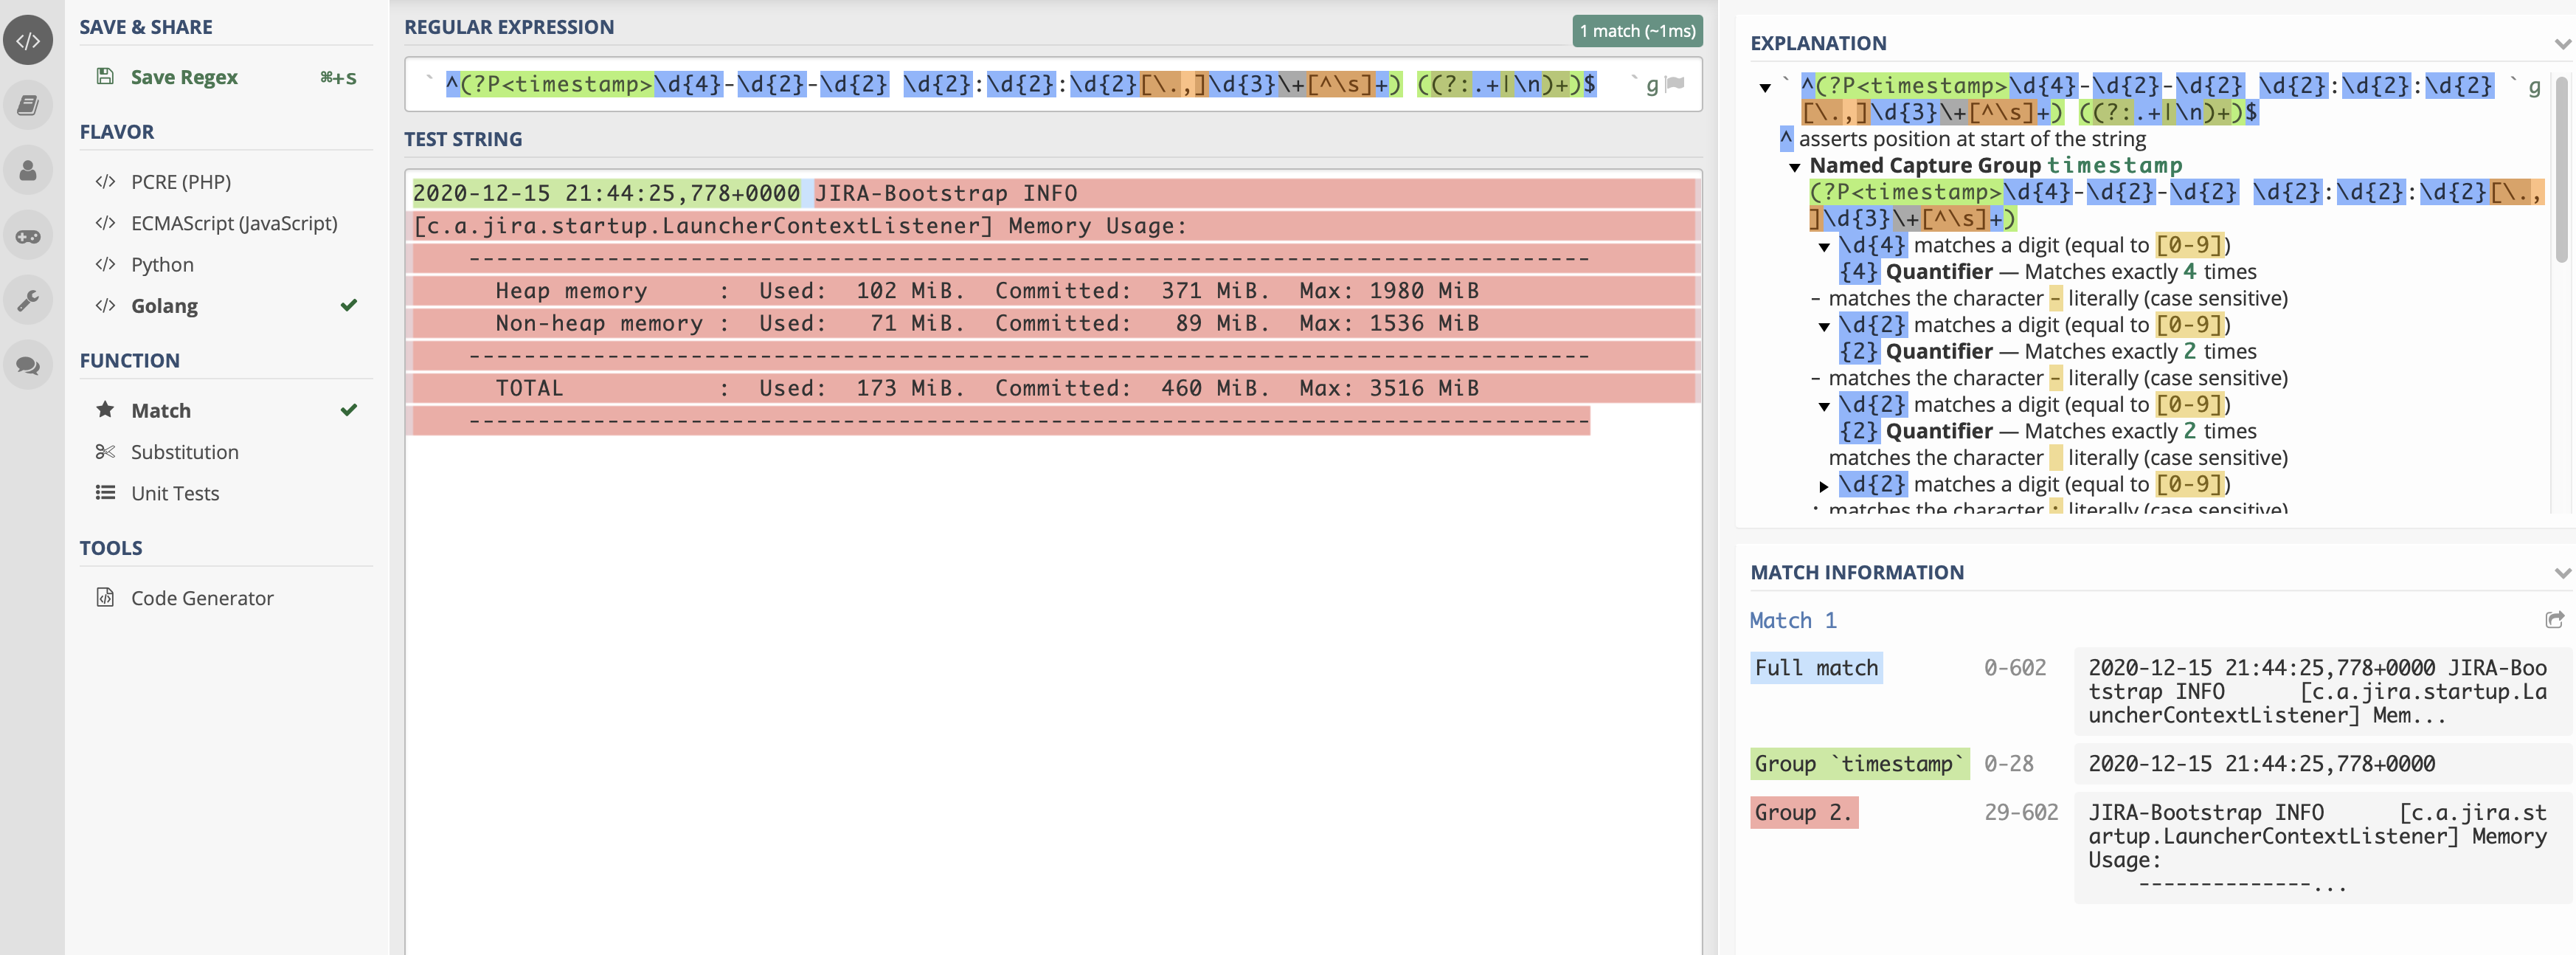
First, we need to extract the timestamp as a separate field. For this, we will use the already mentioned tool regex101.com.
The regexp that I’ve built is ^(?P<timestamp>\d{4}-\d{2}-\d{2} \d{2}:\d{2}:\d{2}[\.,]\d{3}\+[^\s]+) ((?:.+|\n)+)$.
On the Match Information tab, you can see that the whole event is matching (could be tricky with multiline events),
the timestamp field is extracted, and the rest is an unnamed group. The last unnamed group gets forwarded to Splunk
with Collectord as a message field. A few notes about this regexp:
In the middle of the timestamp, I don’t match the subseconds with just a
,, but instead match it with a dot or comma[\.,]. I will show you below the real reason for that - we will need to make a workaround, as golang cannot parse timestamps where subseconds are separated by a comma, not a dot.(?:YOUR_REGEXP)always use a non-capturing pattern when you don’t want to name this pattern but need to use parentheses to define the whole regexp pattern. That way, you are not telling Collectord to look at this as another field.
Collectord is written in Go language, so we use the Go Parse function from time package to parse the time. You can always play with the golang playground, and we prepared a template for you to try to prepare your perfect parsing layout for timestamps.
 1package main
 2
 3import (
 4	"fmt"
 5	"time"
 6)
 7
 8func main() {
 9	t, err := time.Parse("2006-01-02 15:04:05,000-0700", "2020-12-15 21:44:25,771+0000")
10	if err != nil {
11		panic(err)
12	}
13	fmt.Println(t.String())
14}
If you try to run this code, you will see an error:
1panic: parsing time "2020-12-15 21:44:25,771+0000" as "2006-01-02 15:04:05,000-0700": cannot parse "771+0000" as ",000"As I mentioned above, the reason for that is that the Go language cannot recognize milliseconds after the comma. With Collectord,
we can replace the comma with a dot, and then our timestamp layout will be 2006-01-02 15:04:05.000-0700.
First, these are annotations that will help us replace the comma with a dot.
1kubectl annotate pod jira \
2    collectord.io/volume.1-logs-replace.fixtime-search='^(?P<timestamp_start>\d{4}-\d{2}-\d{2} \d{2}:\d{2}:\d{2}),(?P<timestamp_end>\d{3}\+[^\s]+)' \
3    collectord.io/volume.1-logs-replace.fixtime-val='${timestamp_start}.${timestamp_end}'
After that, we can apply annotations to extract the timestamp as a field and parse it as a timestamp field for events:
1kubectl annotate pod jira \
2    collectord.io/volume.1-logs-extraction='^(?P<timestamp>\d{4}-\d{2}-\d{2} \d{2}:\d{2}:\d{2}[\.,]\d{3}\+[^\s]+) ((?:.+|\n)+)$' \
3    collectord.io/volume.1-logs-timestampfield='timestamp' \
4    collectord.io/volume.1-logs-timestampformat='2006-01-02 15:04:05.000-0700'
The complete example
After applying all the annotations, our pod definition should look similar to the example below.
1apiVersion: v1
2kind: Pod
3metadata:
4 name: jira
5 annotations:
6 collectord.io/volume.1-logs-name: 'data'
7 collectord.io/volume.1-logs-recursive: 'true'
8 collectord.io/volume.1-logs-glob: 'log/*.log*'
9 collectord.io/volume.1-logs-eventpattern: '^\d{4}-\d{2}-\d{2} \d{2}:\d{2}:\d{2},\d{3}\+[^\s]+'
10 collectord.io/volume.1-logs-replace.fixtime-search: '^(?P<timestamp_start>\d{4}-\d{2}-\d{2} \d{2}:\d{2}:\d{2}),(?P<timestamp_end>\d{3}\+[^\s]+)'
11 collectord.io/volume.1-logs-replace.fixtime-val: '${timestamp_start}.${timestamp_end}'
12 collectord.io/volume.1-logs-extraction: '^(?P<timestamp>\d{4}-\d{2}-\d{2} \d{2}:\d{2}:\d{2}[\.,]\d{3}\+[^\s]+) ((?:.+|\n)+)$'
13 collectord.io/volume.1-logs-timestampfield: 'timestamp'
14 collectord.io/volume.1-logs-timestampformat: '2006-01-02 15:04:05.000-0700'
15spec:
16 containers:
17 - name: jira
18 image: atlassian/jira-software:8.14
19 volumeMounts:
20 - name: data
21 mountPath: /var/atlassian/application-data/jira
22 volumes:
23 - name: data
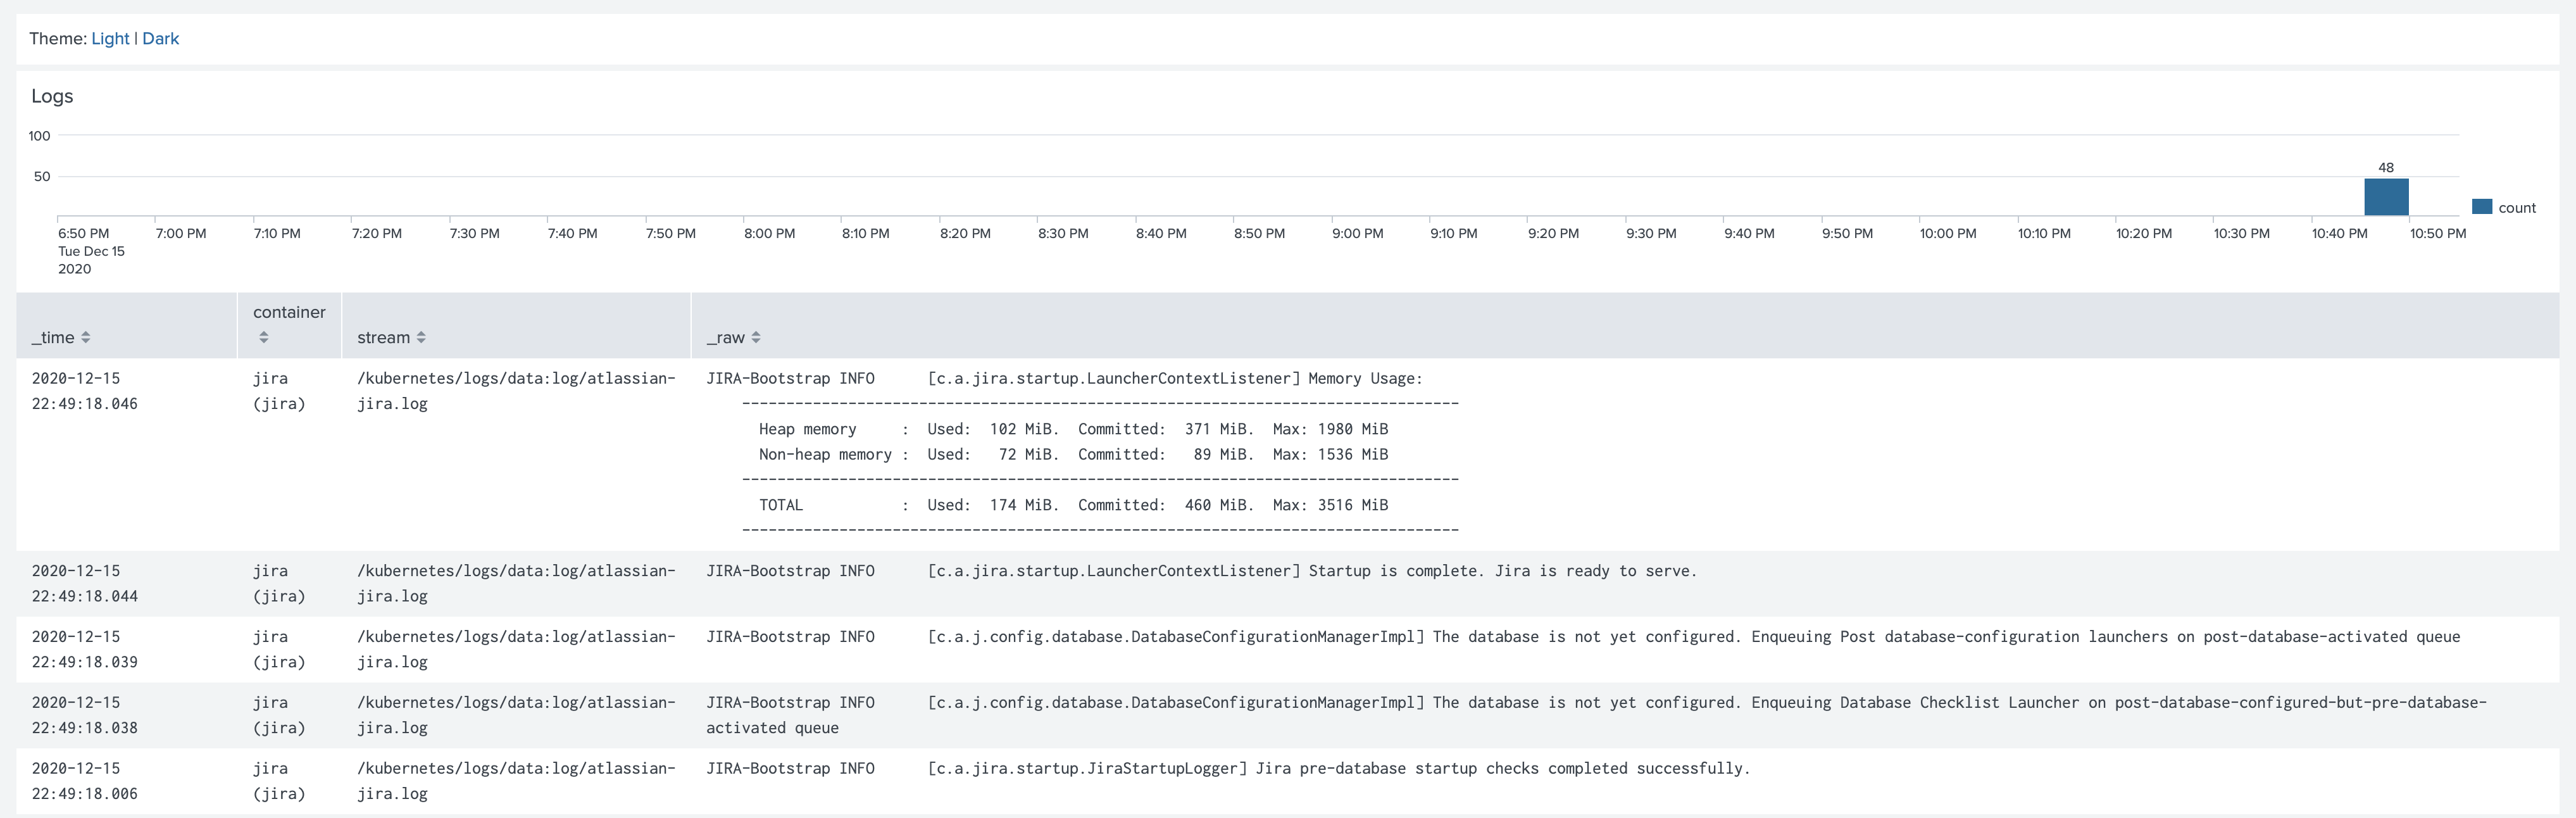
24 emptyDir: {}The logs in Splunk should be well-formatted:
Links
Read more about available annotations that control the forwarding pipeline in the links below:


