Blog
Monitoring Docker, OpenShift and Kubernetes - Version 5.10 - Security dashboards, multi-cluster monitoring
Minor update 5.10 is focused on the usability improvements for the multi-cluster monitoring and security monitoring use cases.
Security and audit dashboards
With version 5.10 we improved existing security and audit monitoring and introduced a new set of dashboards grouped under the Security tab.
If you have Security use-cases that we haven’t covered yet, feel free to send us a feature request at contact@outcoldsolutions.com.
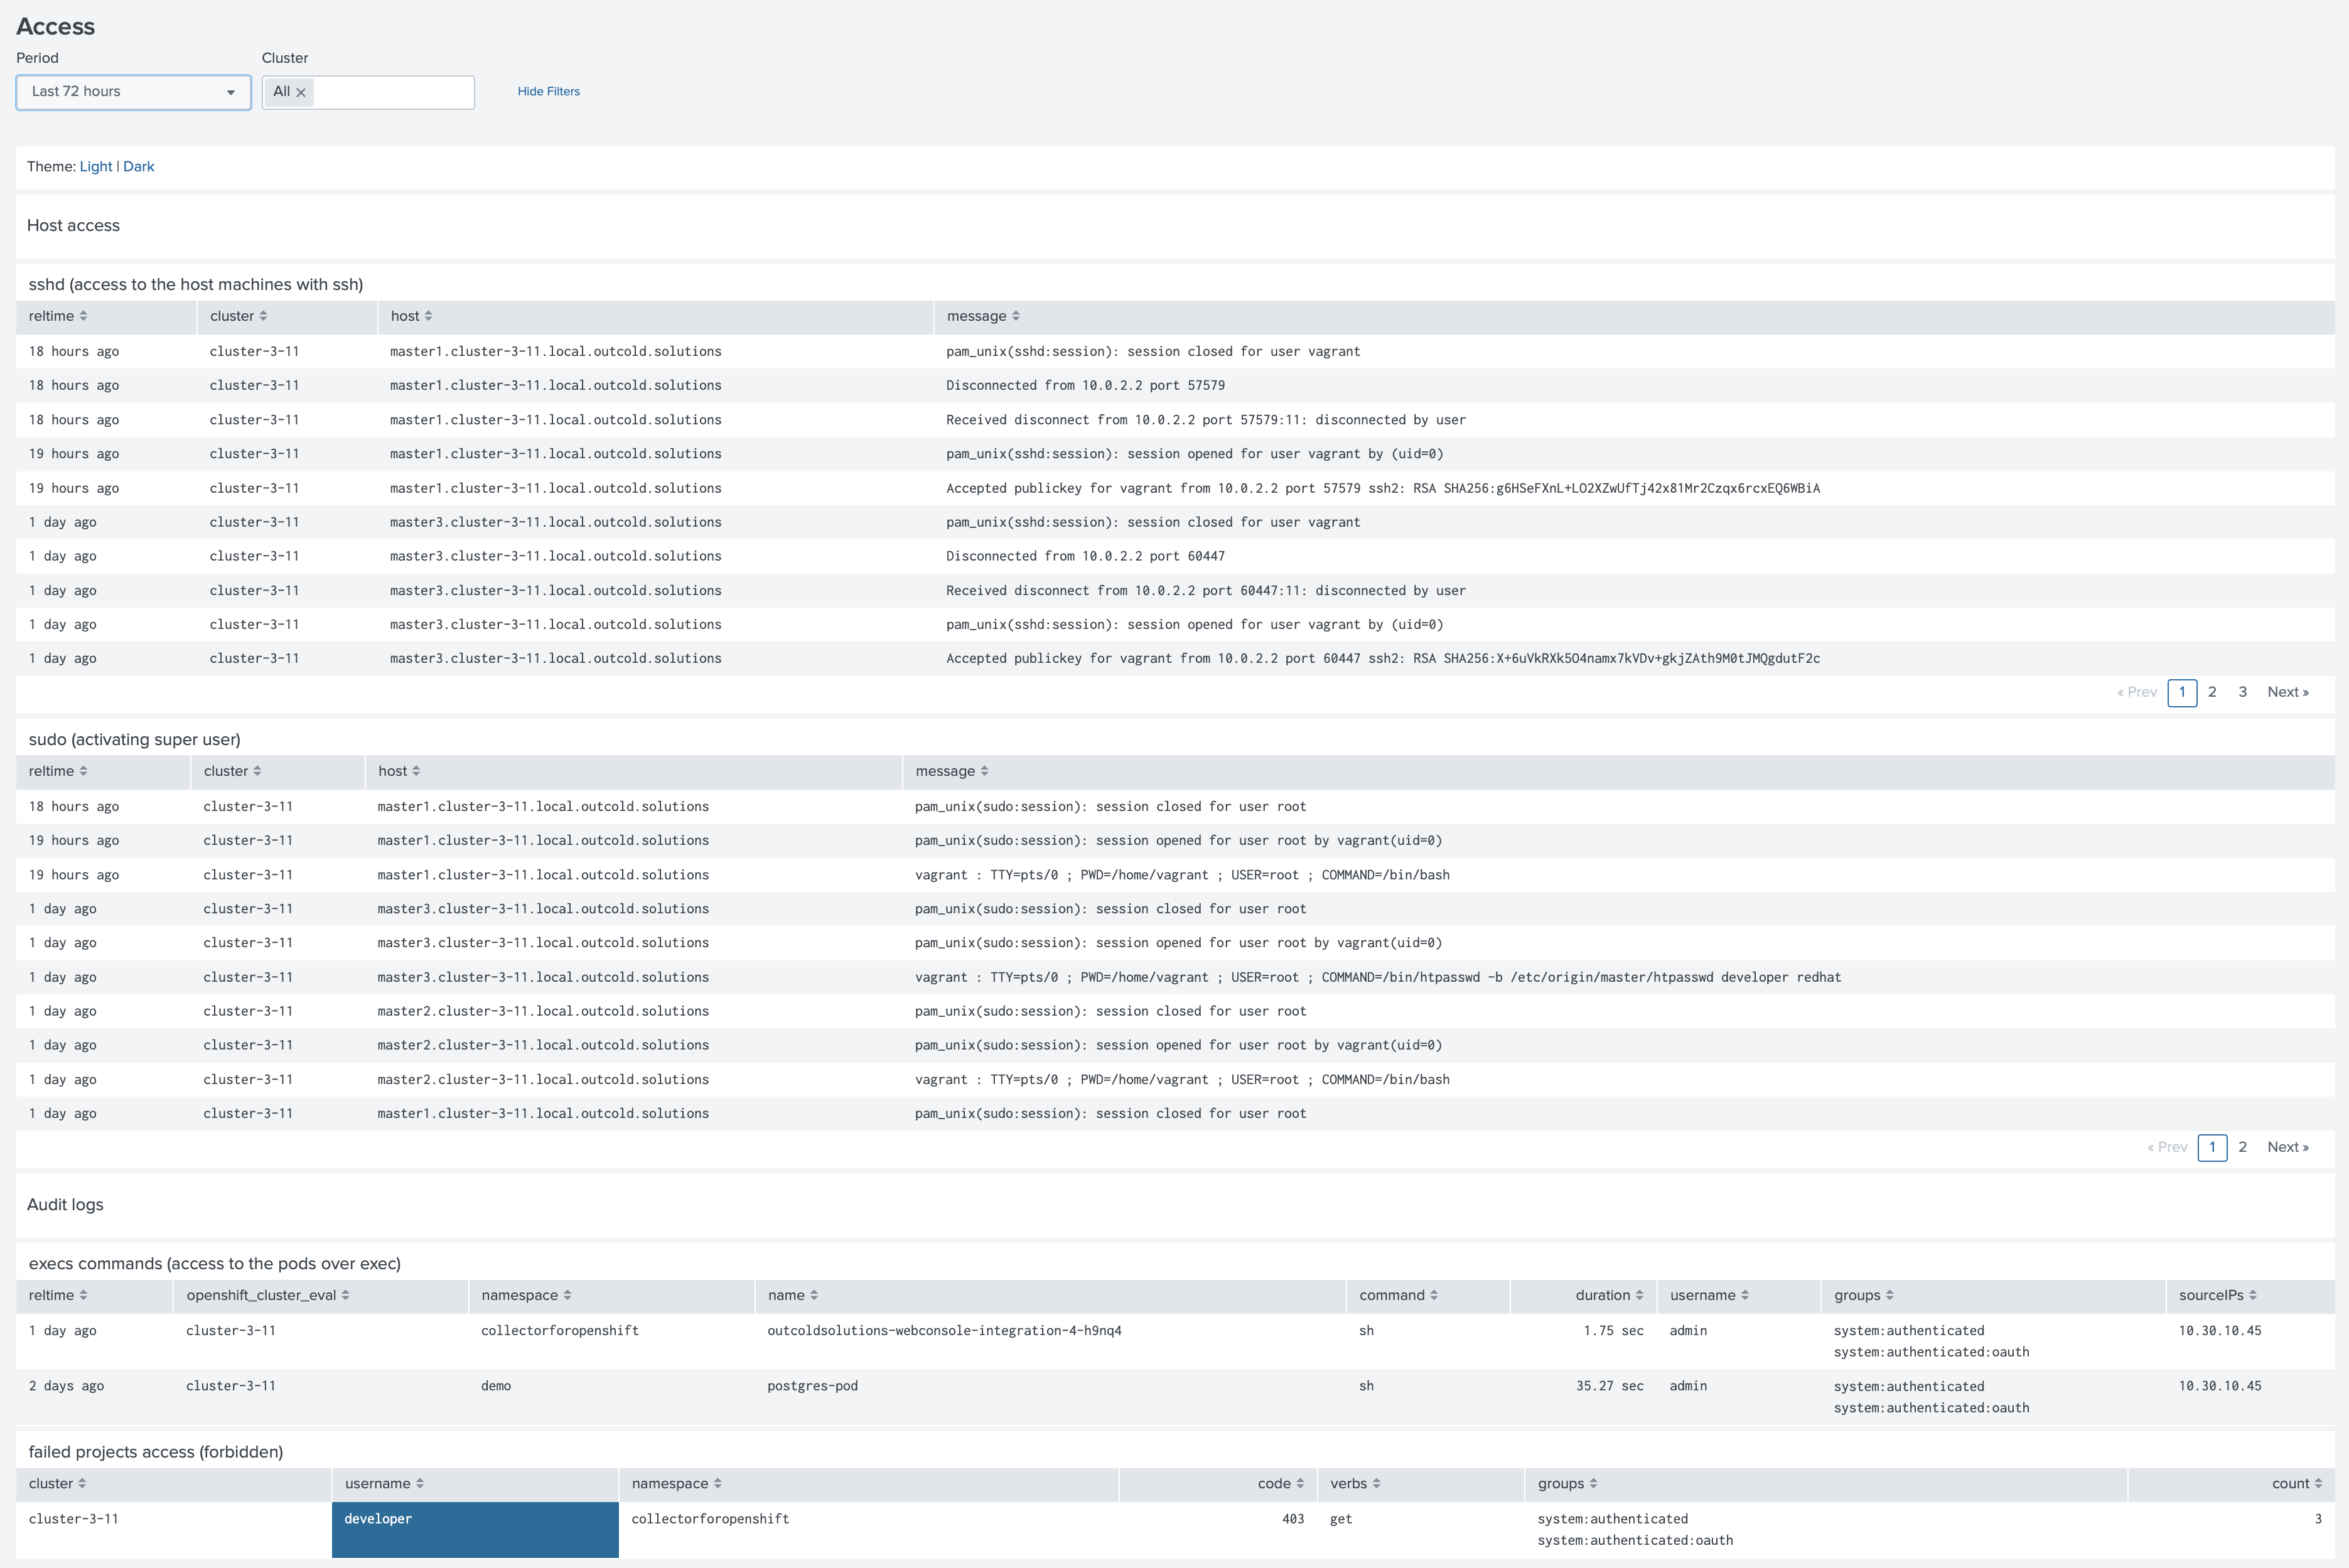
Access dashboard
Review ssh sessions, super user sessions, exec sessions on your pods and forbidden requests to API server.
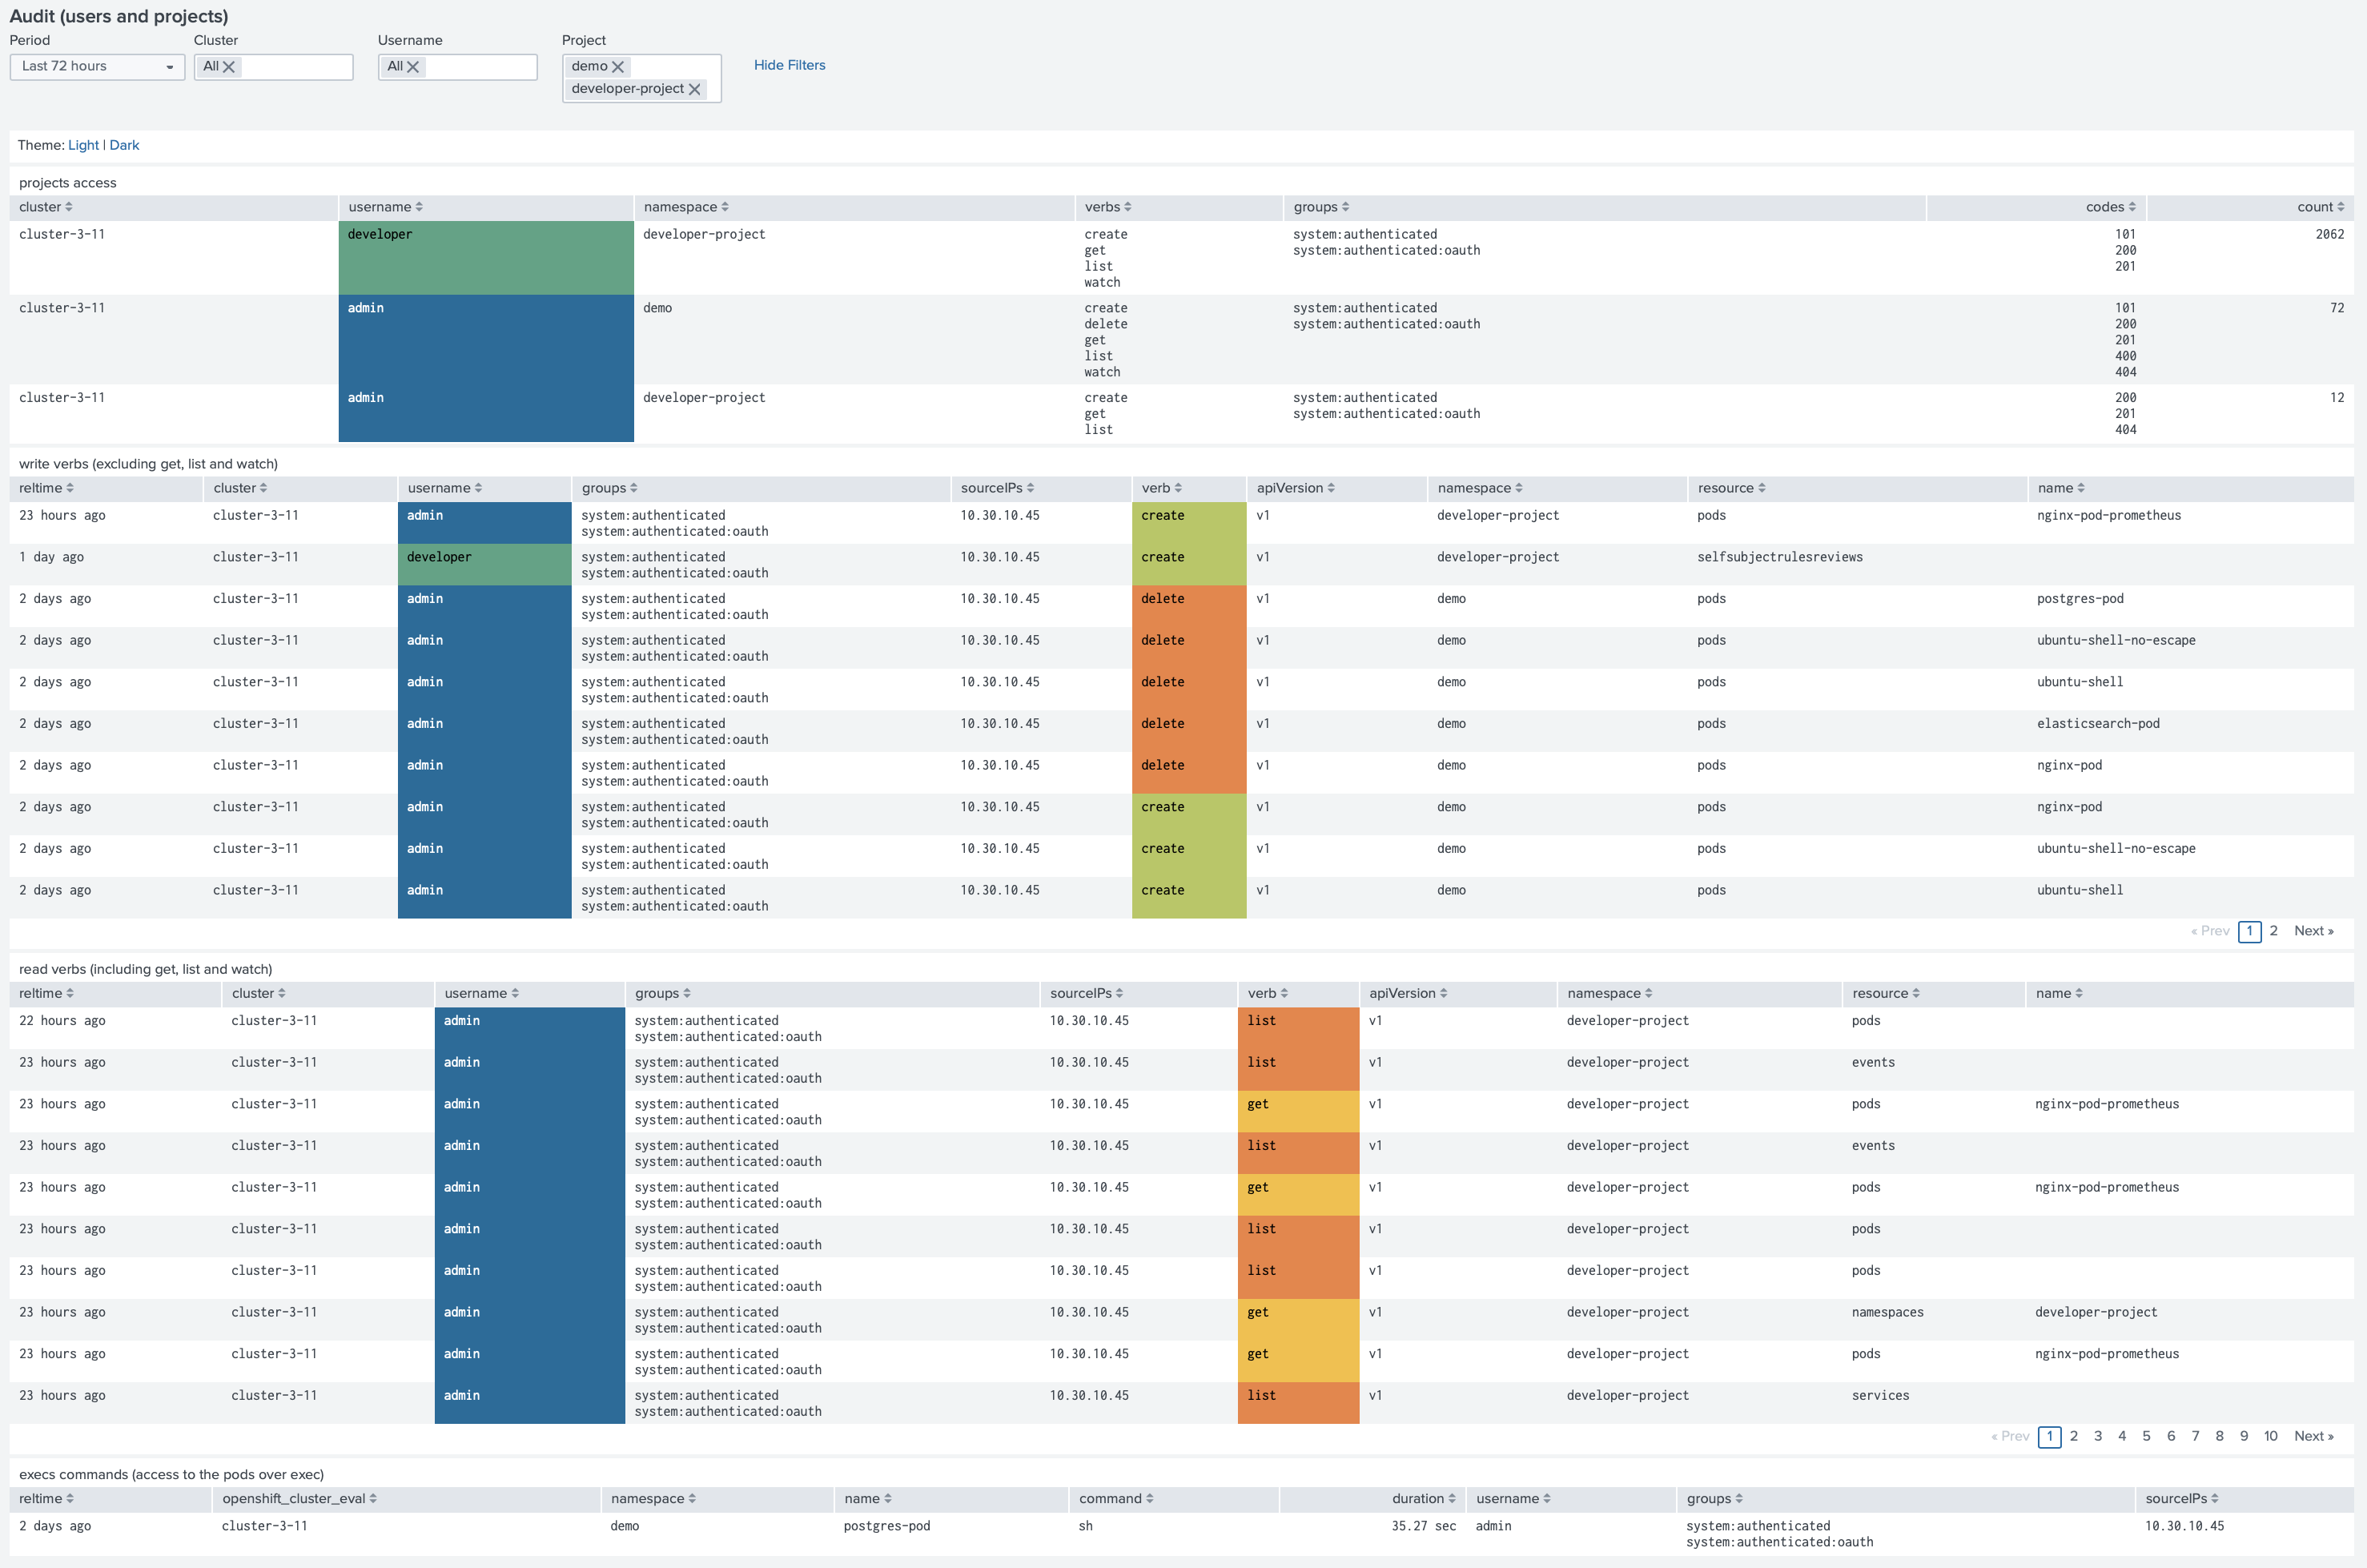
Audit (users and projects)
In addition to the Audit dashboard, we introduced a new dashboard focused on the access to the API server from the users (excluding system accounts). Now you can easily find who worked on the specific project in the last 72 hours, the list of actions they executed, and the number of requests they have made.
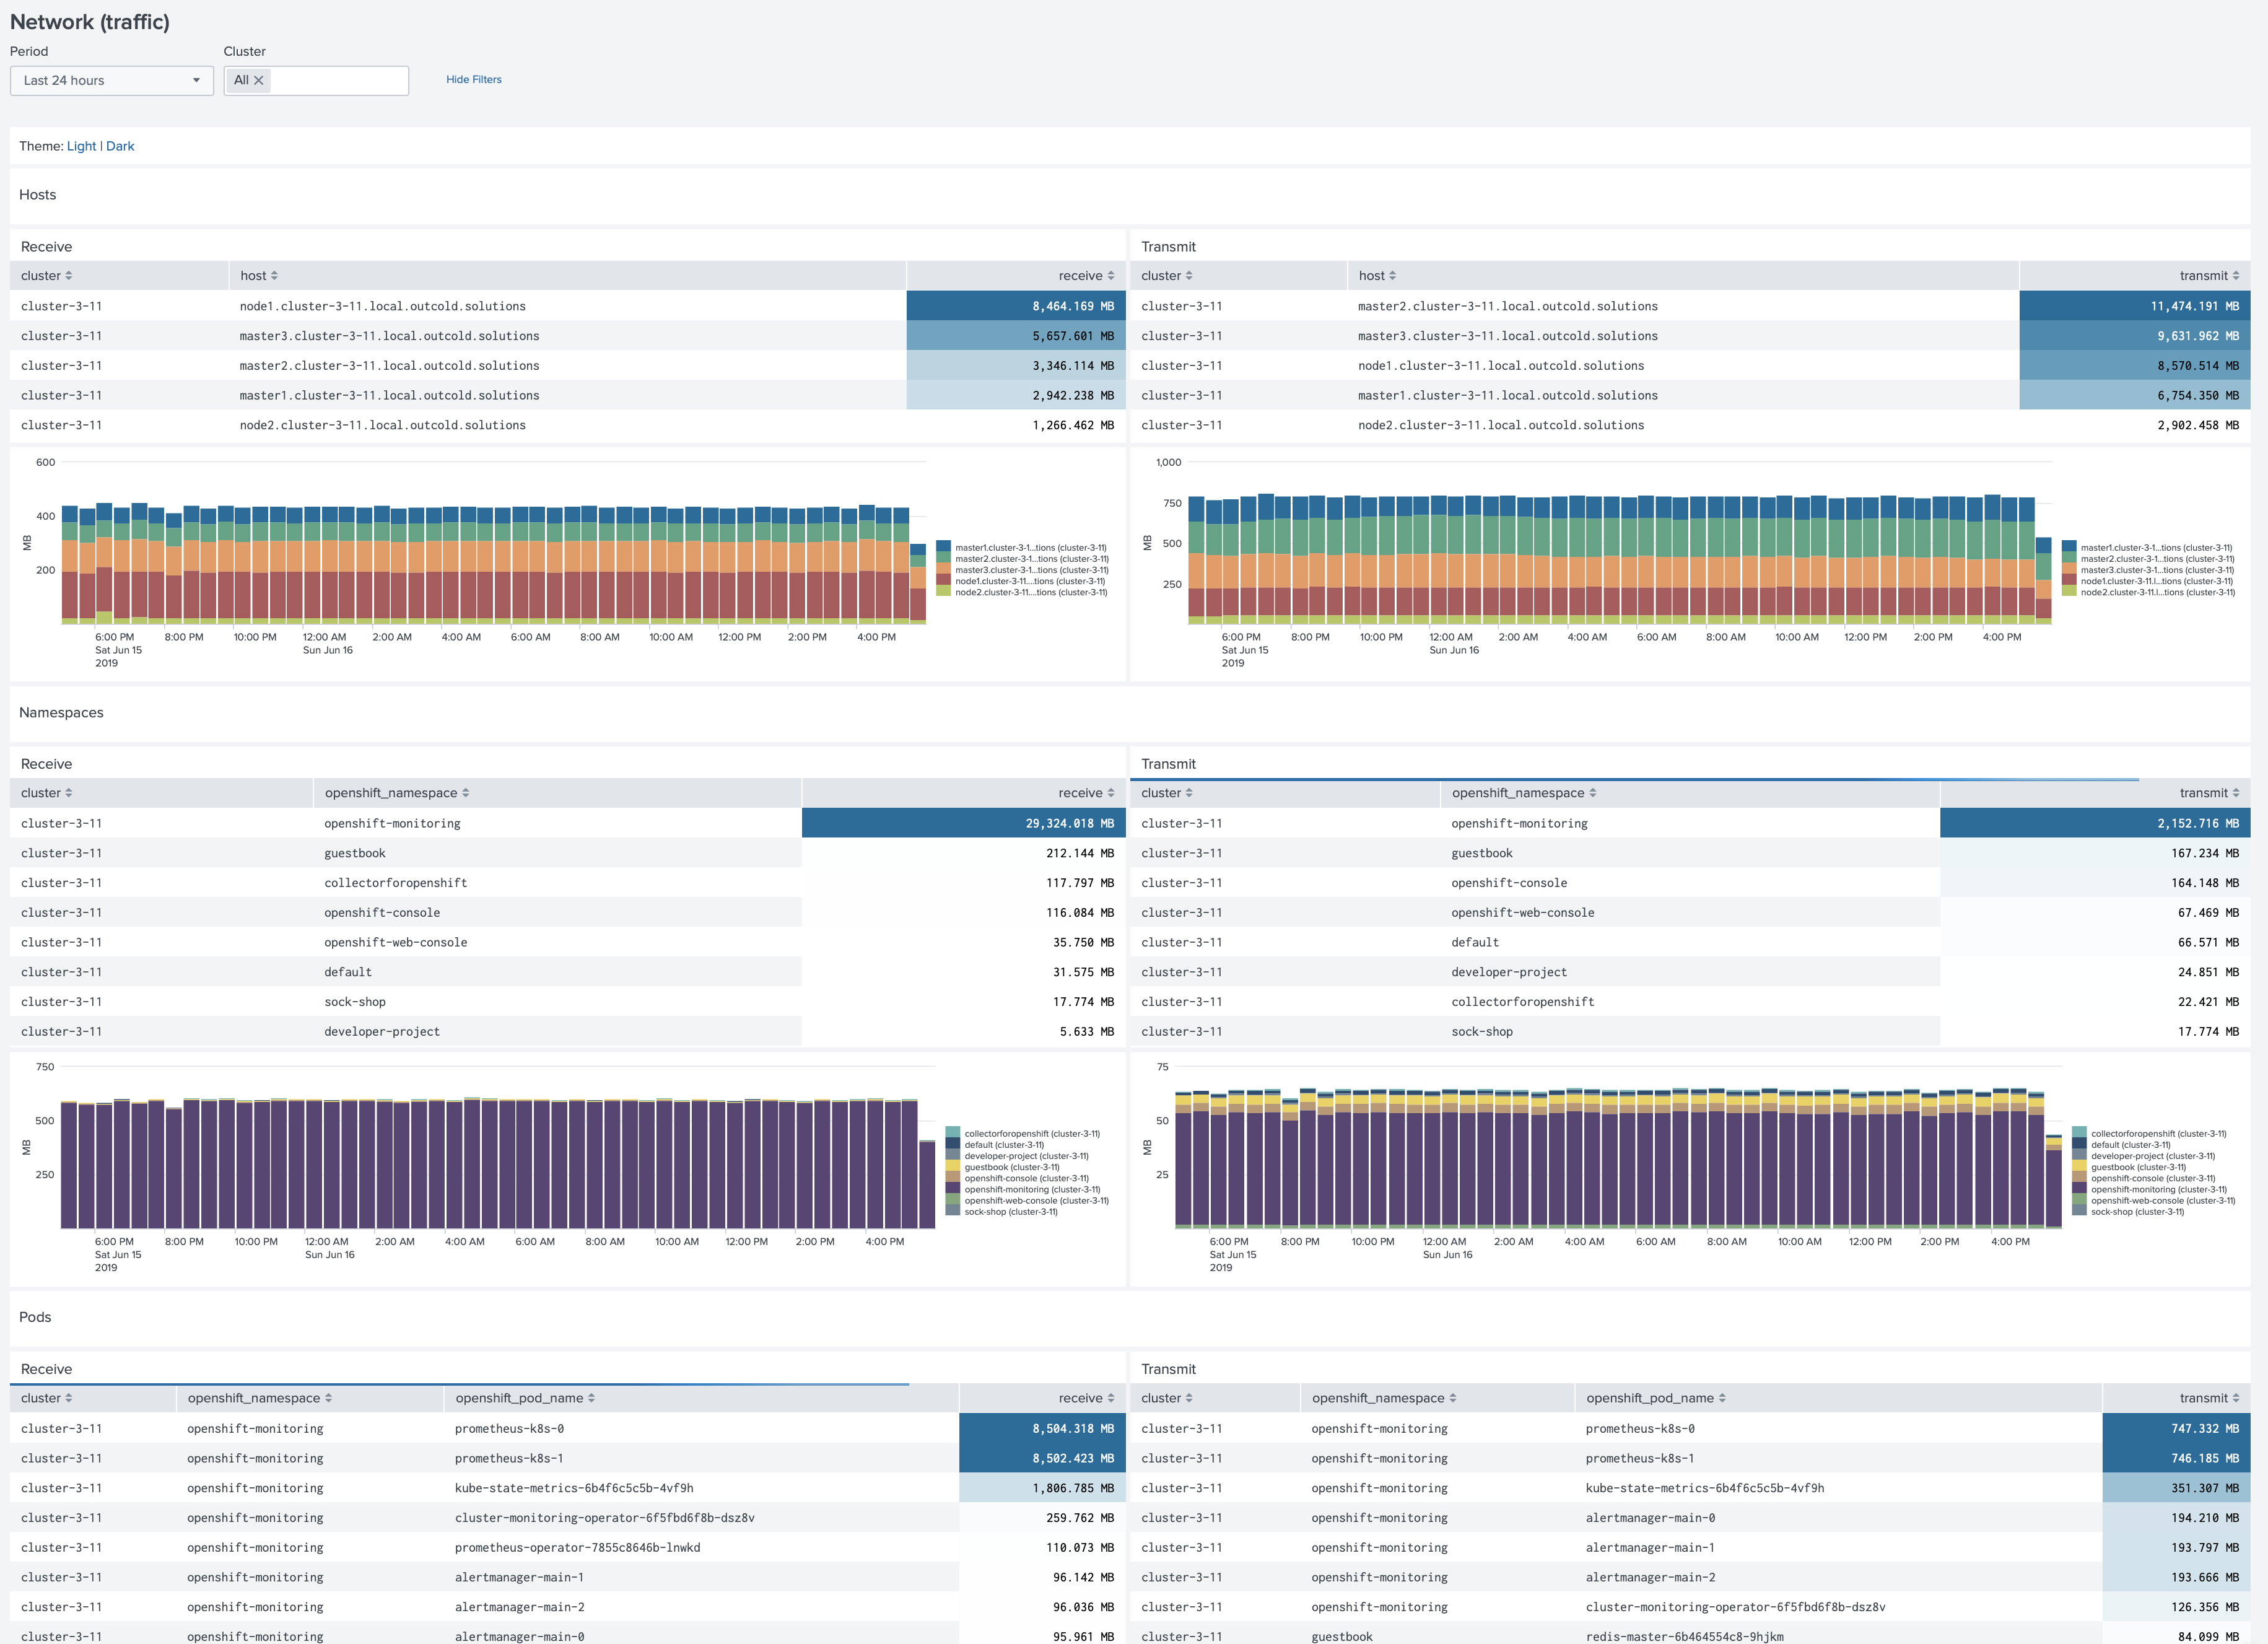
Network (traffic)
Monitor the network traffic for your hosts and namespaces/projects
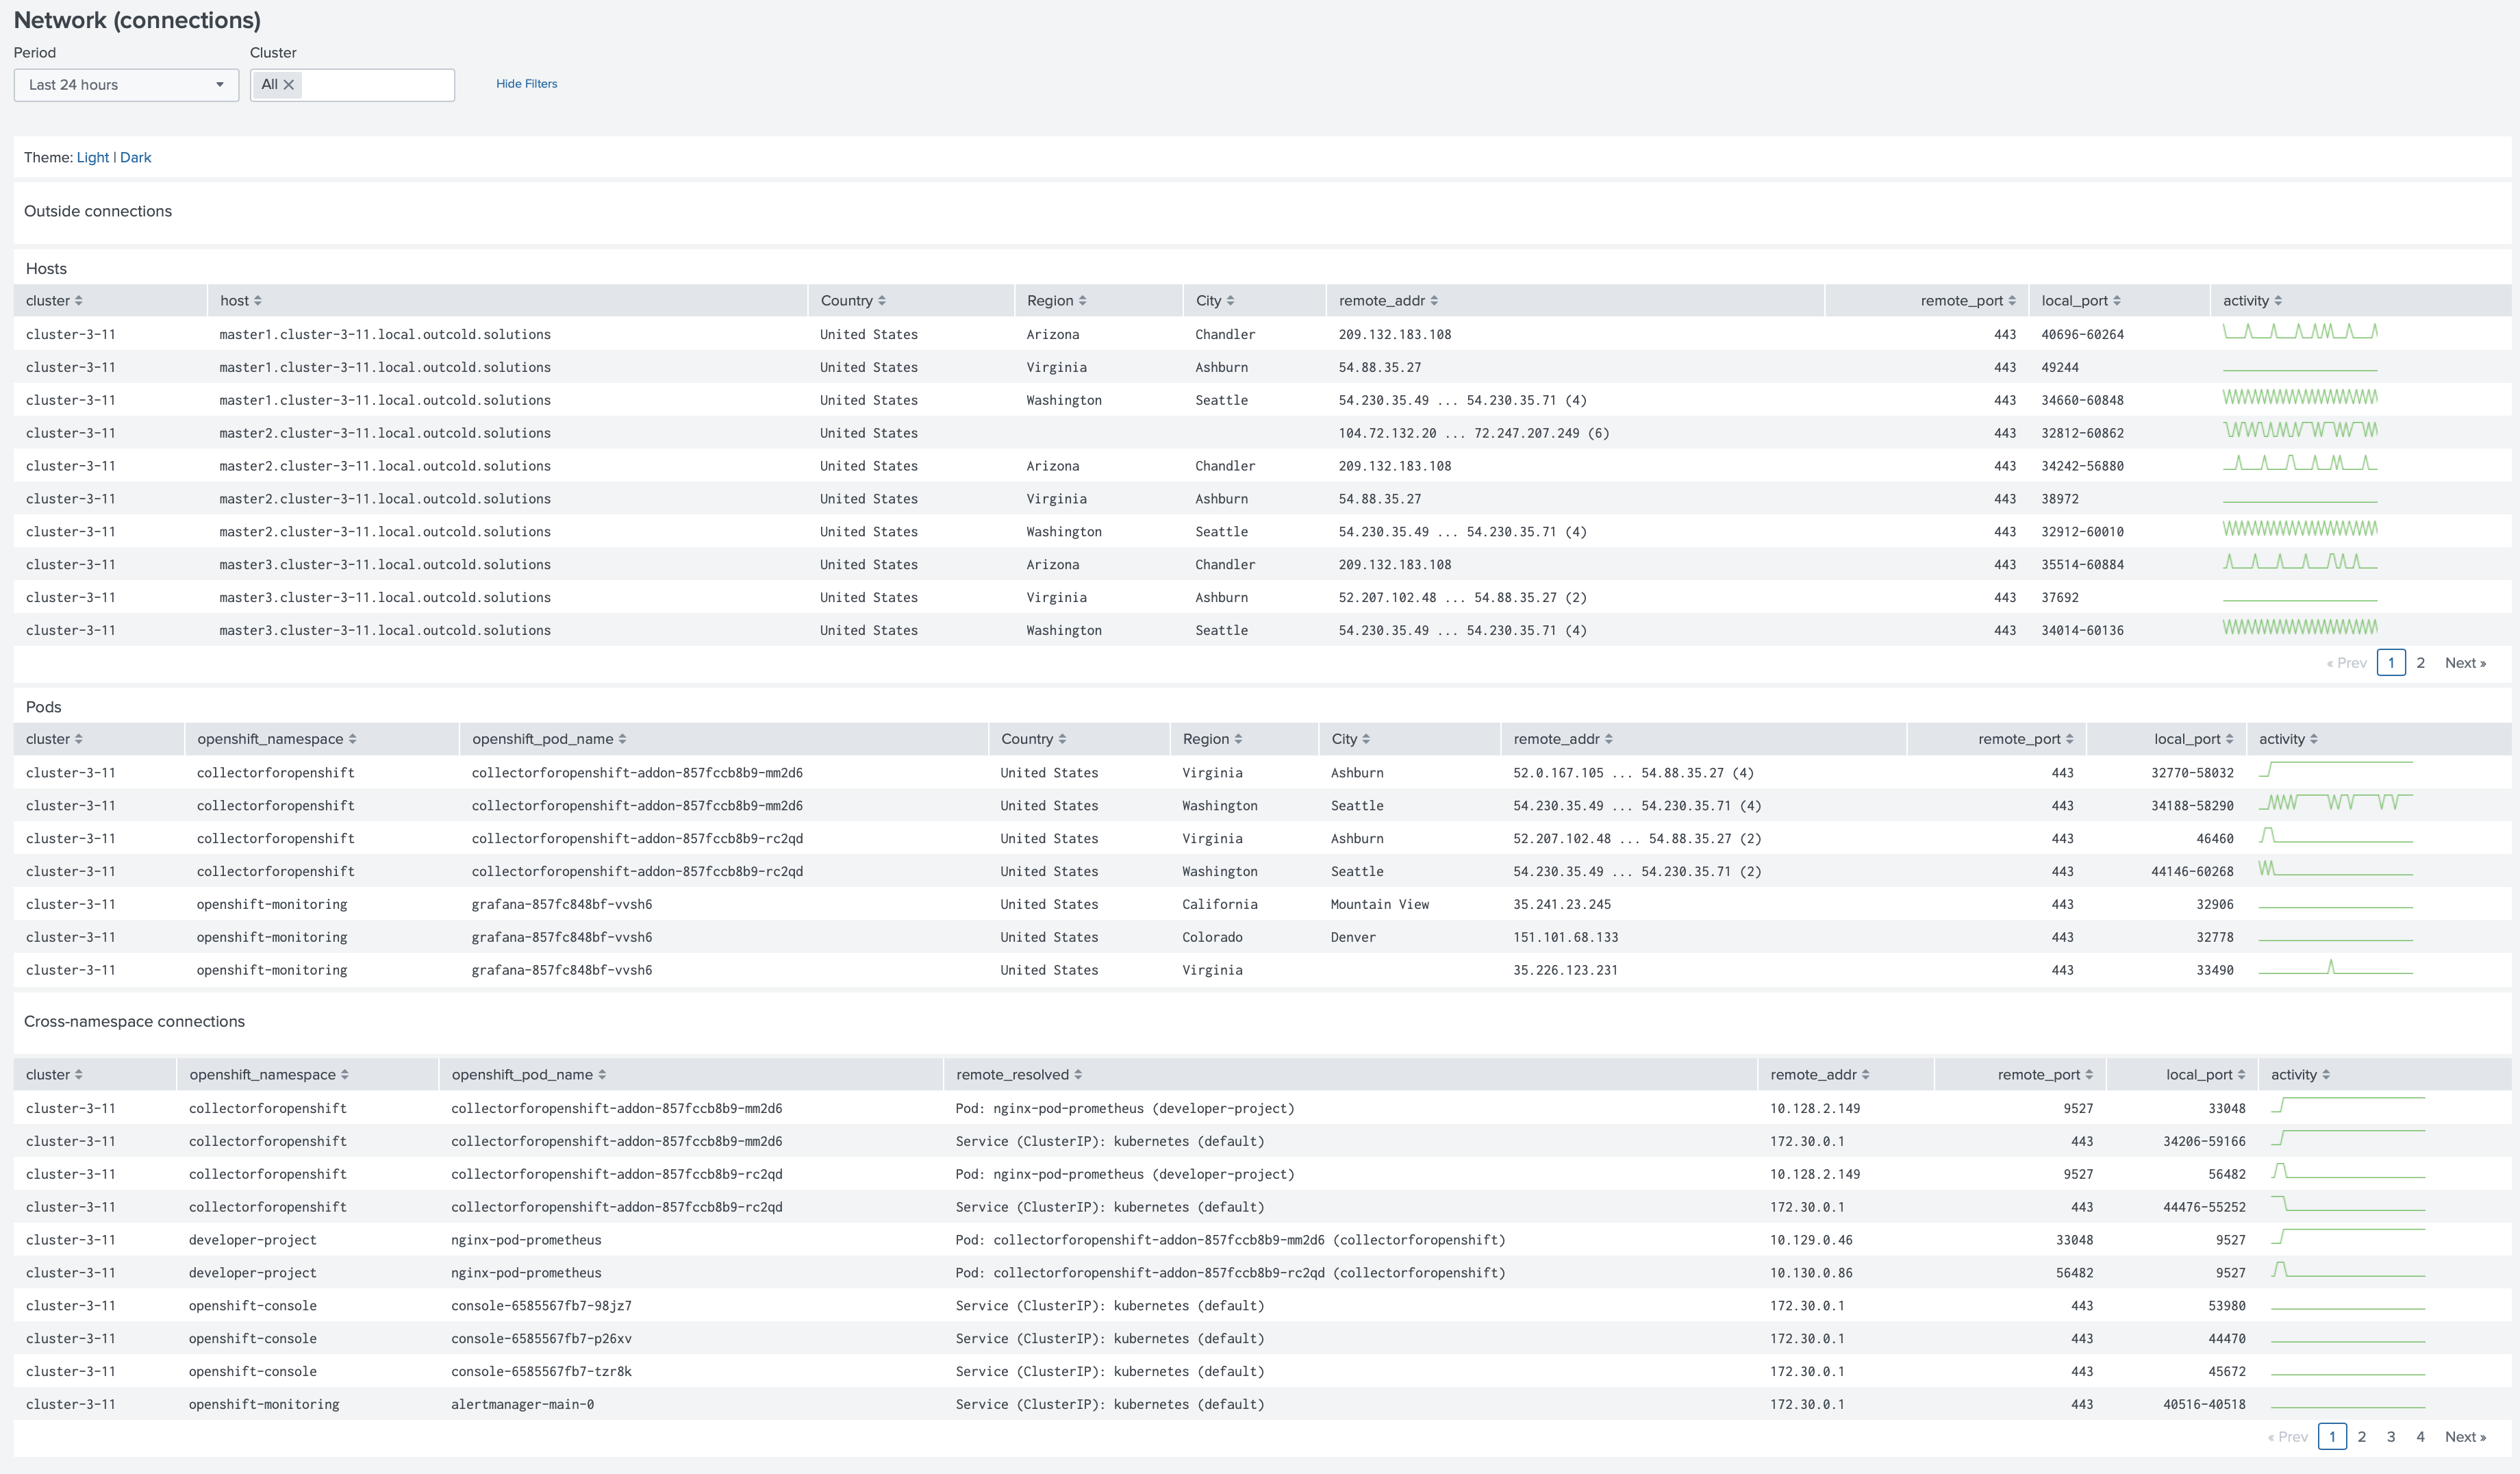
Network (connections)
Review the connections from your nodes and namespaces, track cross-namespace connections.
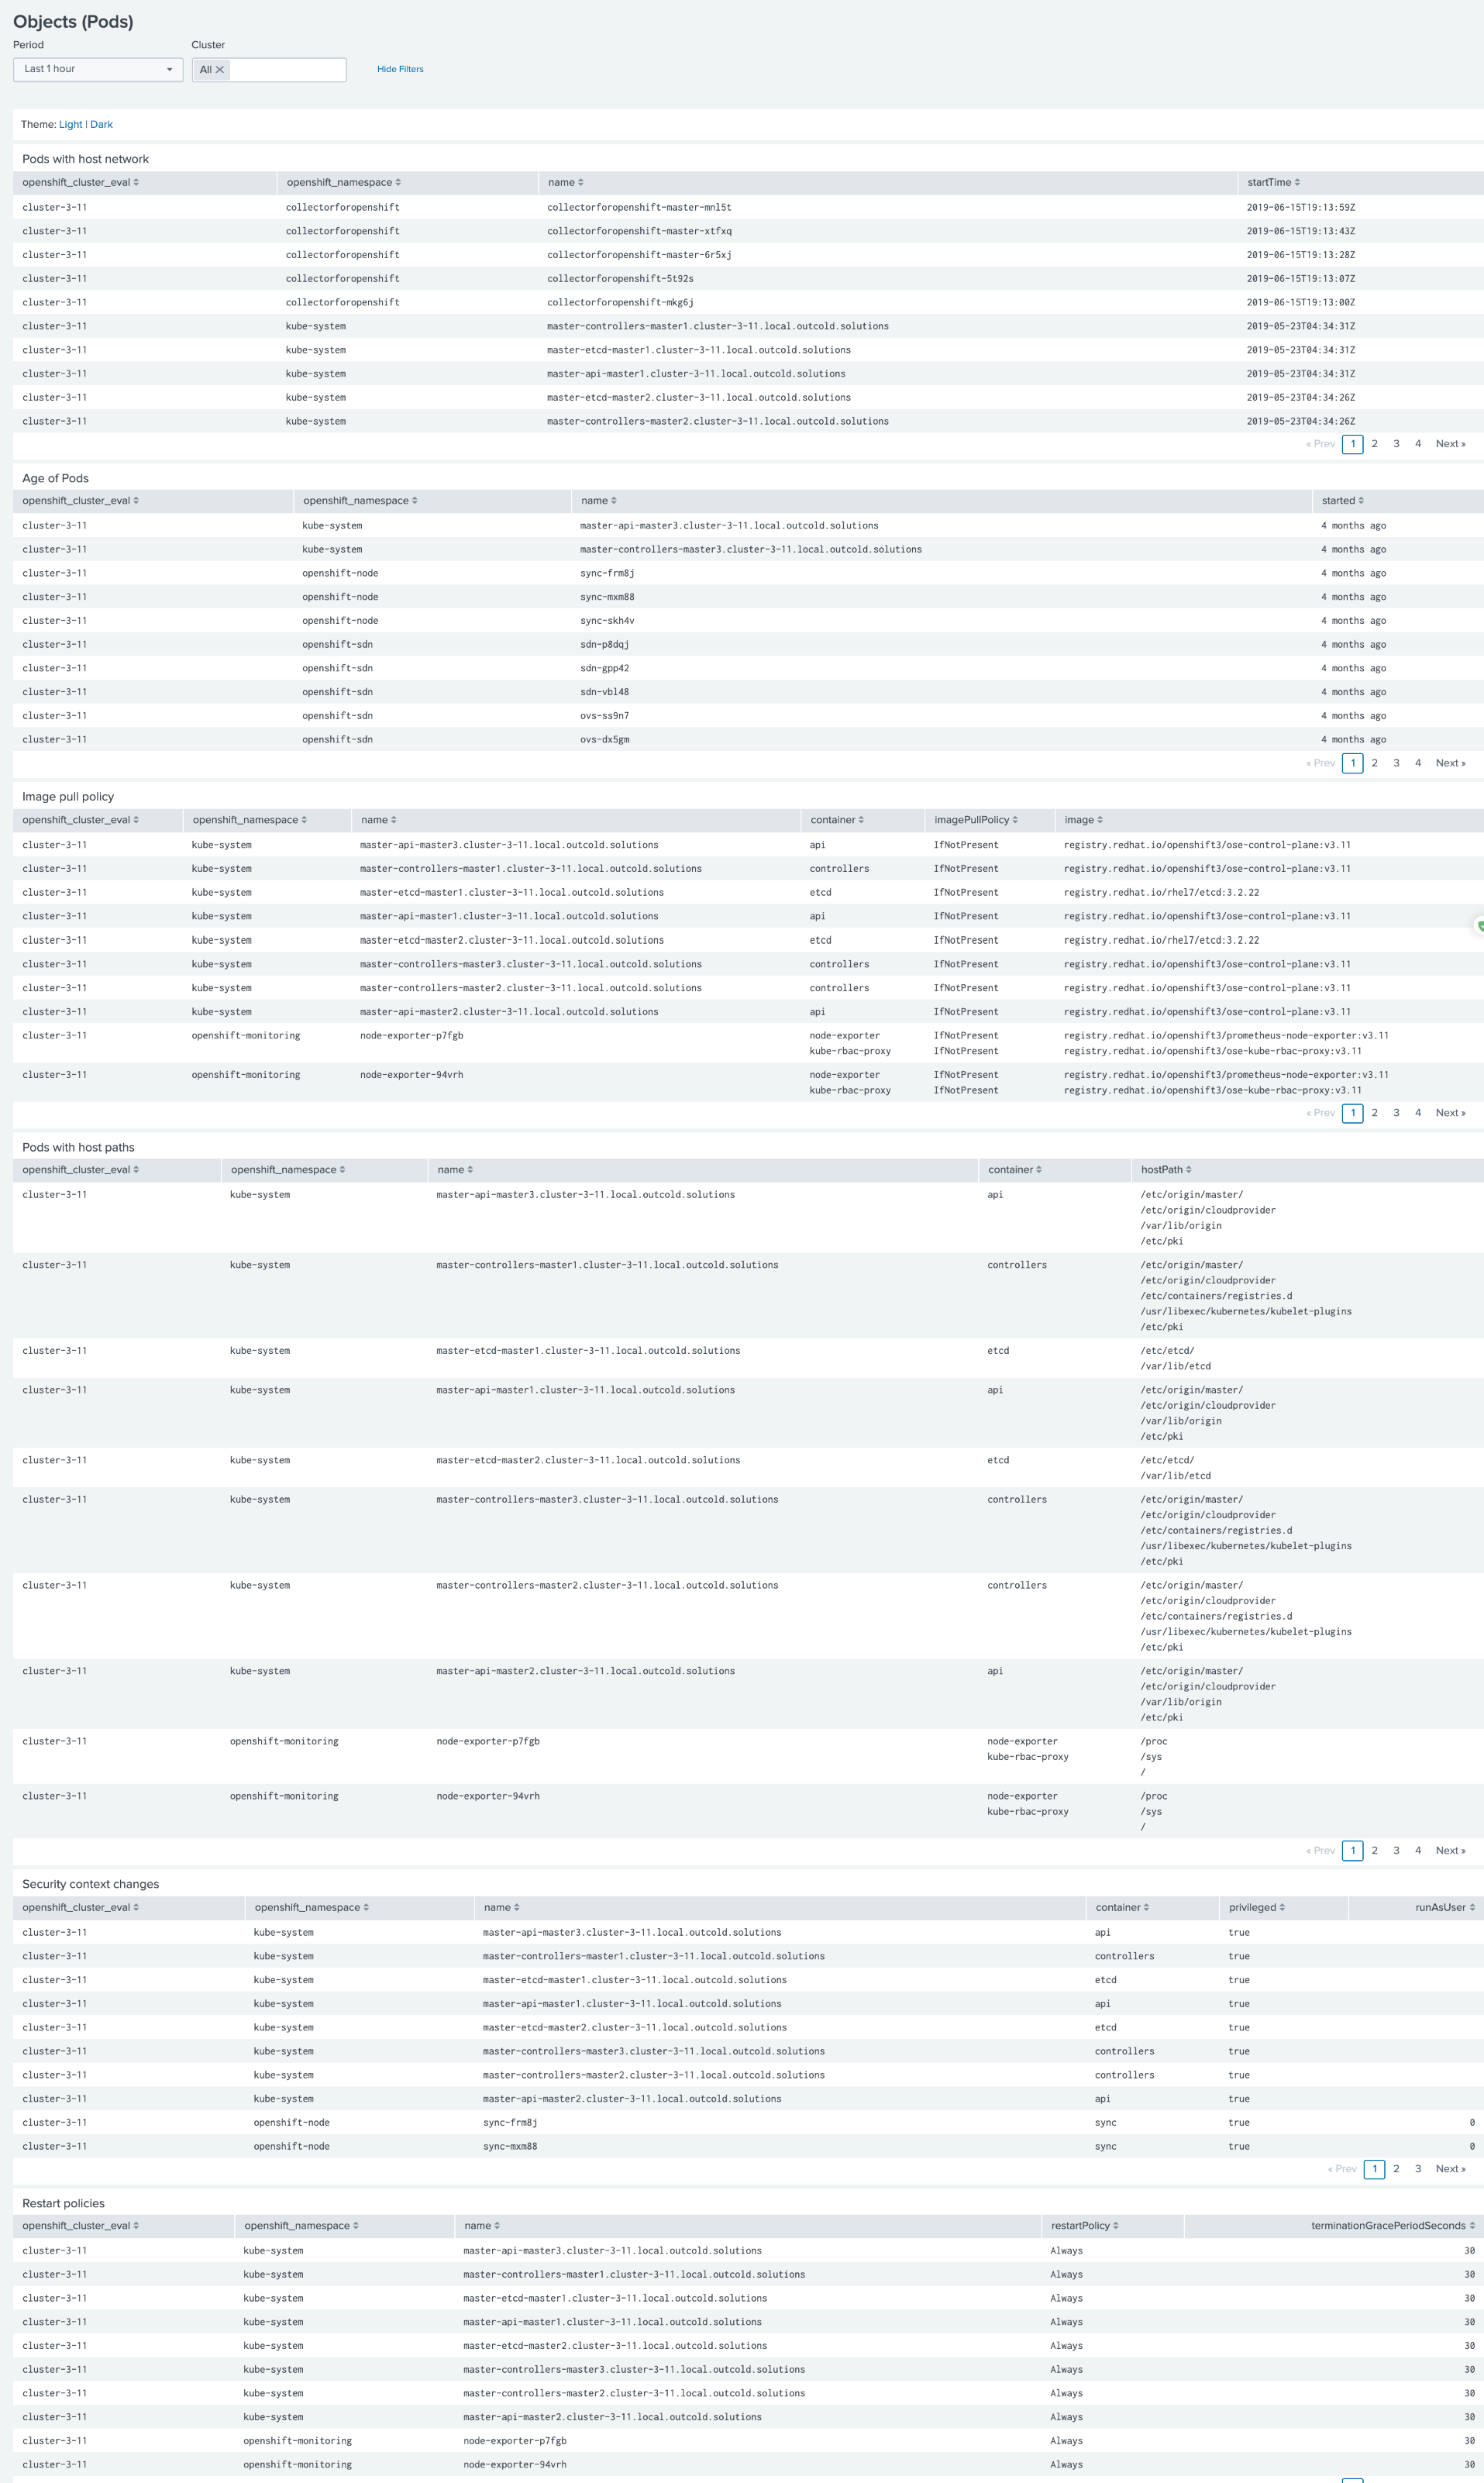
Objects (pods)
This dashboard is based on the streaming of Pods objects from API server. Now you can review all pods that are running on the host network, pods age (if you have a policy how often the pods need to be updated), review image pull policy and image versions, review all pods that mount host paths, and pods that change their security context.
Improved Multi-cluster monitoring
With the previous releases, we suggested to use node labels (or docker engine labels) for identifying the cluster names. Although an easy to use solution, it’s not always available in cases when you don’t have control over your cluster.
We have introduced custom fields in earlier versions. Custom fields can be attached to any data that collectord forwards
to Splunk. Now we use custom fields to help you identify the clusters in our applications. For backward compatibility we extract the cluster name from node labels cluster as well. If you have a different node label that identifies your clusters, you will have to update calc fields kubernetes_cluster_eval,
openshift_cluster_eval or docker_cluster_eval accordingly. Or you can just switch to the
custom fields as described in our installation instructions.
In case of OpenShift just update the ConfigMap (make sure to restart pods after update)
1[general]
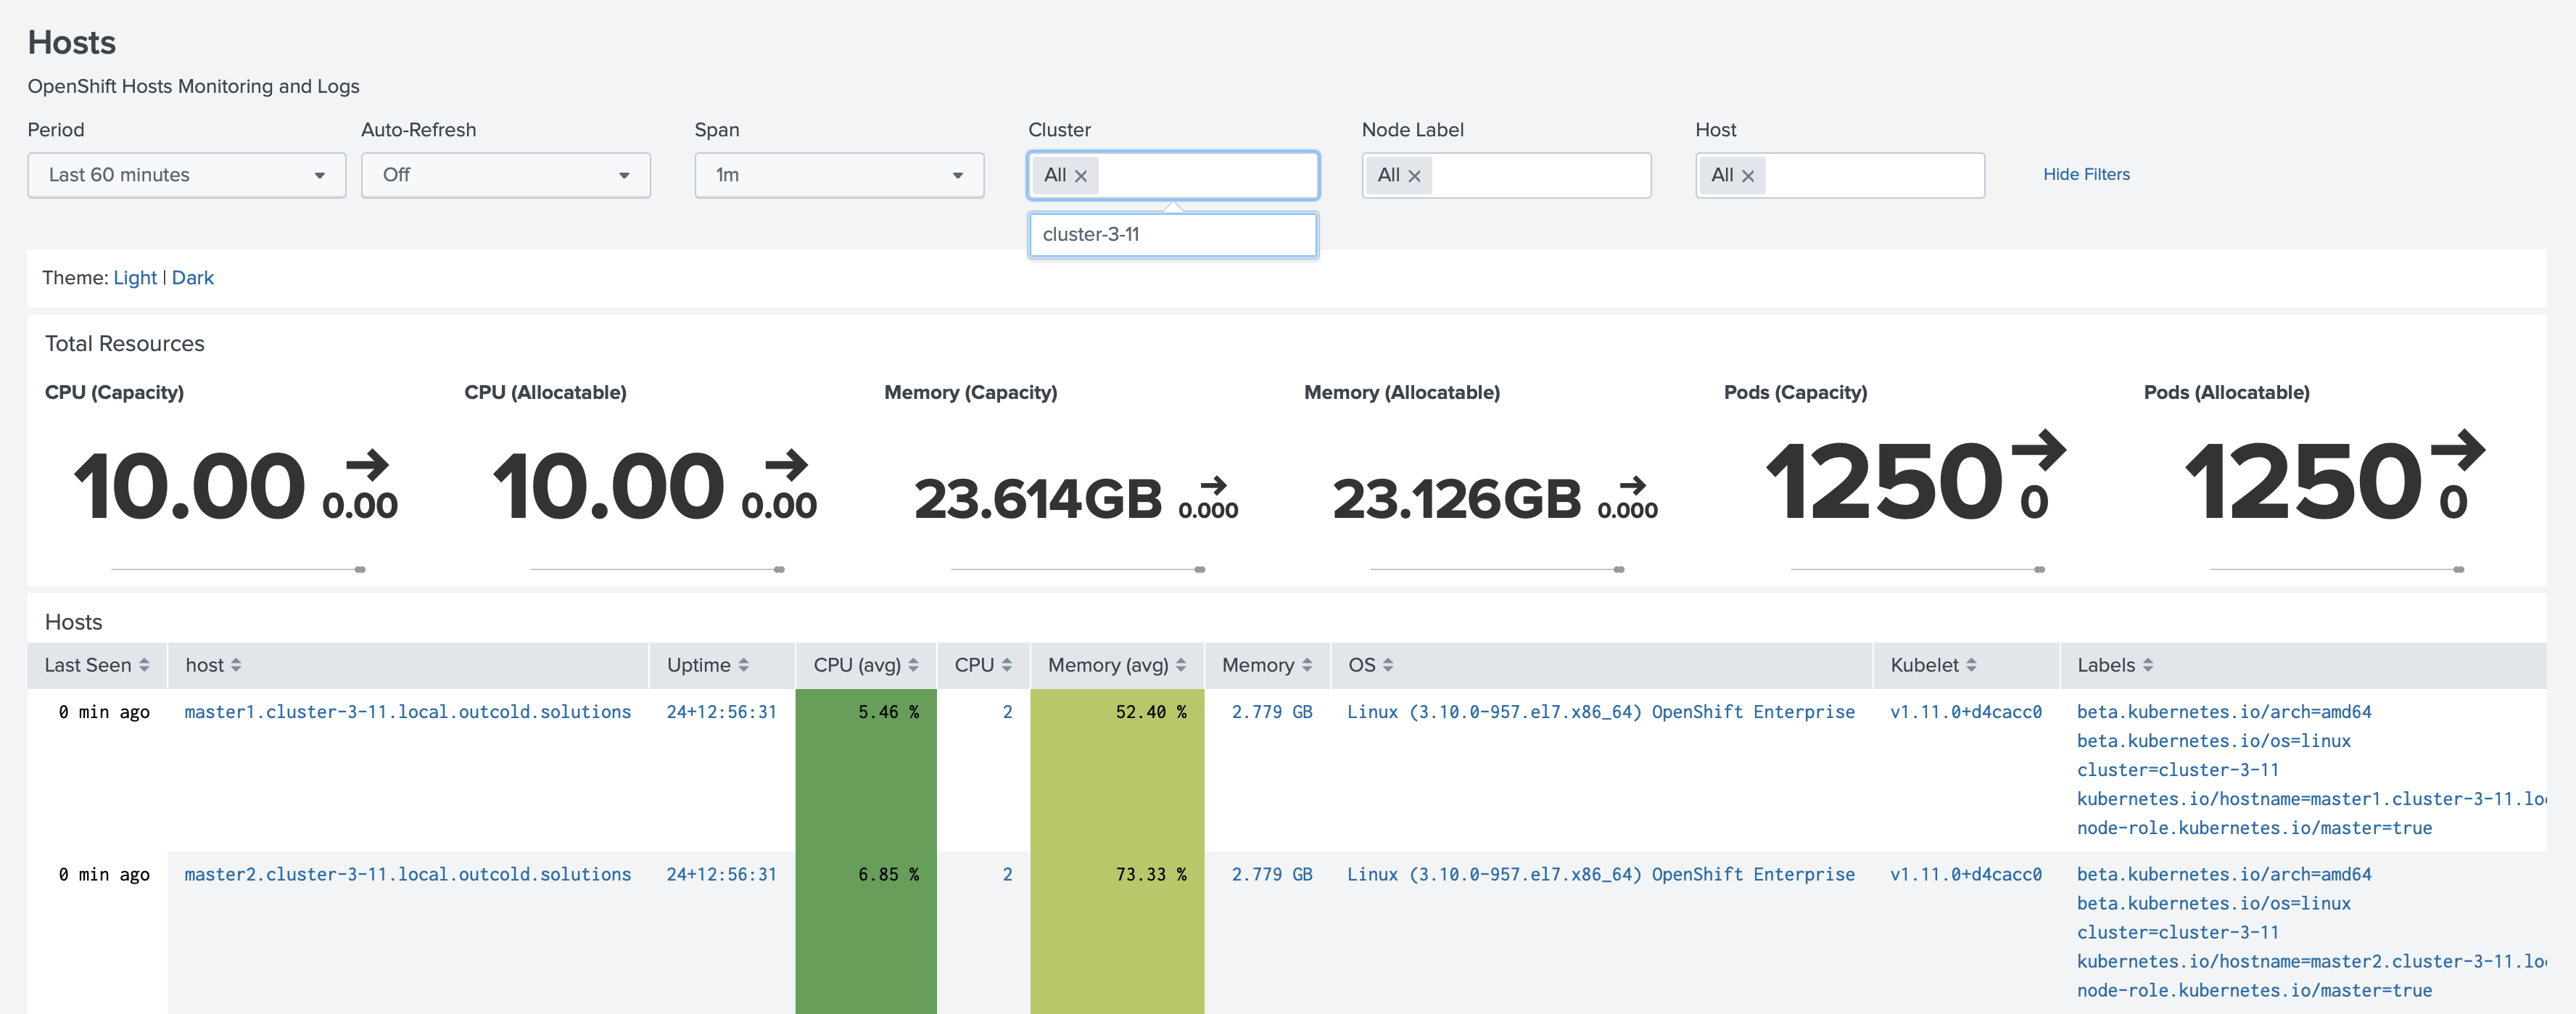
2fields.openshift_cluster = developmentMost dashboards in the application have a filter Cluster that can help you filter the data from a specific
cluster.
- Monitoring OpenShift v5 - Installation
- Monitoring Kubernetes v5 - Installation
- Monitoring Docker v5 - Installation
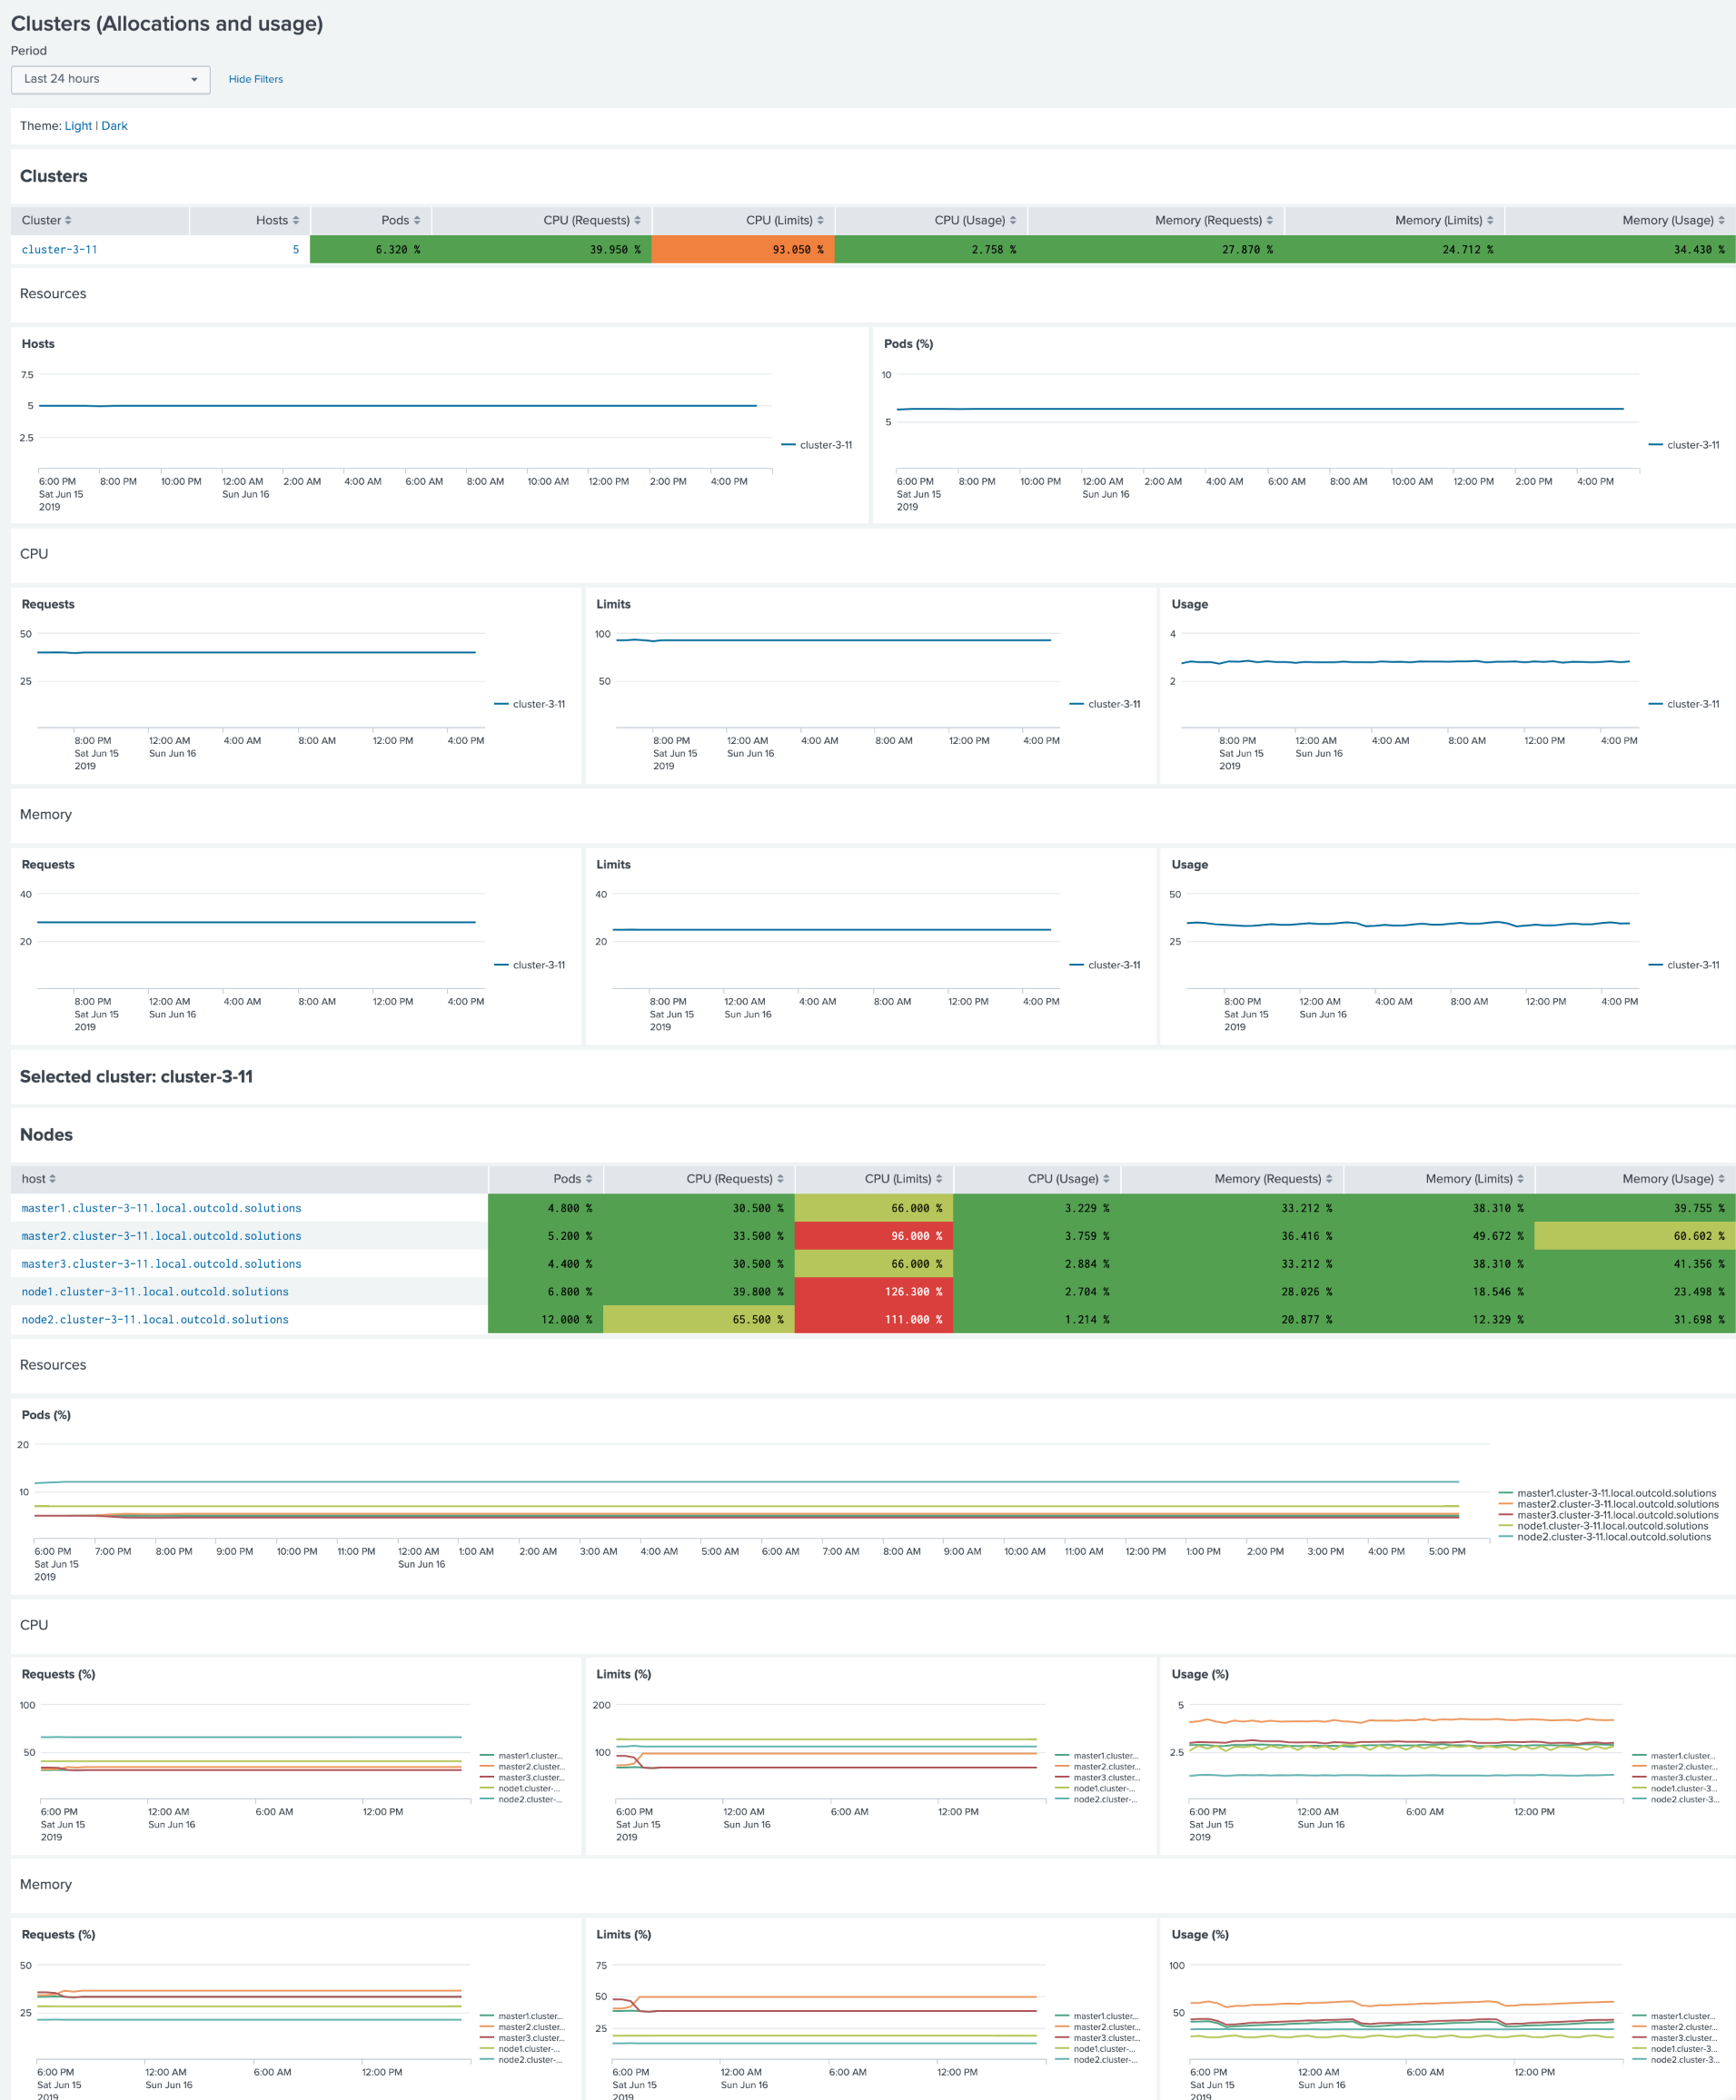
Dashboard: Clusters (Allocations and usage)
For multi-cluster setups we also included a dashboard that can help you to review allocations and usage for the clusters.
Improved support for custom sourcetypes
You can override sourcetypes for the container logs with the annotations collectord.io/logs-type=.... Before release 5.10, you would need to update the macro macro_openshift_logs (in case of OpenShift) to be
able to see these logs in our application. Starting from version 5.10, we will identify logs by source /openshift/logs/...,
/kubernetes/logs/... and /docker/logs/..., so now you can easily change the sourcetype without worrying about updating
macros.
Base macro for configuring indexes
With version 5.10 we introduced a base macro that can help you configure indexes by modifying only base macros macro_docker_base, macro_openshift_base or macro_kubernetes_base.
- Monitoring OpenShift v5 - Splunk Indexes
- Monitoring Kubernetes v5 - Splunk Indexes
- Monitoring Docker v5 - Splunk Indexes
Improved support for OpenShift 4.x
We’ve updated our configuration page with the instructions on how to install Monitoring OpenShift for OpenShift 4.x following the public release.
For OpenShift 4.x we also provide RHEL8 certified images with the prefix -ubi8, built from base images -ubi8-minimal.
You can find configuration for OpenShift 4.x that refers to -ubi8 images.
Support for volatile journald storage
With 5.10 we can automatically forward logs from the journald volatile storage. Please refer to our updated configurations. We include a mount for /run/log and allow you to configure multiple paths for input.journald.
Links
You can find more information about other minor updates by following the links below.
Release notes
- Monitoring OpenShift - Release notes
- Monitoring Kubernetes - Release notes
- Monitoring Docker - Release notes


