Blog
Monitoring Kubernetes on Mesosphere DC/OS with Splunk Enterprise and Splunk Cloud
If you are using Kubernetes on Mesosphere DC/OS you can find that our default configuration does not provide all the metrics and information out of the box. In this blog post we will guide you through all the configuration changes to get all the information you need to monitor the health of your clusters and performance of your applications.
We used Quickstart guide for Kubernetes on DC/OS on AWS as an example.
Fix for the cgroup filesystem
If you run the troubleshooting command verify on
one of the collectorforkubernetes Pods you can find that it fails to find the cgroups for the Pods and Containers.
1  Kubernetes configuration:
2  + api: OK
3  x pod cgroup: FAILED
4    pods = 0 (with cgroup filter = ^/([^/\s]+/)*kubepods(\.slice)?/((kubepods-)?(burstable|besteffort)(\.slice)?/)?([^/]*)pod([0-9a-f]{32}|[0-9a-f\-_]{36})(\.slice)?$)
5  x container cgroup: FAILED
6    containers = 0 (with cgroup filter = ^/([^/\s]+/)*kubepods(\.slice)?/((kubepods-)?(burstable|besteffort)(\.slice)?/)?([^/]*)pod([0-9a-f]{32}|[0-9a-f\-_]{36})(\.slice)?/(docker-|crio-)?[0-9a-f]{64}(\.scope)?(\/.+)?$)
7  + volumes root: OK
8  + runtime: OK
9    docker
This is because we mount the cgroup filesystem under /rootfs/sys/fs/cgroup and if you look at the different
types of the cgroups
1/rootfs/sys/fs/cgroup# ls -alh
2total 0
3drwxr-xr-x. 13 root root 340 Apr  3 22:48 .
4drwxr-xr-x.  7 root root   0 Apr  3 22:48 ..
5drwxr-xr-x.  3 root root   0 Apr  3 22:48 blkio
6lrwxrwxrwx.  1 root root  26 Apr  3 22:48 cpu -> /sys/fs/cgroup/cpu,cpuacct
7drwxr-xr-x.  3 root root   0 Apr  3 22:48 cpu,cpuacct
8lrwxrwxrwx.  1 root root  26 Apr  3 22:48 cpuacct -> /sys/fs/cgroup/cpu,cpuacct
you’ll realize that these links are broken. Cgroup cpu points to the /sys/fs/cgroup/cpu,cpuacct, when it should
point to the /rootfs/sys/fs/cgroup/cpu,cpuacct (or better ./cpu,cpuacct). To fix that, you can mount cgroups inside the
container in our configuration differently. In both DaemonSets collectorforkubernetes and collectorforkubernetes-master
change the volumeMounts from
1        - name: cgroup
2          mountPath: /rootfs/sys/fs/cgroup
3          readOnly: true
To
 1        - name: cgroup-cpu
 2          mountPath: /rootfs/sys/fs/cgroup/cpu
 3          readOnly: true
 4        - name: cgroup-cpu
 5          mountPath: /rootfs/sys/fs/cgroup/cpuacct
 6          readOnly: true
 7        - name: cgroup-blkio
 8          mountPath: /rootfs/sys/fs/cgroup/blkio
 9          readOnly: true
10        - name: cgroup-memory
11          mountPath: /rootfs/sys/fs/cgroup/memory
12          readOnly: true
And change the volumes from
1     - name: cgroup
2       hostPath:
3         path: /sys/fs/cgroup
To
1      - name: cgroup-cpu
2        hostPath:
3          path: /sys/fs/cgroup/cpu,cpuacct
4      - name: cgroup-blkio
5        hostPath:
6          path: /sys/fs/cgroup/blkio
7      - name: cgroup-memory
8        hostPath:
9          path: /sys/fs/cgroup/memory
After applying the change you can run the verify command again and should see that it fixed the problem
1  Kubernetes configuration:
2  + api: OK
3  + pod cgroup: OK
4    pods = 7
5  + container cgroup: OK
6    containers = 16
7  + volumes root: OK
8  + runtime: OK
9    docker
Pods from DaemonSets collectorforkubernetes-master fail to start
If you see that Pods from the DaemonSet collectorforkubernetes-master fail to start with CrashLoopBackOff look at
the events for this Pod with
1kubectl describe pod --namespace collectorforkubernetes collectorforkubernetes-master-wbv62If you find something similar to
1Events:
2  Warning  Failed     2m33s (x4 over 3m20s)  kubelet, kube-control-plane-0-instance.devkubernetes01.mesos  Error: failed to start container "collectorforkubernetes": Error response from daemon: OCI runtime create failed: container_linux.go:337: starting container process caused "process_linux.go:403: container init caused \"process_linux.go:368: setting cgroup config for procHooks process caused \\\"failed to write 200000 to cpu.cfs_quota_us: write /sys/fs/cgroup/cpu,cpuacct/kubepods/burstable/pod2889c500-5665-11e9-a692-a6728d2eb688/collectorforkubernetes/cpu.cfs_quota_us: invalid argument\\\"\"": unknown
That means that the parent cgroup has a lower limit for the CPU. Change the limits for the collectorforkubernetes-master
DaemonSet to 1000m or 500m. In our case we see that the parent cgroup for the master pods has a cpu.cfs_quota_us
equal to 160000 (1600m)
1cat 7d57d61b-4c0f-4133-b658-bdfa902f67b2/cpu.cfs_quota_us
2160000
After lowering the CPU, apply the configuration and you should now see that the Pods from the collectorforkubernetes-master
are scheduled on the master nodes.
CoreDNS metrics
If you want to collect coredns metrics, just run the command to attach the annotation to tell Collectord to start
forwarding metrics from coredns pods to Splunk
1kubectl annotate deployment/coredns --namespace kube-system 'collectord.io/prometheus.1-path=/metrics' 'collectord.io/prometheus.1-port=9153' 'collectord.io/prometheus.1-source=coredns' --overwrite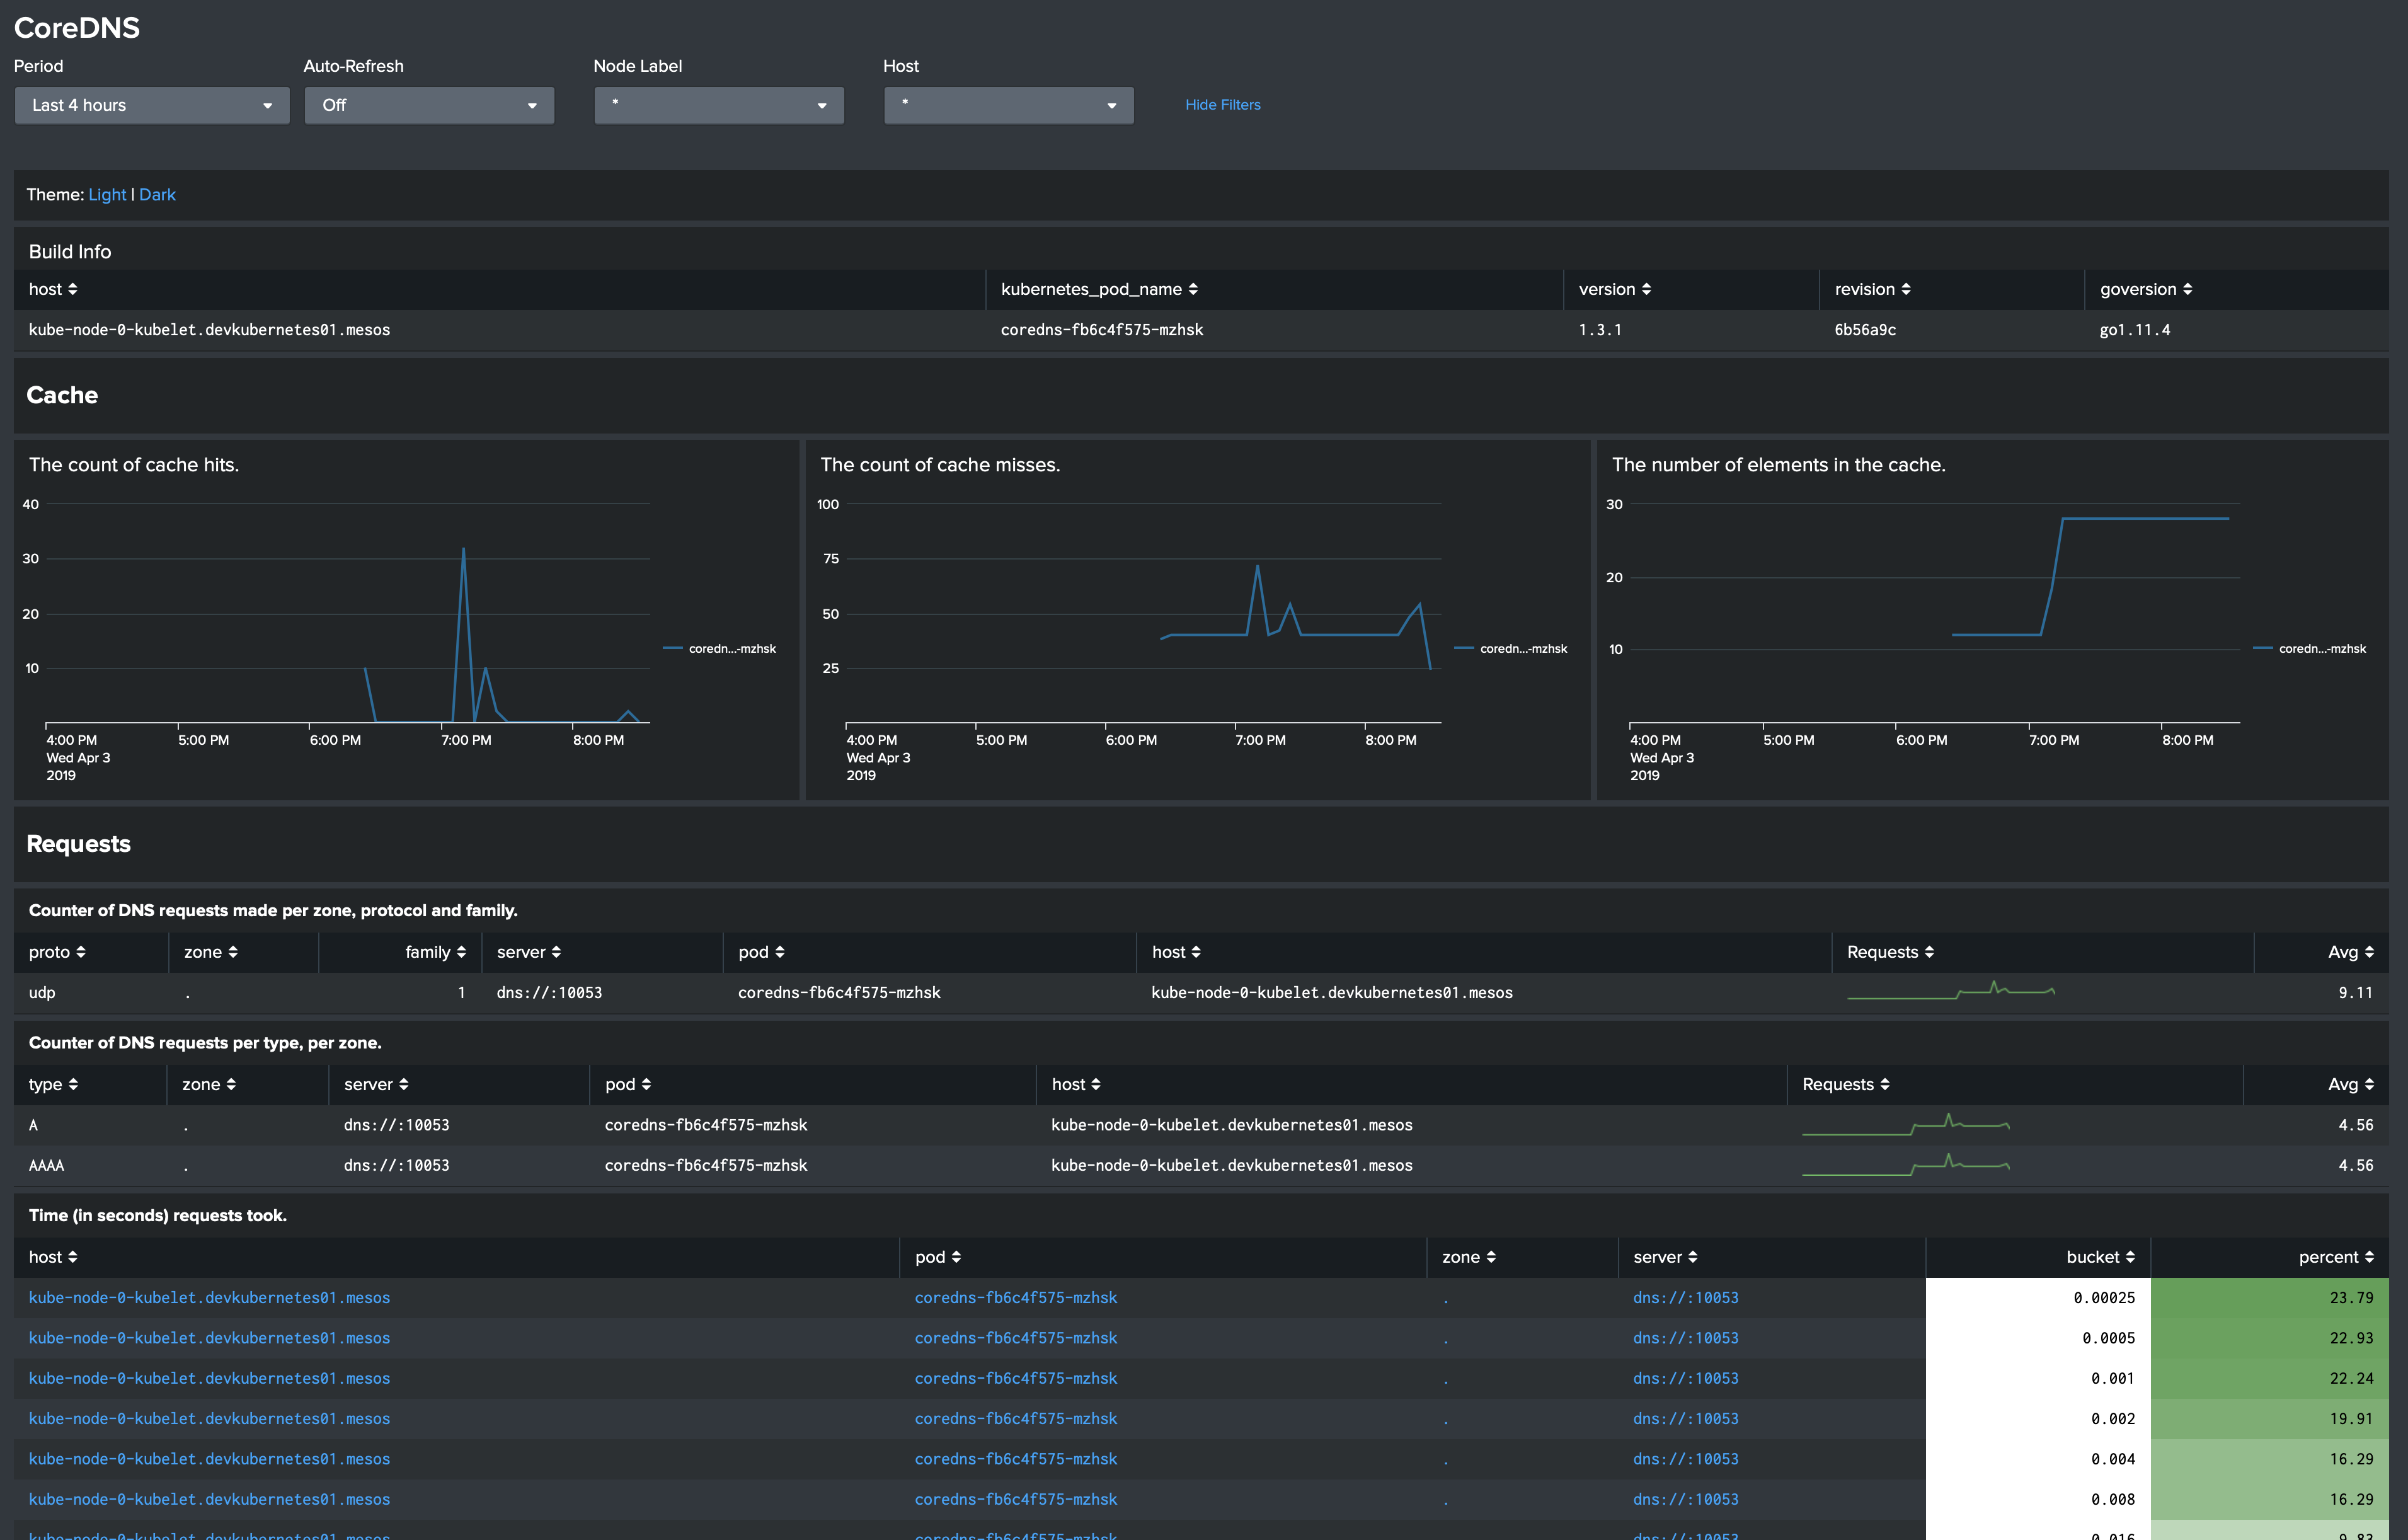
etcd metrics
To be able to monitor the etcd cluster with our application Monitoring Kubernetes for Splunk Enterprise and Splunk Cloud
you need to retrieve etcd certificates from the Kubernetes API pod, and modify the configuration of the collectorforkubernetes.yaml.
To retrieve the certificates from the Kubernetes API, just find the name of one of the Pods with the kube-apiserver and copy
3 files ca-crt.pem, kube-apiserver-crt.pem and kube-apiserver-key.pem
1kubectl cp --namespace kube-system kube-apiserver-kube-control-plane-0-instance.devkubernetes01.mesos:/data/ca-crt.pem .
2kubectl cp --namespace kube-system kube-apiserver-kube-control-plane-0-instance.devkubernetes01.mesos:/data/kube-apiserver-crt.pem .
3kubectl cp --namespace kube-system kube-apiserver-kube-control-plane-0-instance.devkubernetes01.mesos:/data/kube-apiserver-key.pem .
Create a secret etcd-cert in the collectorforkubernetes namespace from the just-retrieved files
1kubectl create secret generic --namespace collectorforkubernetes etcd-cert --from-file=./ca-crt.pem --from-file=./kube-apiserver-crt.pem --from-file=./kube-apiserver-key.pemNow you need to modify the collectorforkubernetes.yaml configuration. First find the stanza [input.prometheus::etcd]
and disable it with disabled=true. We use this configuration when etcd is deployed on the master nodes.
In the ConfigMap file 004-addon.conf, add the following configuration for each etcd cluster member
 1    [input.prometheus::etcd-0]
 2    disabled = false
 3    type = kubernetes_prometheus
 4    index =
 5    host = etcd-0-peer.devkubernetes01
 6    source = etcd
 7    interval = 60s
 8    endpoint.https = https://etcd-0-peer.devkubernetes01.autoip.dcos.thisdcos.directory:2379/metrics
 9    tokenPath =
10    certPath = /etcd-cert/ca-crt.pem
11    clientCertPath = /etcd-cert/kube-apiserver-crt.pem
12    clientKeyPath = /etcd-cert/kube-apiserver-key.pem
13    insecure = false
14    includeHelp = false
15    output =
16
17    [input.prometheus::etcd-1]
18    disabled = false
19    type = kubernetes_prometheus
20    index =
21    host = etcd-0-peer.devkubernetes01
22    source = etcd
23    interval = 60s
24    endpoint.https = https://etcd-1-peer.devkubernetes01.autoip.dcos.thisdcos.directory:2379/metrics
25    tokenPath =
26    certPath = /etcd-cert/ca-crt.pem
27    clientCertPath = /etcd-cert/kube-apiserver-crt.pem
28    clientKeyPath = /etcd-cert/kube-apiserver-key.pem
29    insecure = false
30    includeHelp = false
31    output =
32
33    [input.prometheus::etcd-2]
34    disabled = false
35    type = kubernetes_prometheus
36    index =
37    host = etcd-0-peer.devkubernetes01
38    source = etcd
39    interval = 60s
40    endpoint.https = https://etcd-2-peer.devkubernetes01.autoip.dcos.thisdcos.directory:2379/metrics
41    tokenPath =
42    certPath = /etcd-cert/ca-crt.pem
43    clientCertPath = /etcd-cert/kube-apiserver-crt.pem
44    clientKeyPath = /etcd-cert/kube-apiserver-key.pem
45    insecure = false
46    includeHelp = false
47    output =
You can find the URLs of the etcd members in the configuration for the kube-apiserver
1kubectl describe --namespace kube-system pod kube-apiserver-kube-control-plane-0-instance.devkubernetes01.mesos | grep etcd-servers
2      --etcd-servers=https://etcd-0-peer.devkubernetes01.autoip.dcos.thisdcos.directory:2379
And the last step, mount the etcd-cert secret to the collectorforkubernetes-addon Deployment in the collectorforkubernetes.yaml
 1apiVersion: apps/v1
 2kind: Deployment
 3metadata:
 4  name: collectorforkubernetes-addon
 5  ...
 6spec:
 7  ...
 8  template:
 9    ...
10    spec:
11      ...
12      containers:
13      - name: collectorforkubernetes
14      ...
15      volumeMounts:
16        ...
17        - name: etcd-cert
18          mountPath: /etcd-cert/
19          readOnly: true
20    volumes:
21      ...
22    - name: etcd-cert
23      secret:
24        secretName: etcd-cert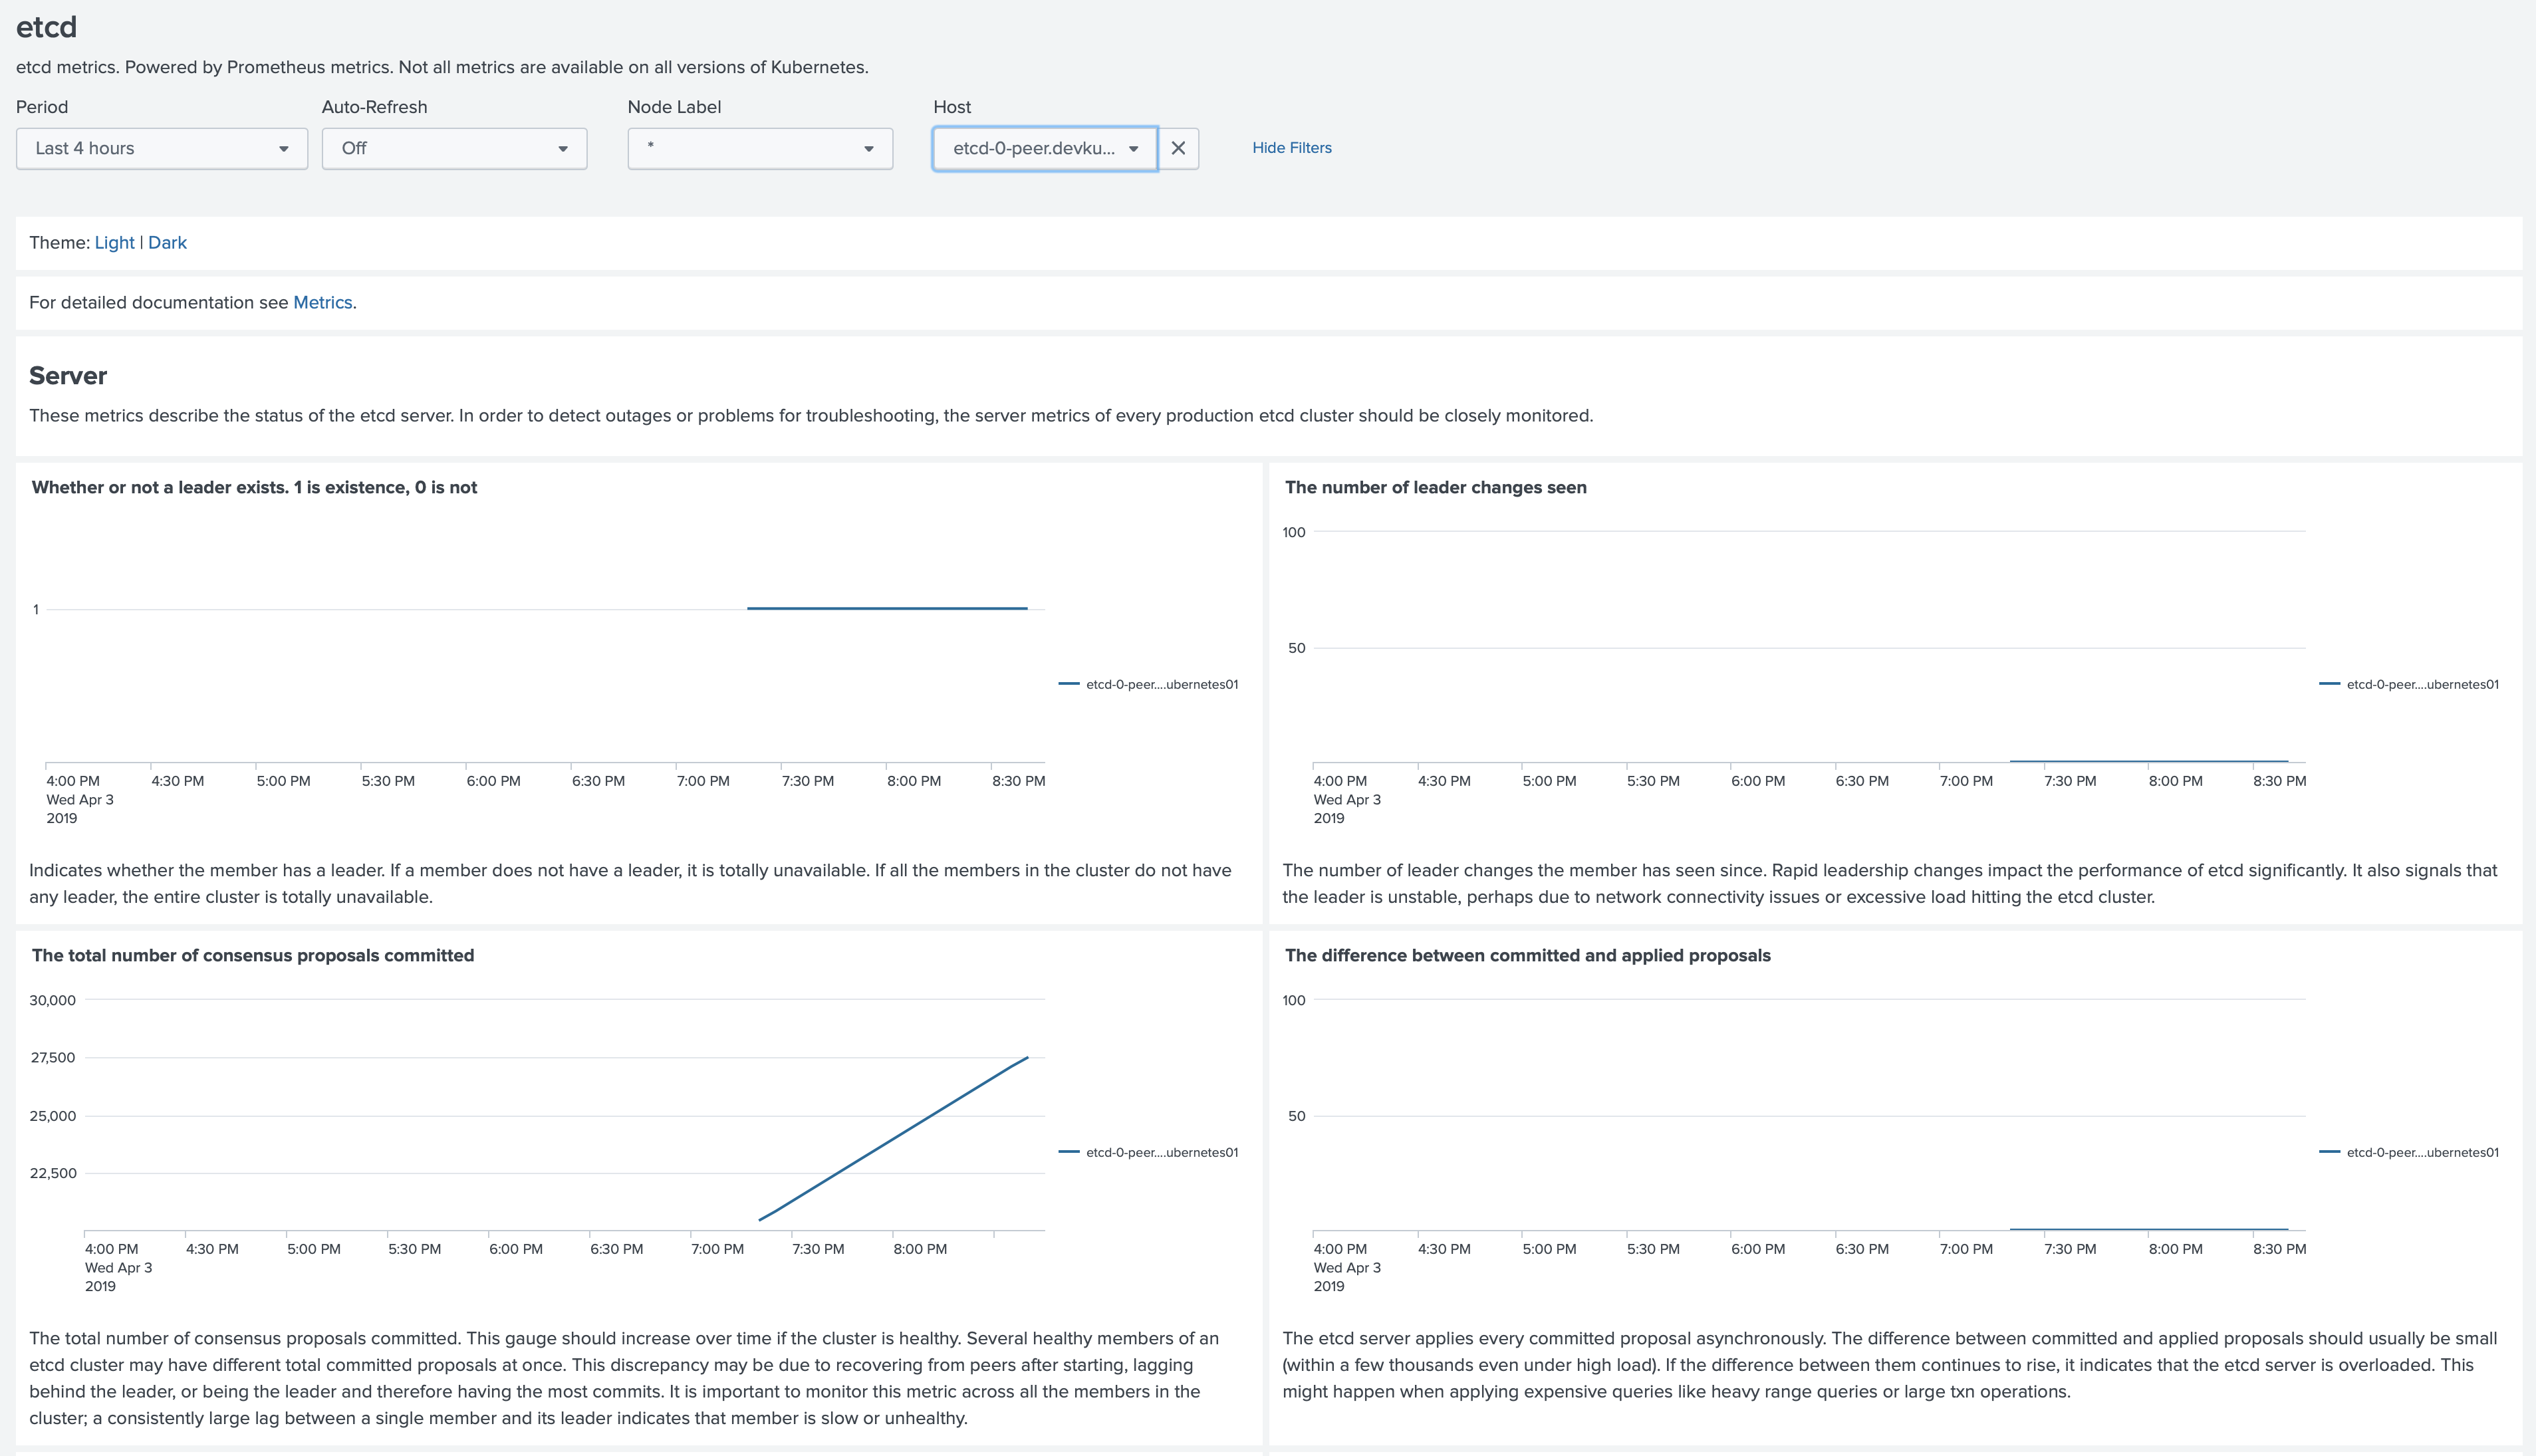
Now you have all the features of the Monitoring Kubernetes application that will help you to monitor the health of the Kubernetes cluster and performance of your applications running on Kubernetes clusters deployed with Mesosphere DC/OS.


