Blog
Reduce Splunk Licensing cost for container logs
Not all logs that are created are equal. Some are needed for debugging purposes, some for auditing and security, some for troubleshooting. Depending on the type of logs, different approaches could be used to reduce licensing cost. Let’s go over some of them.
We will use OpenShift as an example in this blog post, but you can apply this to the Kubernetes and Docker logs as well.
Timestamps in log messages
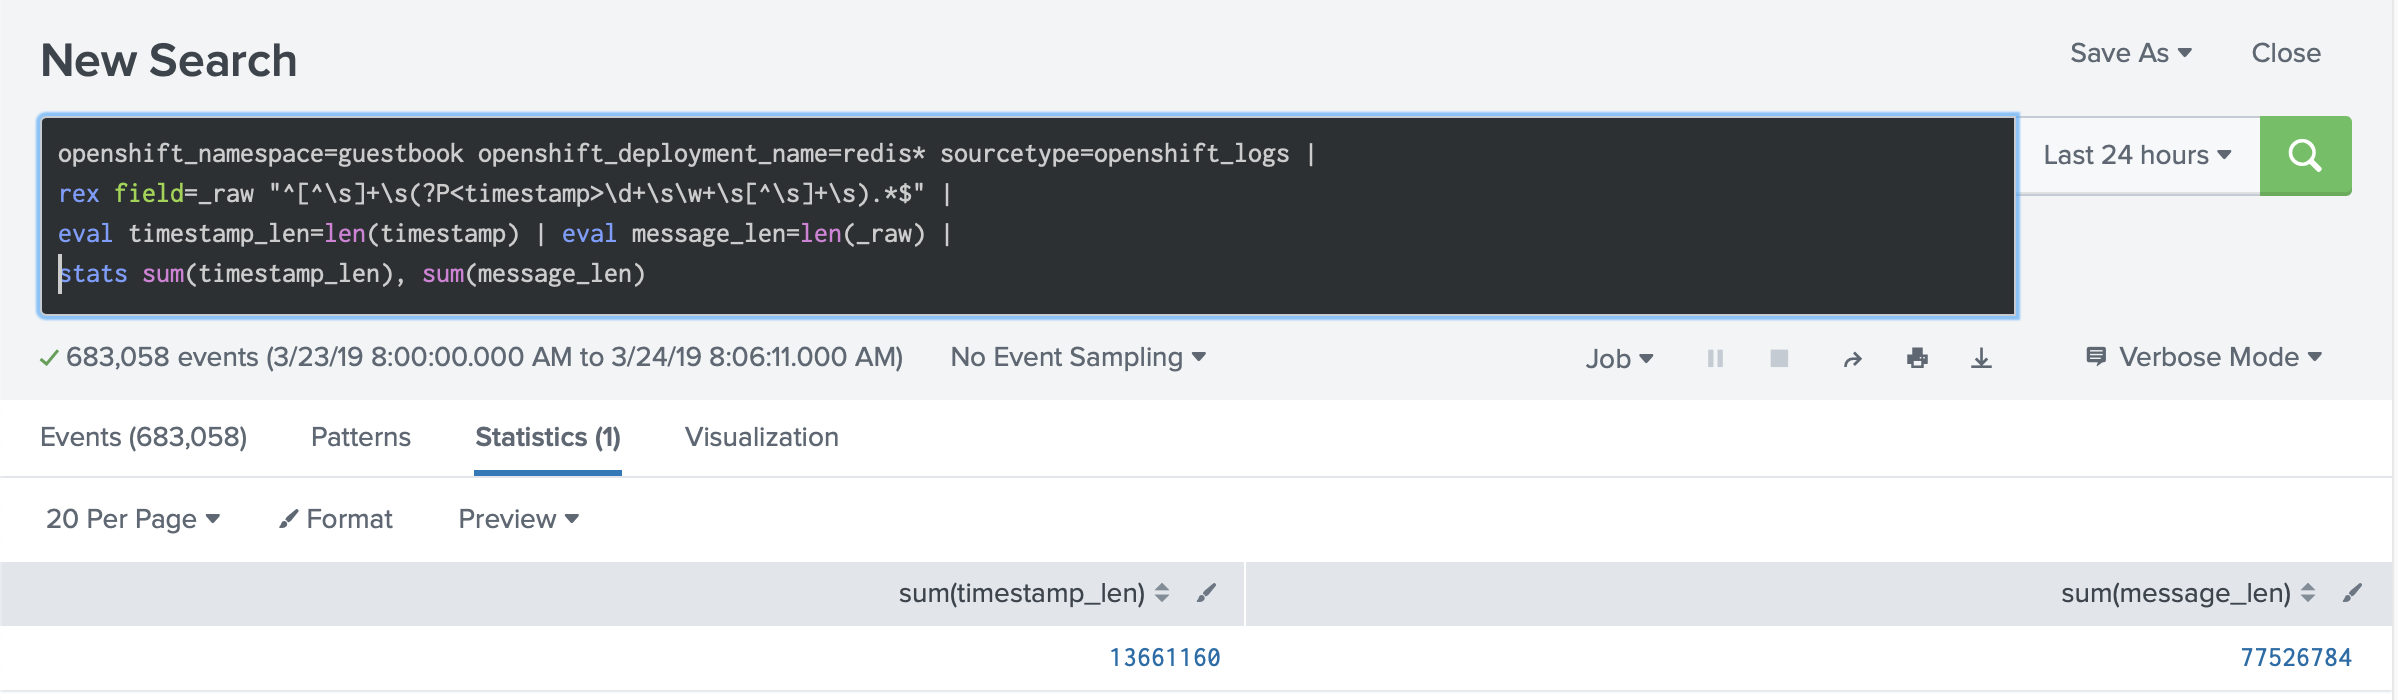
Most applications forward timestamps with every line. Let’s take a look at the guestbook example, which uses Redis deployments.
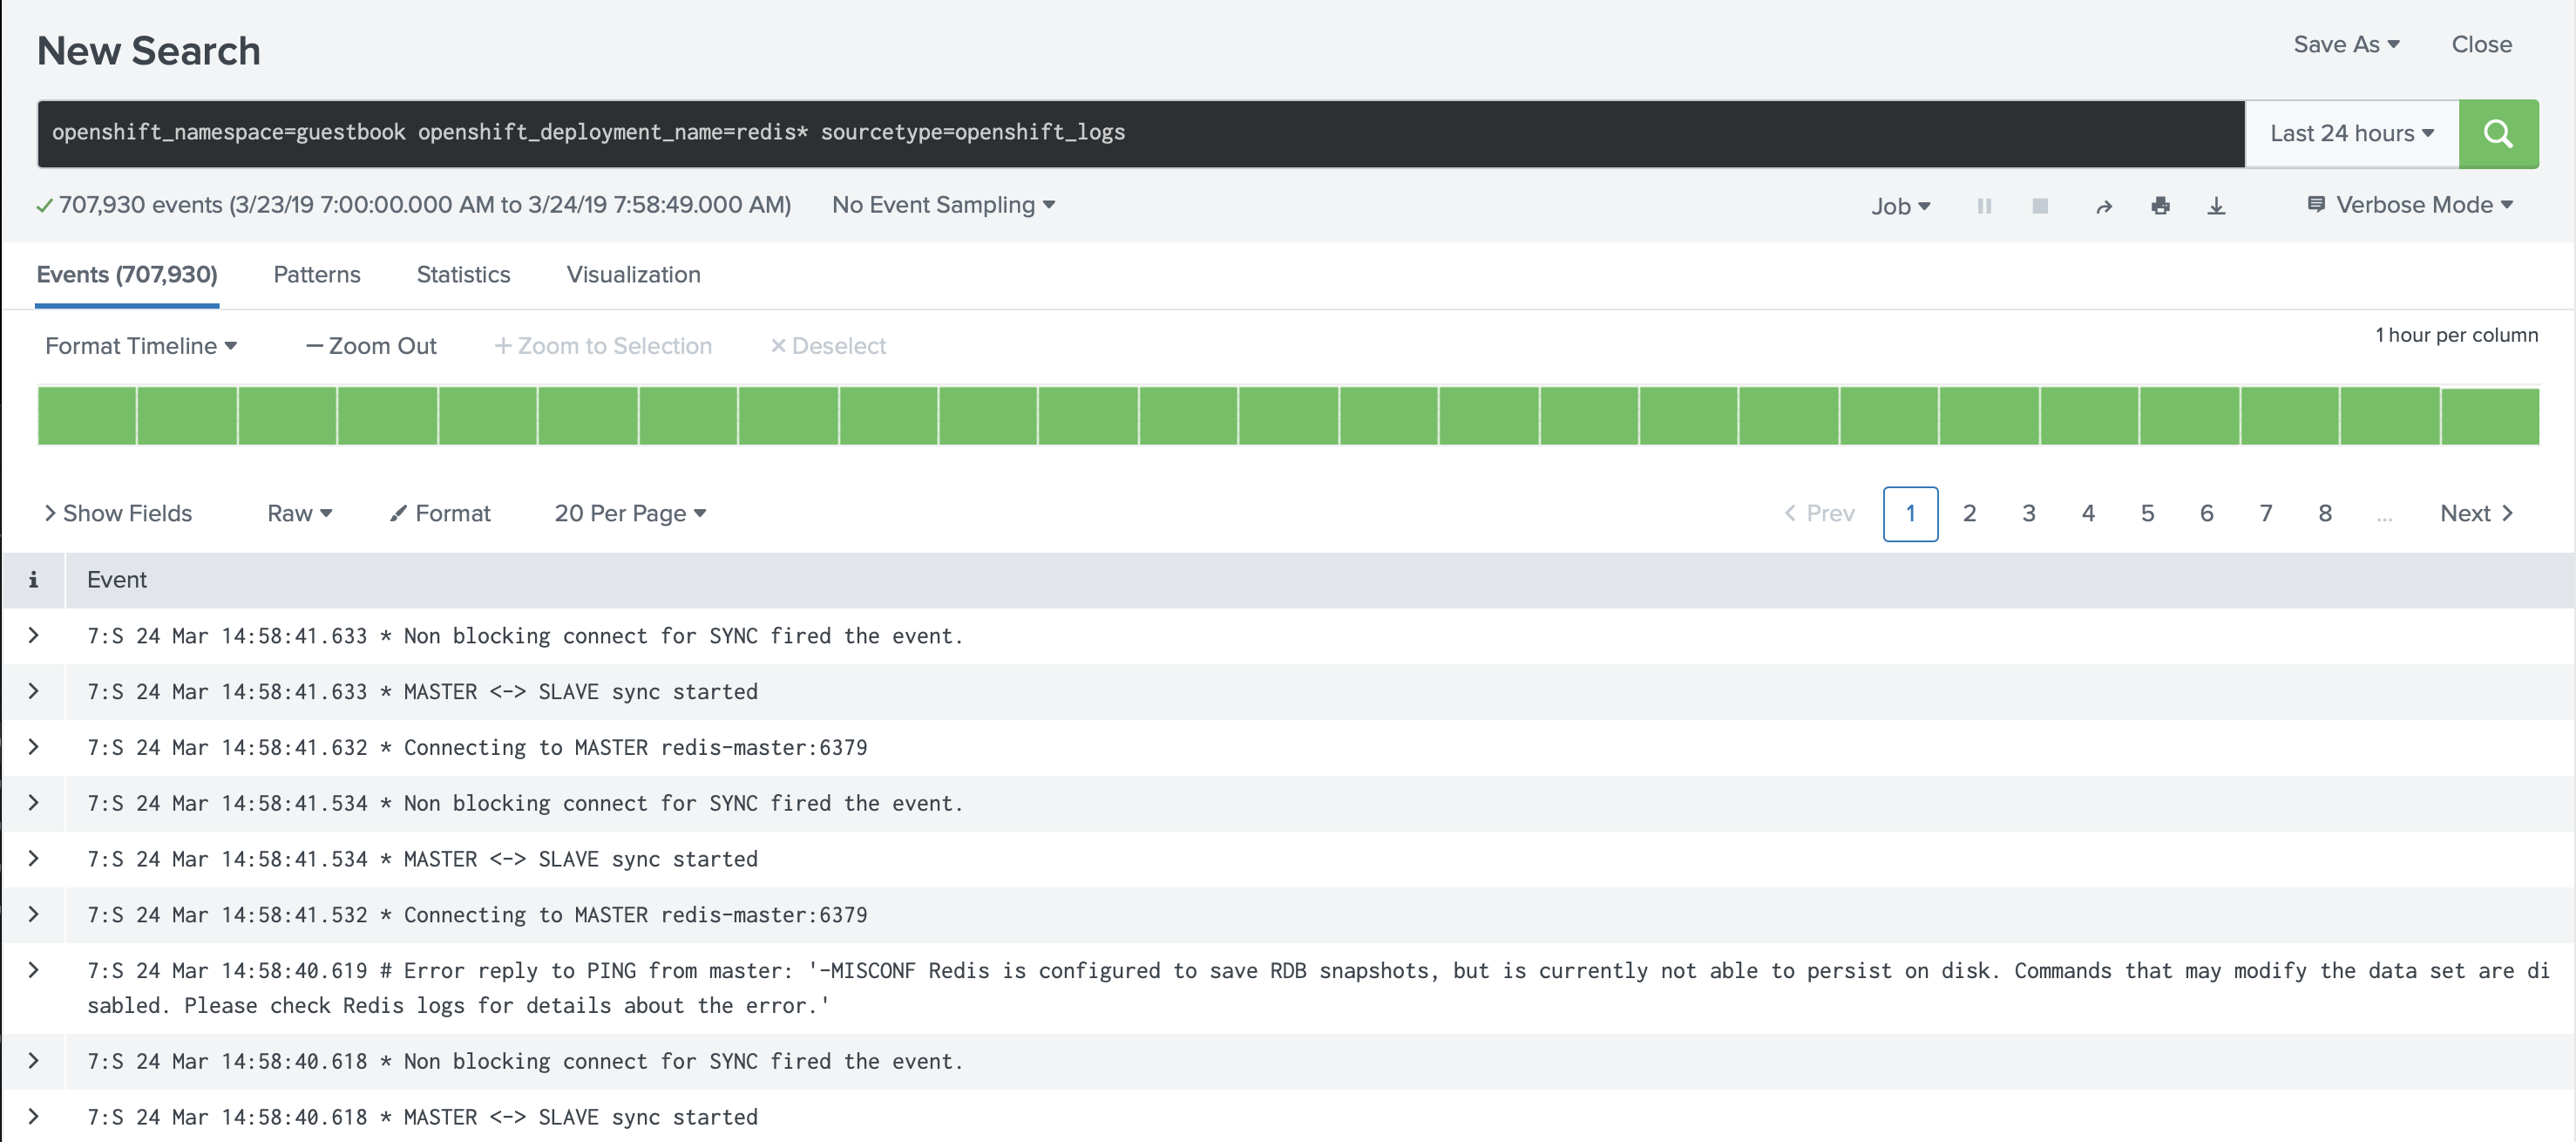
If you estimate the cost of these timestamps in the messages, they take about 17% of the size of all messages. In our case we see that 73 MB is the total amount of logs, and 13 MB of them are timestamps.
Considering that every log line has a timestamp written to the disk, which is generated when the Docker daemon reads the log lines from the standard output and standard error, you end up with two timestamps for every log line. You can read more about that in our blog post about timestamps in container logs.
To solve this issue you have several options:
Remove timestamps from the logs. Considering that the Docker daemon writes the timestamp, you already have it with every log line.
If you don’t have the ability to remove these timestamps from the source, you can use annotations for Collectord to remove timestamps from the messages.
1annotations:
2    collectord.io/logs-replace.1-search: '^([^\s]+\s)(\d+\s\w+\s[^\s]+\s)(.*)$'
3    collectord.io/logs-replace.1-val: '$1$3'
Additionally, you can extract timestamps from the messages to use them as event timestamps instead of the timestamps from the Docker logging driver. In the following example, we start by moving the timestamp to the first part of the message, and after that extracting the timestamp as a field, keeping the rest as a raw message.
1annotations:
2    collectord.io/logs-replace.1-search: '^([^\s]+\s)(\d+\s\w+\s[^\s]+\s)(.*)$'
3    collectord.io/logs-replace.1-val: '$2$1$3'
4    collectord.io/logs-extraction: '^(?P<timestamp>\d+\s\w+\s[^\s]+)\s(.*)$'
5    collectord.io/logs-timestampfield: 'timestamp'
6    collectord.io/logs-timestampformat: '02 Jan 15:04:05.999'
Drop verbose messages
In our example of using replace annotations, we show how you can reduce the amount of logs forwarded from the containers of the nginx pod, where we [remove all access log messages with successful GET requests](% site_rel_link ‘/docs/monitoring-openshift/annotations.md’#example-2-dropping-messages %).
Another great example is the DEBUG and TRACE messages, which are usually required for debugging purposes, and are mostly
useful for a short period of time. We use them in the development of Collectord itself. When we configure logLevel to higher
than INFO, we don’t want to index these logs with Splunk, but still want to have the ability to look at them with the oc logs (kubectl logs)
command. To do that, we attach annotations
1annotations:
2    collectord.io/logs-replace.1-search: '^(DEBUG|TRACE).*$'
3    collectord.io/logs-replace.1-val: ''
That tells Collectord to drop all messages that start with DEBUG or TRACE.
Remove container logs entirely from Splunk
If you believe that you don’t need some log messages in Splunk entirely, you can change the output from splunk to devnull
with an annotation
1annotations:
2    collectord.io/logs-output: 'devnull'
That will tell Collectord to ignore all logs from the containers of this Pod. This approach could be useful for some Pods that you just don’t want to see in Splunk, like containers that you know will never fail.
Use opt-out behavior by default for container logs
Some of our customers choose not to forward any Pod logs, unless they explicitly select them. With the configuration of
Collectord you can change the default output to devnull
1[input.files]
2output = devnull
Which tells Collectord to ignore all container logs. And after that tell Collectord which container logs it should forward
by overriding the output back to splunk
1annotations:
2    collectord.io/logs-output: 'splunk'
Sampling for container logs
Most of the time you monitor services by tracking the accepted SLA of your service. For example, if you guarantee that 99.9999% of the time your service should return a successful result, and it is acceptable that your service can fail in less than 0.0001% of the time (because of timeouts or any other reason), this percentage can be calculated similarly from 1 billion requests (1k requests can fail), and 100 million requests (only 100 requests can fail). In this case, you can sample them and forward only 10% of the log lines.
1annotations:
2    collectord.io/logs-sampling-percent: '10'
You can also use Hash-Based sampling, where hash could be an account id or IP address. See Example 2. Hash-based sampling.


