Blog
Monitoring Docker, OpenShift and Kubernetes - Version 5.6
Version 5.6 brings dark theme support, refreshed Logs dashboard (free-text search and more control), support for auto-refresh dashboards, and bug fixes. With Collectord 5.6 we included support for log sampling (random and hash-based), small improvements and bug fixes.
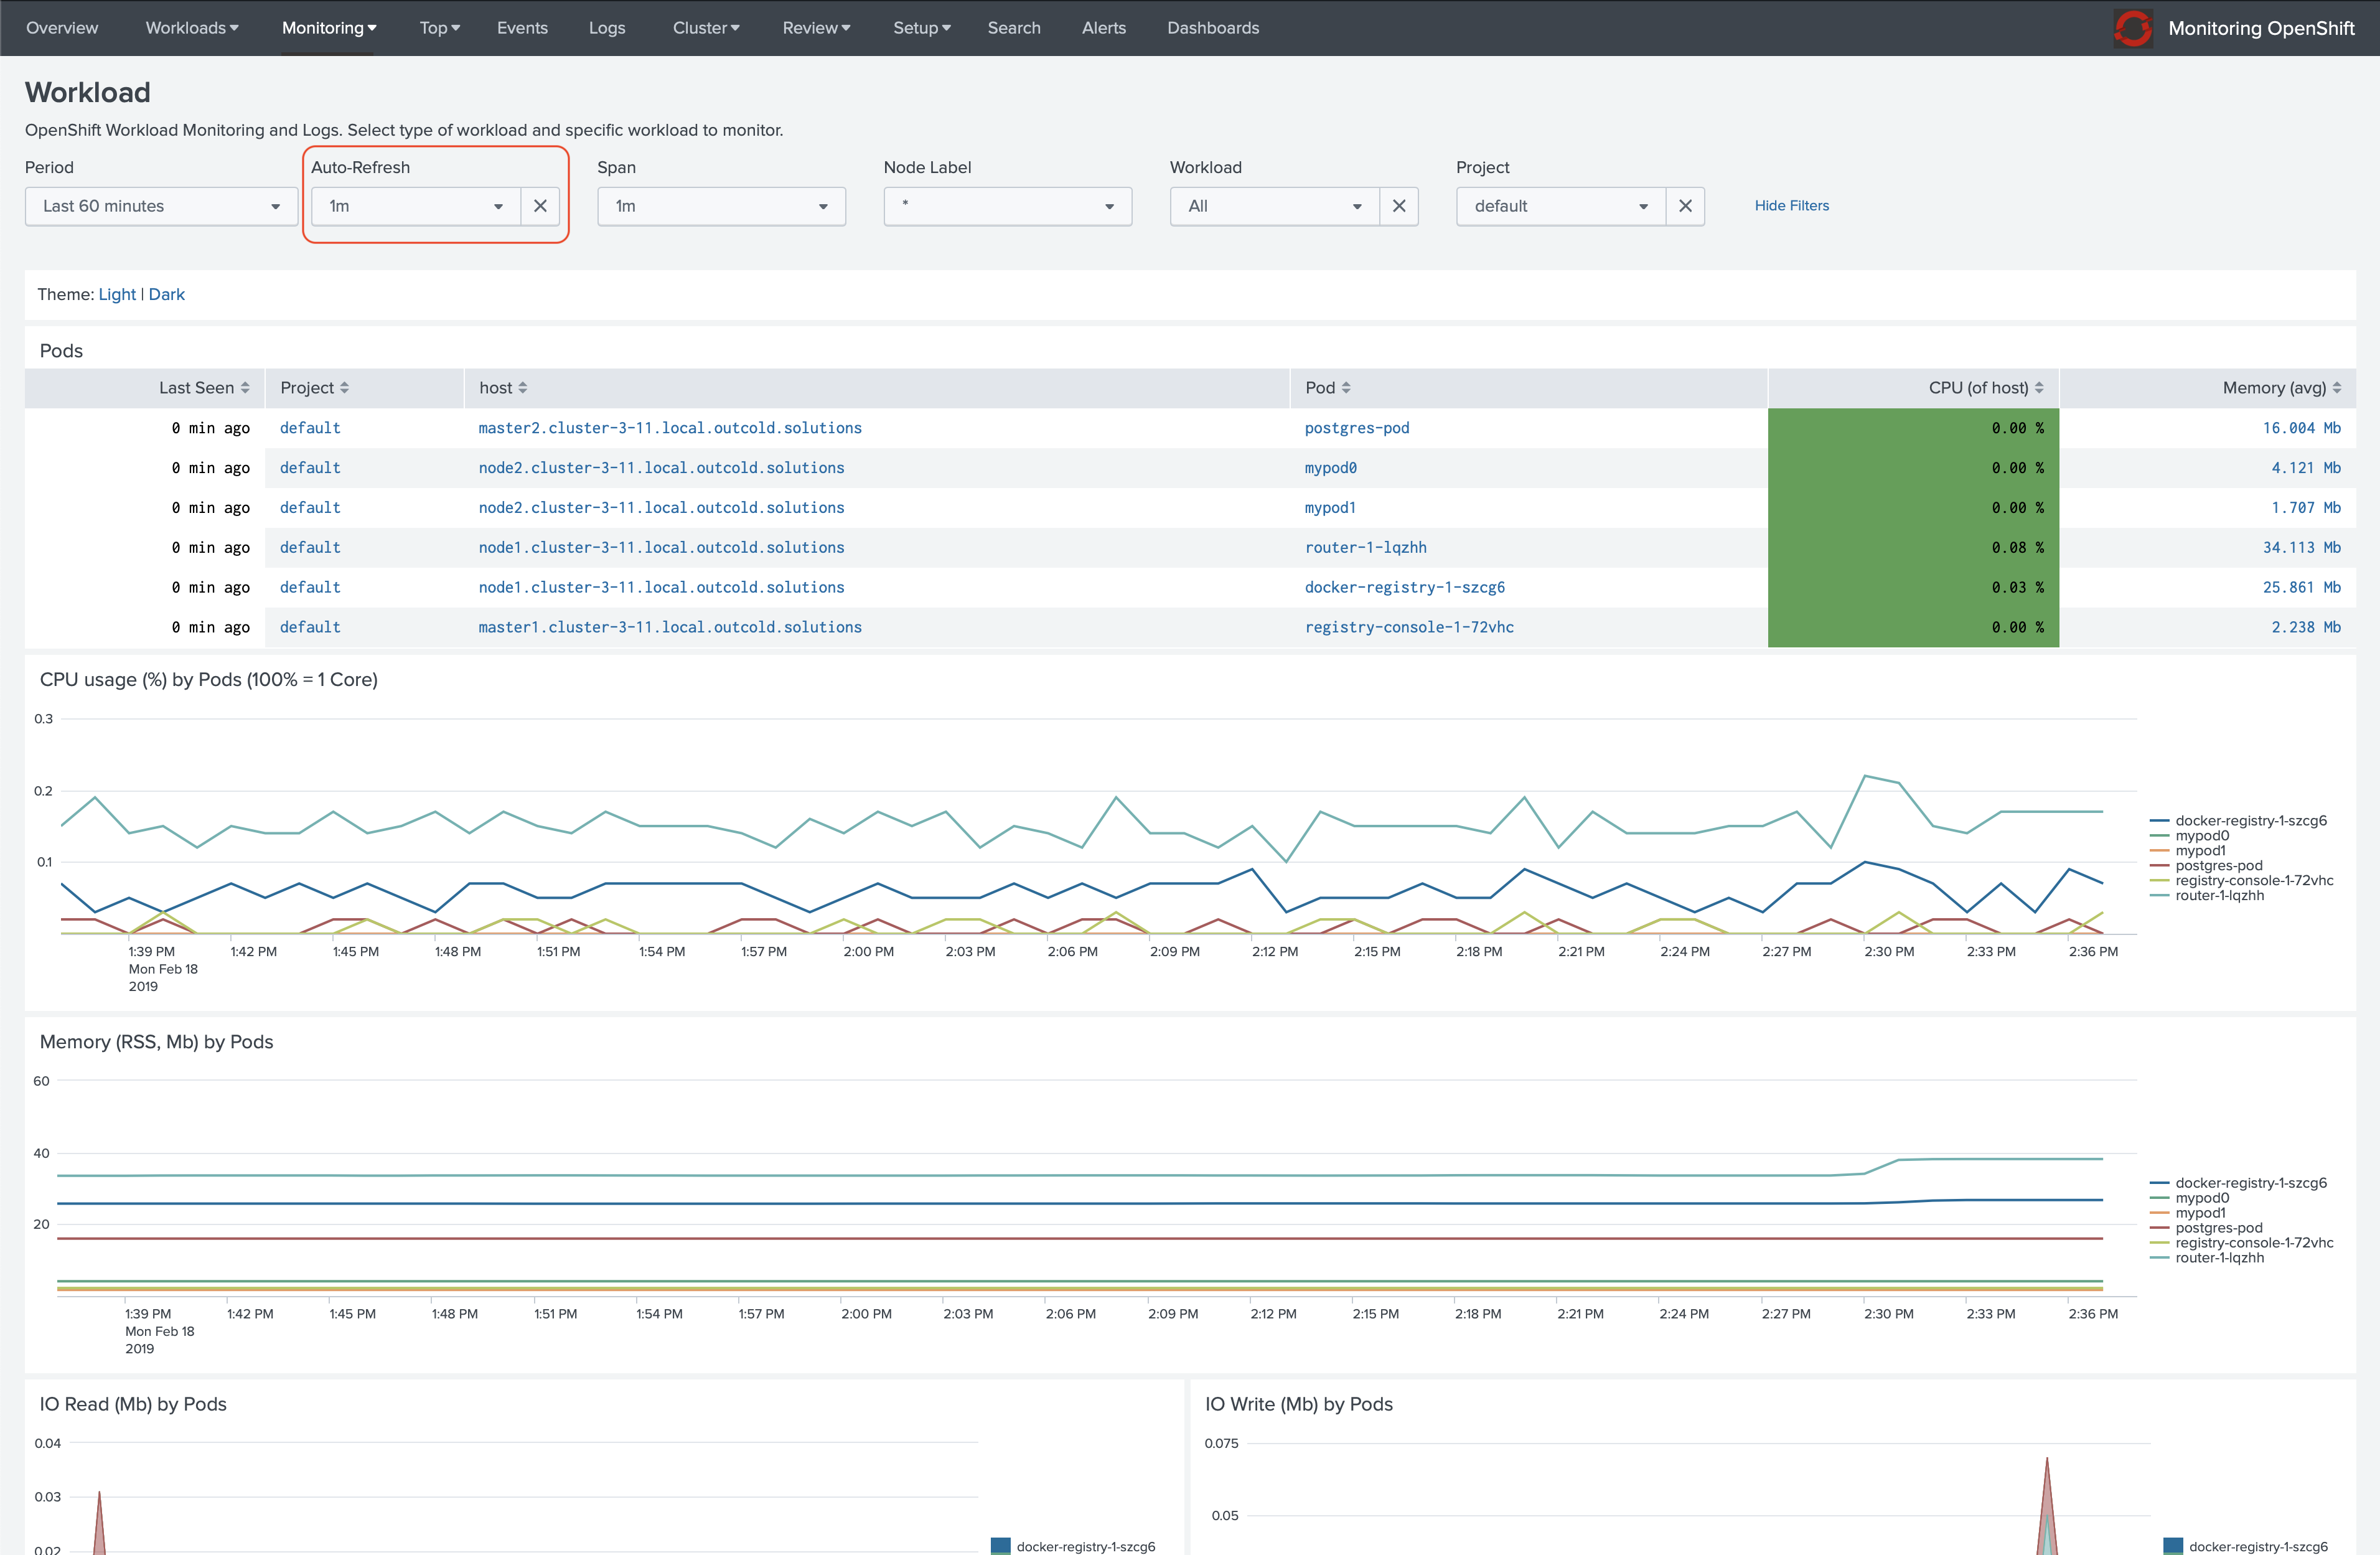
Auto-refresh
Every dashboard has an option now that allows you to specify how often you want to refresh the dashboard. useful for keeping the dashboard open for a long time and monitor the performance of your applications.
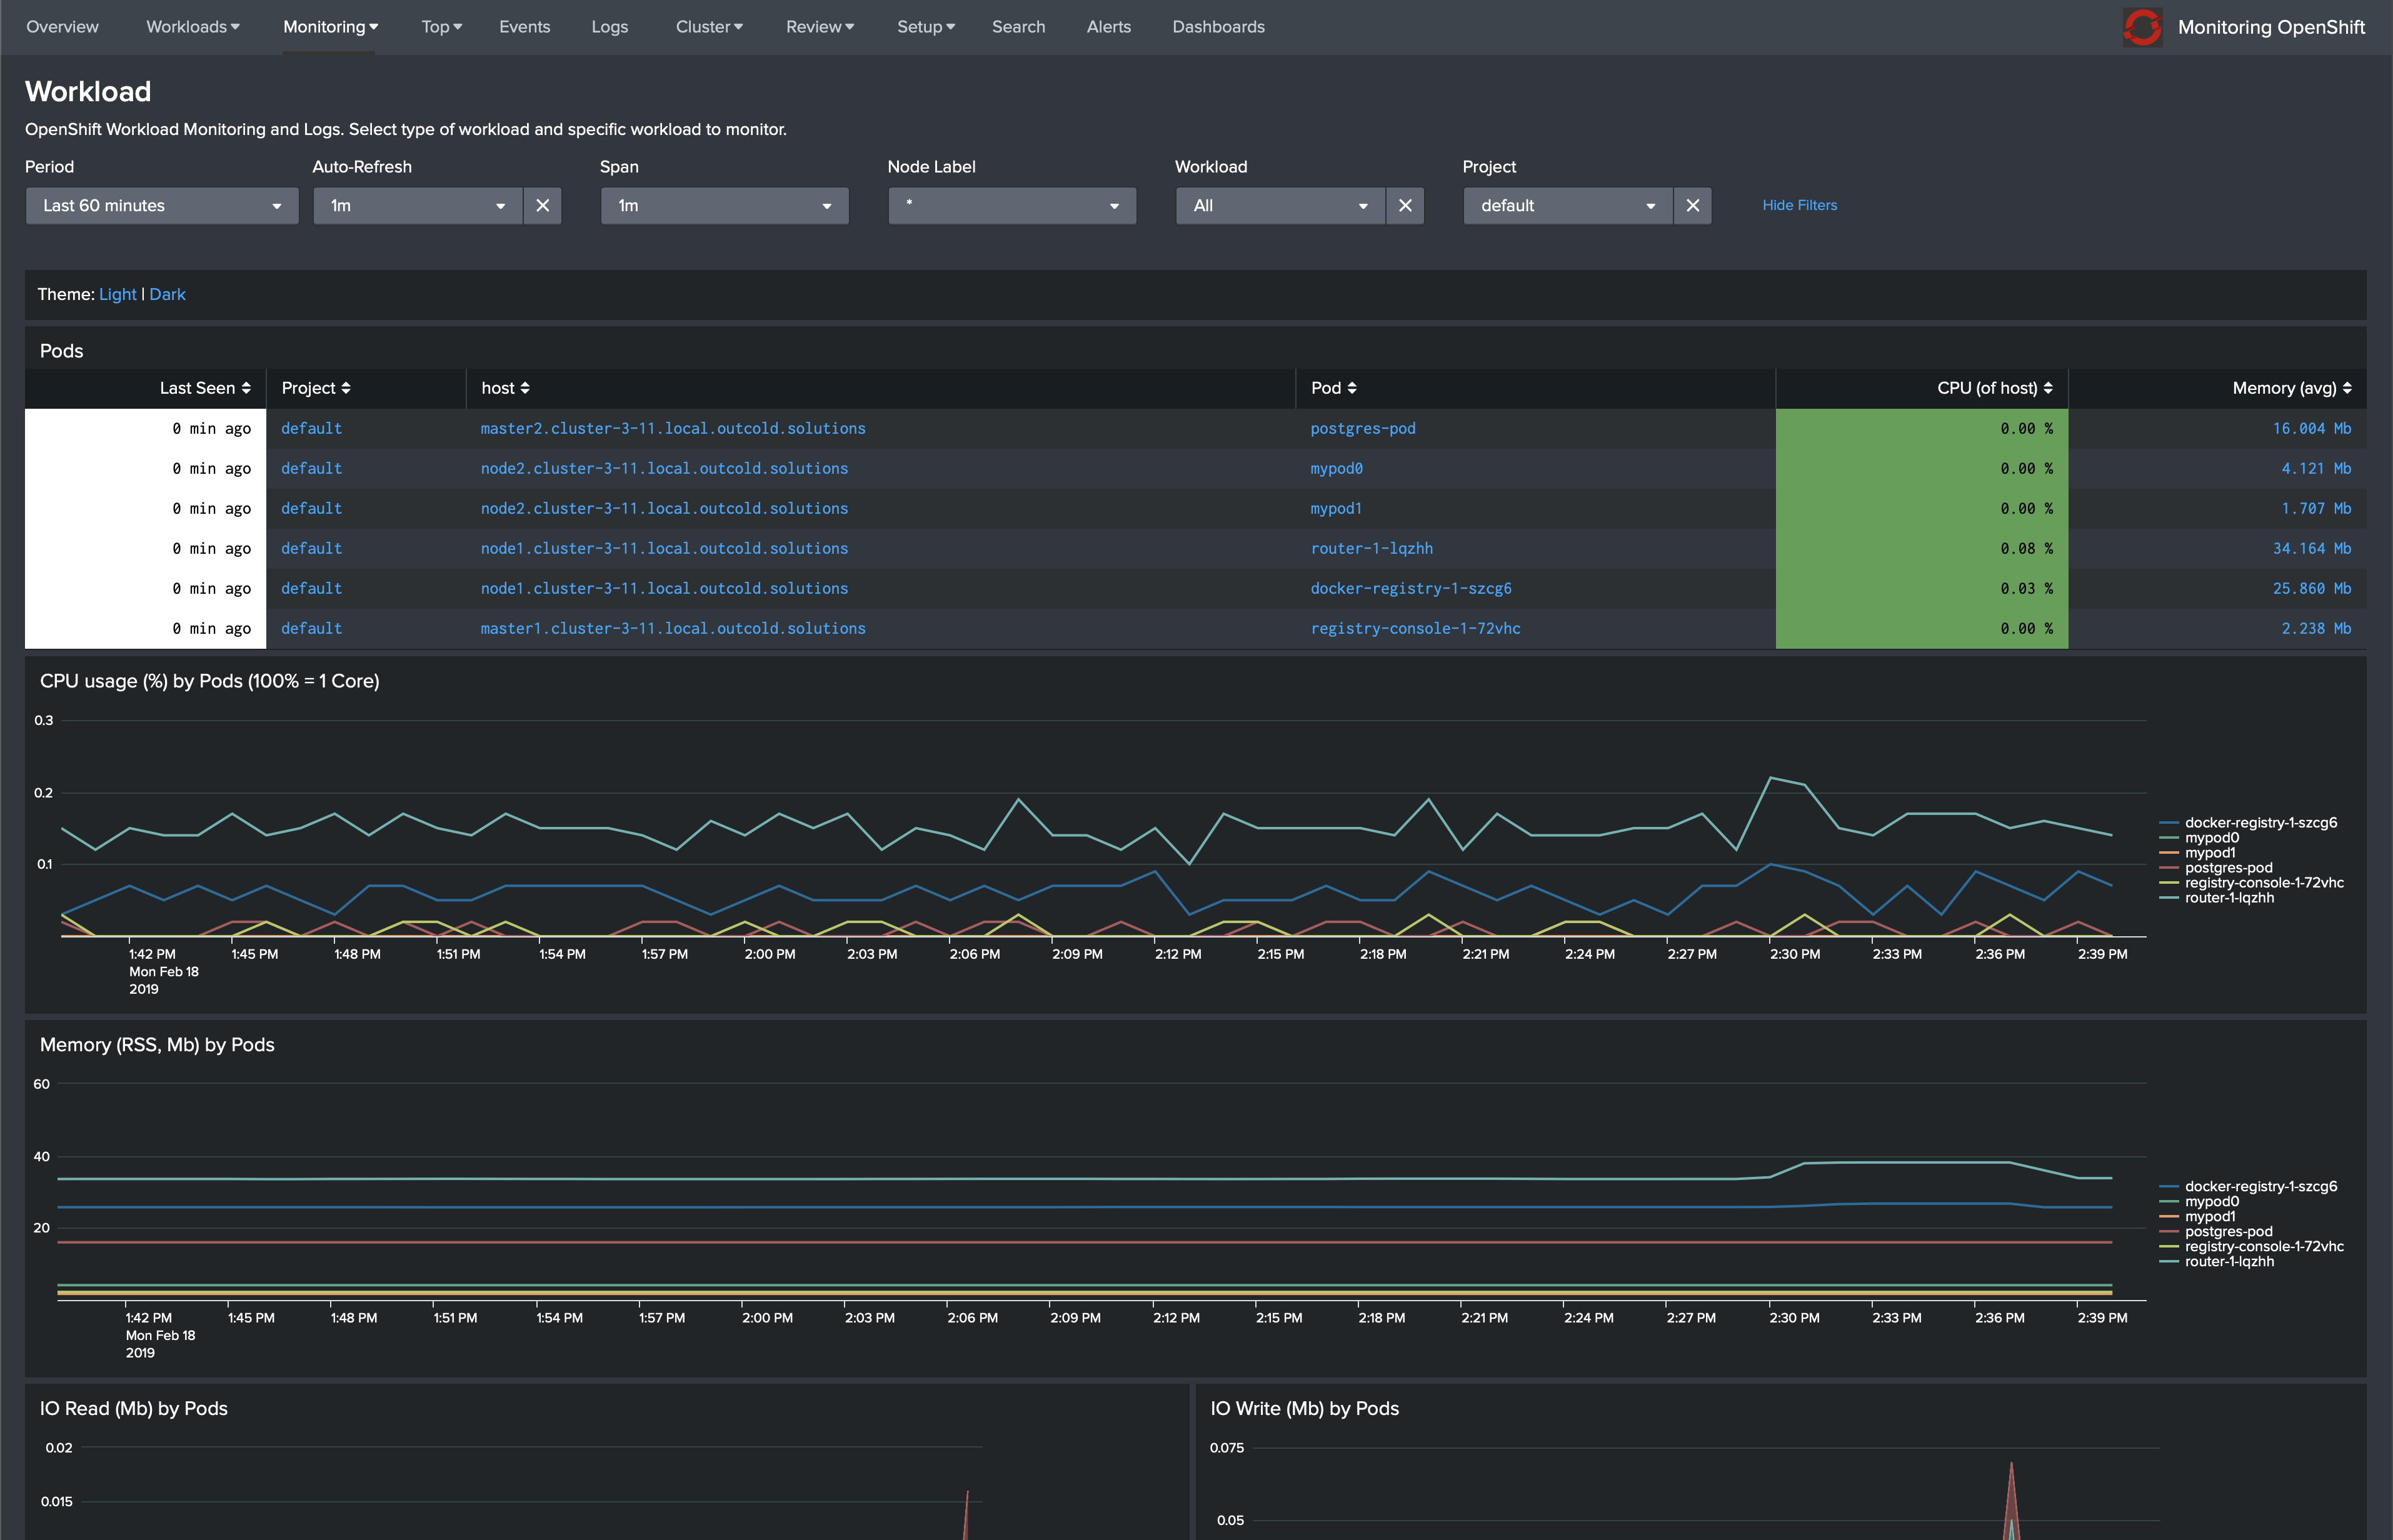
Dark Theme
You can find a link on every dashboard that will allow you to switch to a dark theme.
There is a limitation in Splunk, that does not allow us to keep the preference, so if you navigate with the navigation bar at the top, the theme configuration will be switched back to light.
With the auto-refresh configuration you can keep the dashboards open on a large screen.
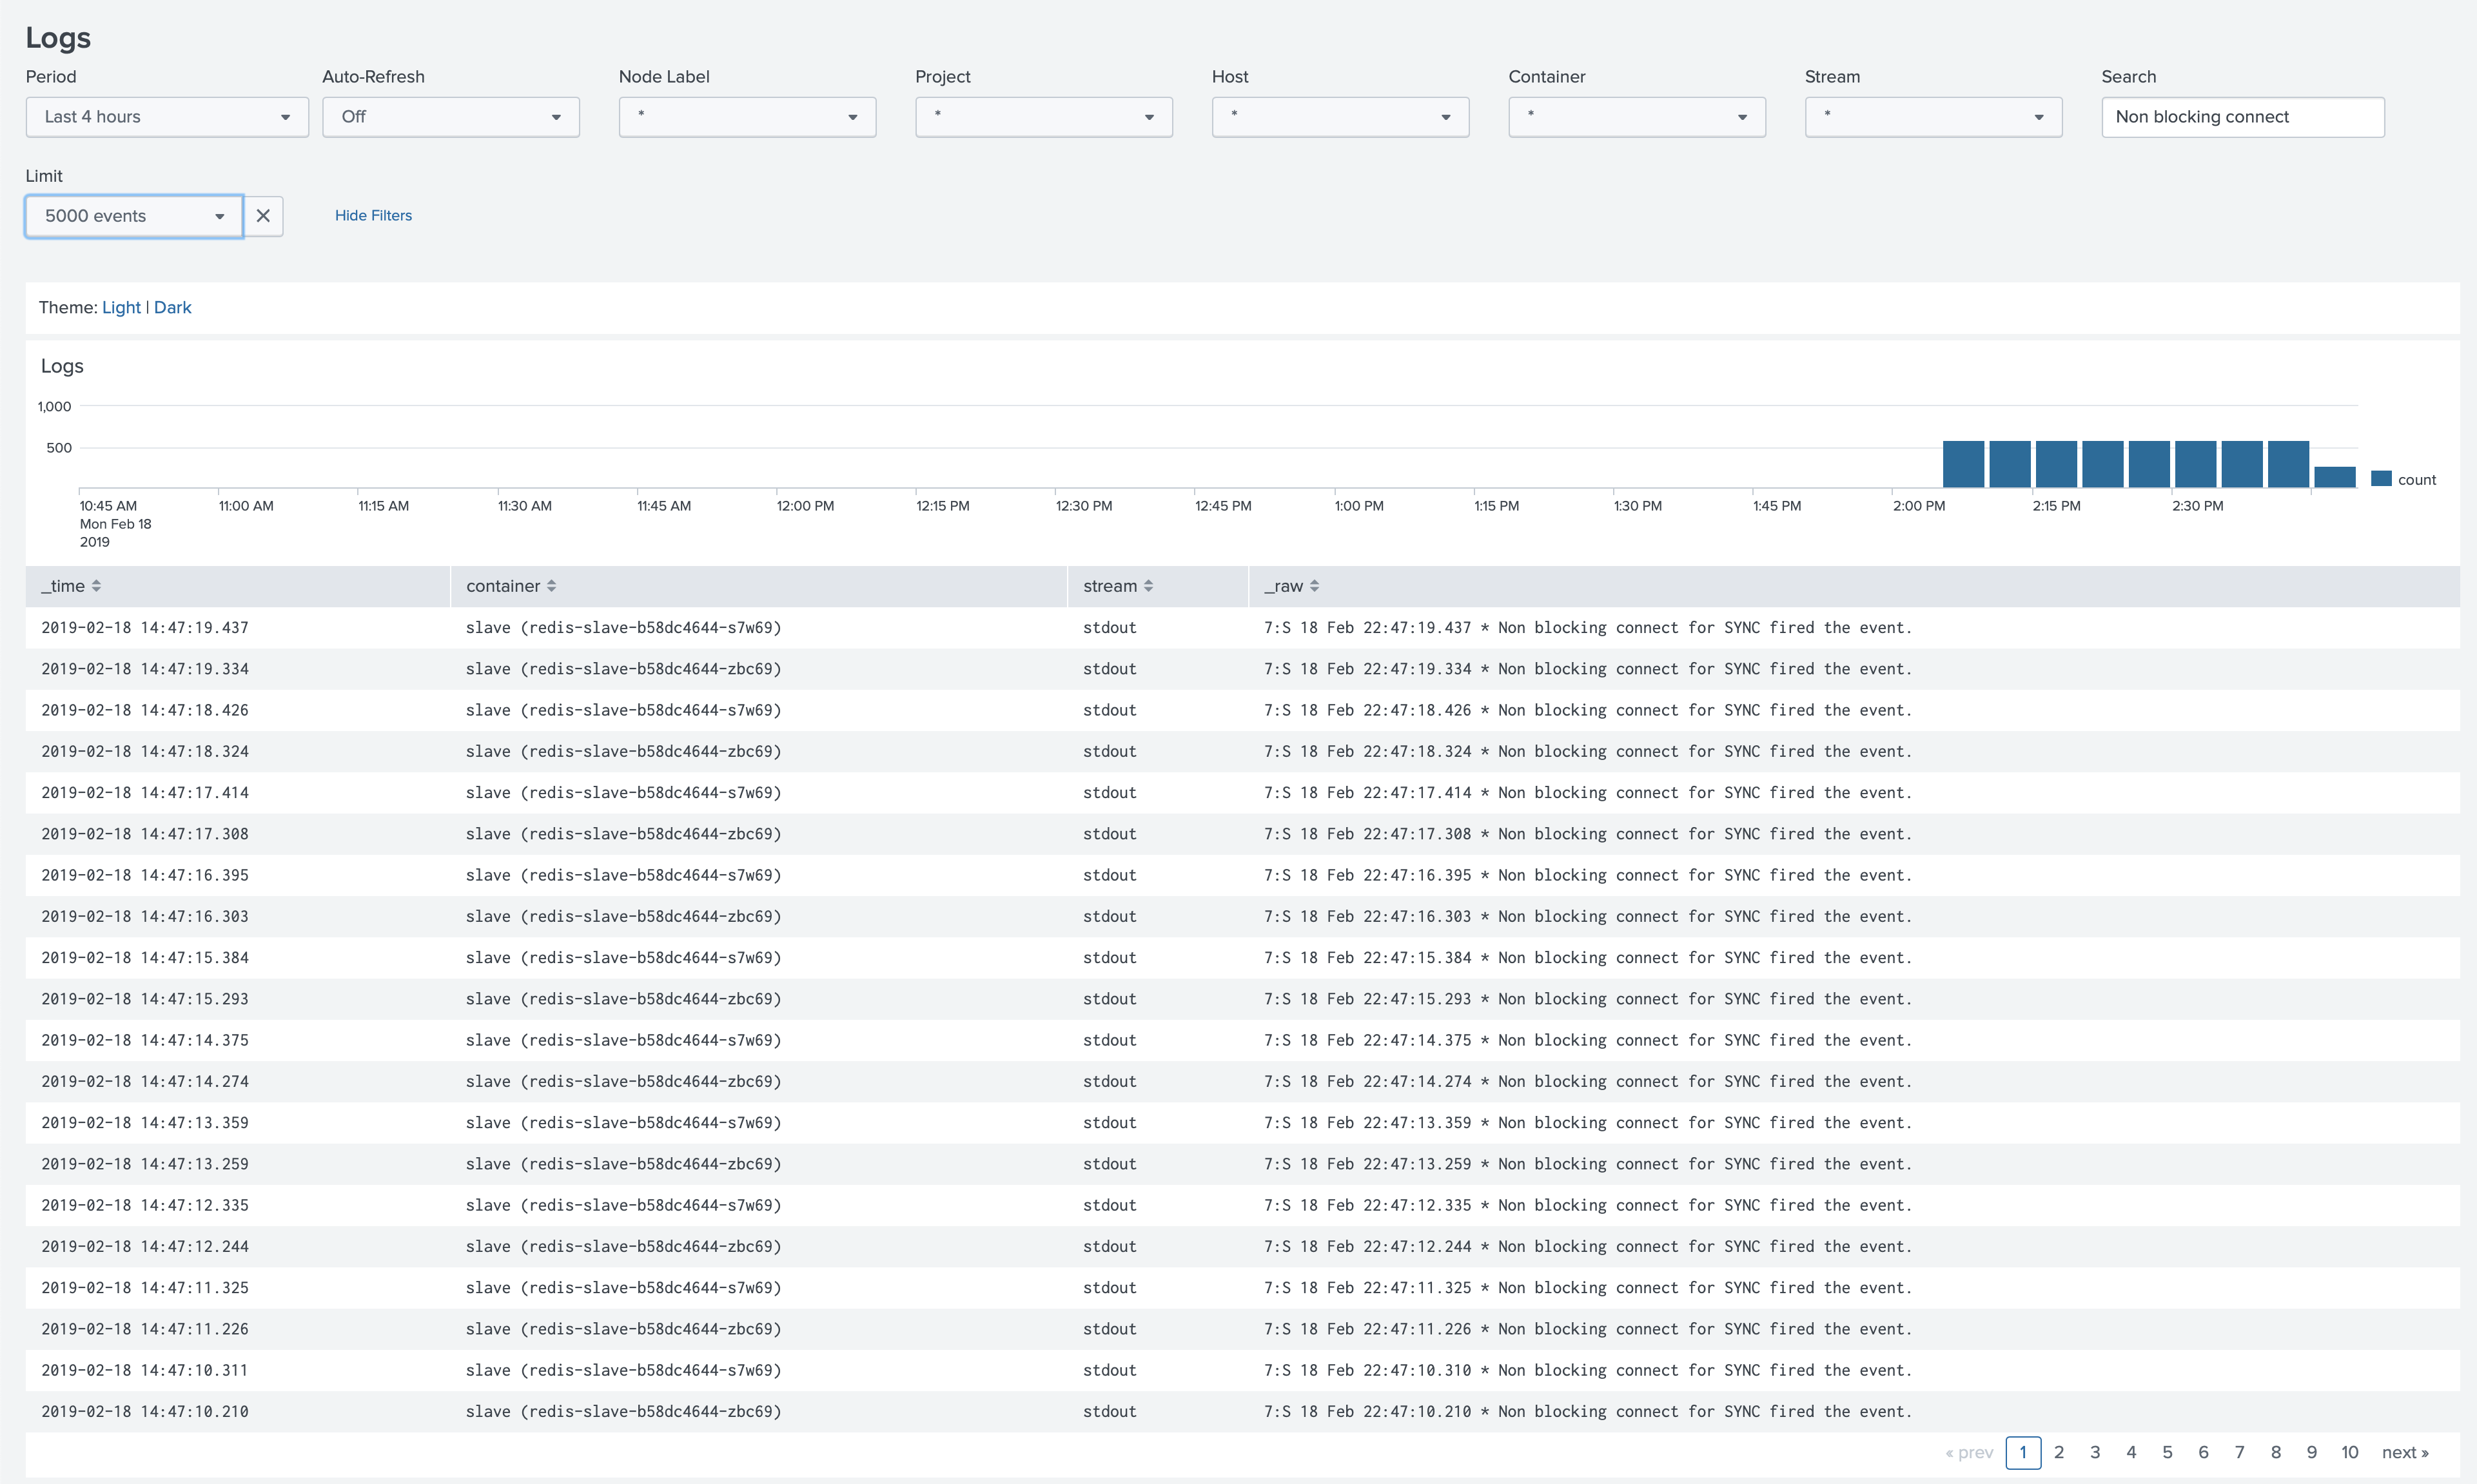
Updated Logs dashboard
We have updated the logs dashboard, including the possibility to add a free-text search, and specify the limit for the number of logs you want to see. We also added a visualization to quickly identify the period of time of the log messages.
Logs sampling
- Monitoring OpenShift v5 - Annotations - Logs sampling
- Monitoring Kubernetes v5 - Annotations - Logs sampling
- Monitoring Docker v5 - Annotations - Logs sampling
Example 1. Random-based sampling
When the application produces a high volume of logs, in some cases it could be enough to just look at the sampled portion of the logs to understand how many failed requests the application has, or how it behaves. You can add an annotation for the logs to specify the percentage of logs that should be forwarded to Splunk.
In the following example, this application produces 300,000 log lines. Only about 60,000 log lines are going to be
forwarded to Splunk.
1docker run -d --rm \
2    --label 'collectord.io/logs-sampling-percent=20' \
3    docker.io/mffiedler/ocp-logtest:latest \
4    python ocp_logtest.py --line-length=1024 --num-lines=300000 --rate 60000 --fixed-line
Example 2. Hash-based sampling
In situations where you want to look at the pattern for a specific user, you can specify that you want to sample logs based on the hash value, to ensure that if the same key is present in two different log lines, both of them will be forwarded to Splunk.
In the following example, we define a key (should be a named submatch pattern) as an IP address.
1docker run -d --rm \
2    --label 'collectord.io/logs-sampling-percent=20' \
3    --label 'collectord.io/logs-sampling-key=^(?P<key>(\d+\.){3}\d+)' \
4    nginx
To test it, we can run 500 containers with different IP addresses (make sure to change the IP address of the original
container that we ran from the nginx image)
Make sure that you have enough capacity to run
500additional containers.
1seq 500 | xargs -L 1 -P 10 docker run -d -it alpine:3.8 sh -c 'apk add bash curl 1>/dev/null 2>&1 && bash -c "(while true; do curl --silent 172.17.0.7:80; sleep 5; done;) 1>/dev/null 2>&1"'From this example, we can see that only data from 69 containers was forwarded to Splunk (you will get close to 20%
with a much higher number of different values). But each IP address has more than one value in Splunk.
Forward annotations
You can configure collectorforopenshift and collectorforkubernetes to include annotations similarly how we attach labels. Labels in Kubernetes usually have data that can identify the pods or workloads, annotations in most cases have some data that can be useful for other tools and Kubernetes components, but sometimes it can have valuable information that you might want to forward to Splunk as well.
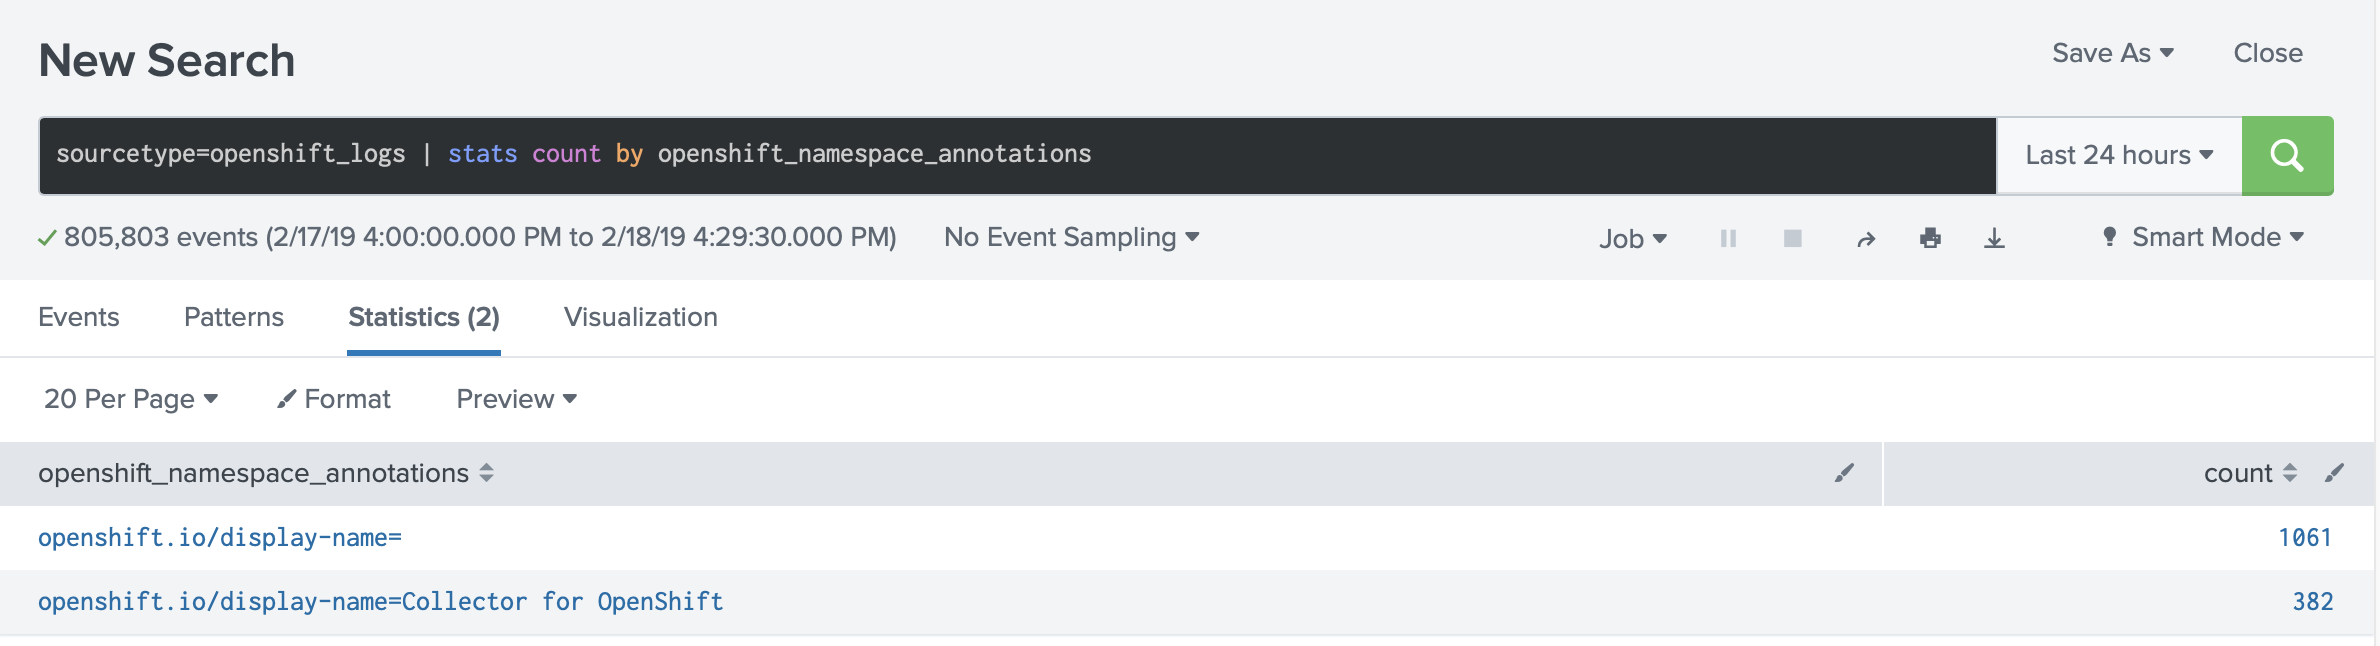
As an example, if you want to forward annotation openshift.io/display-name= for the OpenShift Projects, you can add
configuration in the ConfigMap
1[general.kubernetes]
2
3includeAnnotations.displayName = openshift\.io\/display-name
After that you can find these annotations attached to the logs and stats
Change in licensing
We have changed the way we generate a unique InstanceID for every Collectord instance, to take into account that you might need to run multiple Collectord instances per host/node in order to send data to different Splunk Clusters. Now each Collectord will have the same InstanceID unique to this host, which will allow us to count it as one host.
Links
You can find more information about other minor updates by following the links below.
Release notes
- Monitoring OpenShift - Release notes
- Monitoring Kubernetes - Release notes
- Monitoring Docker - Release notes


