Getting started with Monitoring Kubernetes, Openshift and Docker on your development box
We provide configurations that work out of the box in most cases. The good thing is that most of the Kubernetes
and OpenShift providers have very similar default configurations. The big difference that we have found is in
minikube and minishift, because of their simplicity. In this blog post I will guide you through steps
that you need to perform on a local development box to install all three of our main applications for Monitoring
Docker, Kubernetes and OpenShift in Splunk.
Install Splunk using Docker
You can install Splunk as usual on your development box, or use Splunk official Docker image to download and install Splunk Enterprise. Below is a basic configuration to get Splunk up and running; you can find more details about available configuration options in the documentation.
You can change the default password
changemeto a more secure password, and change the token to a uniqueGUID, make sure to keep this change in sync with other commands below.
docker run -d \
    --name splunk \
    -p 8000:8000 \
    -p 8088:8088 \
    -e 'SPLUNK_START_ARGS=--accept-license' \
    -e 'SPLUNK_PASSWORD=changeme' \
    -e 'SPLUNK_HEC_TOKEN=00000000-0000-0000-0000-000000000000' \
    -v splunk_etc:/opt/splunk/etc \
    -v splunk_var:/opt/splunk/var \
    splunk/splunk:7.3.1
Give it a minute and check the logs from the container docker logs splunk; at the end you should see a message
Ansible playbook complete, will begin streaming var/log/splunk/splunkd_stderr.log.
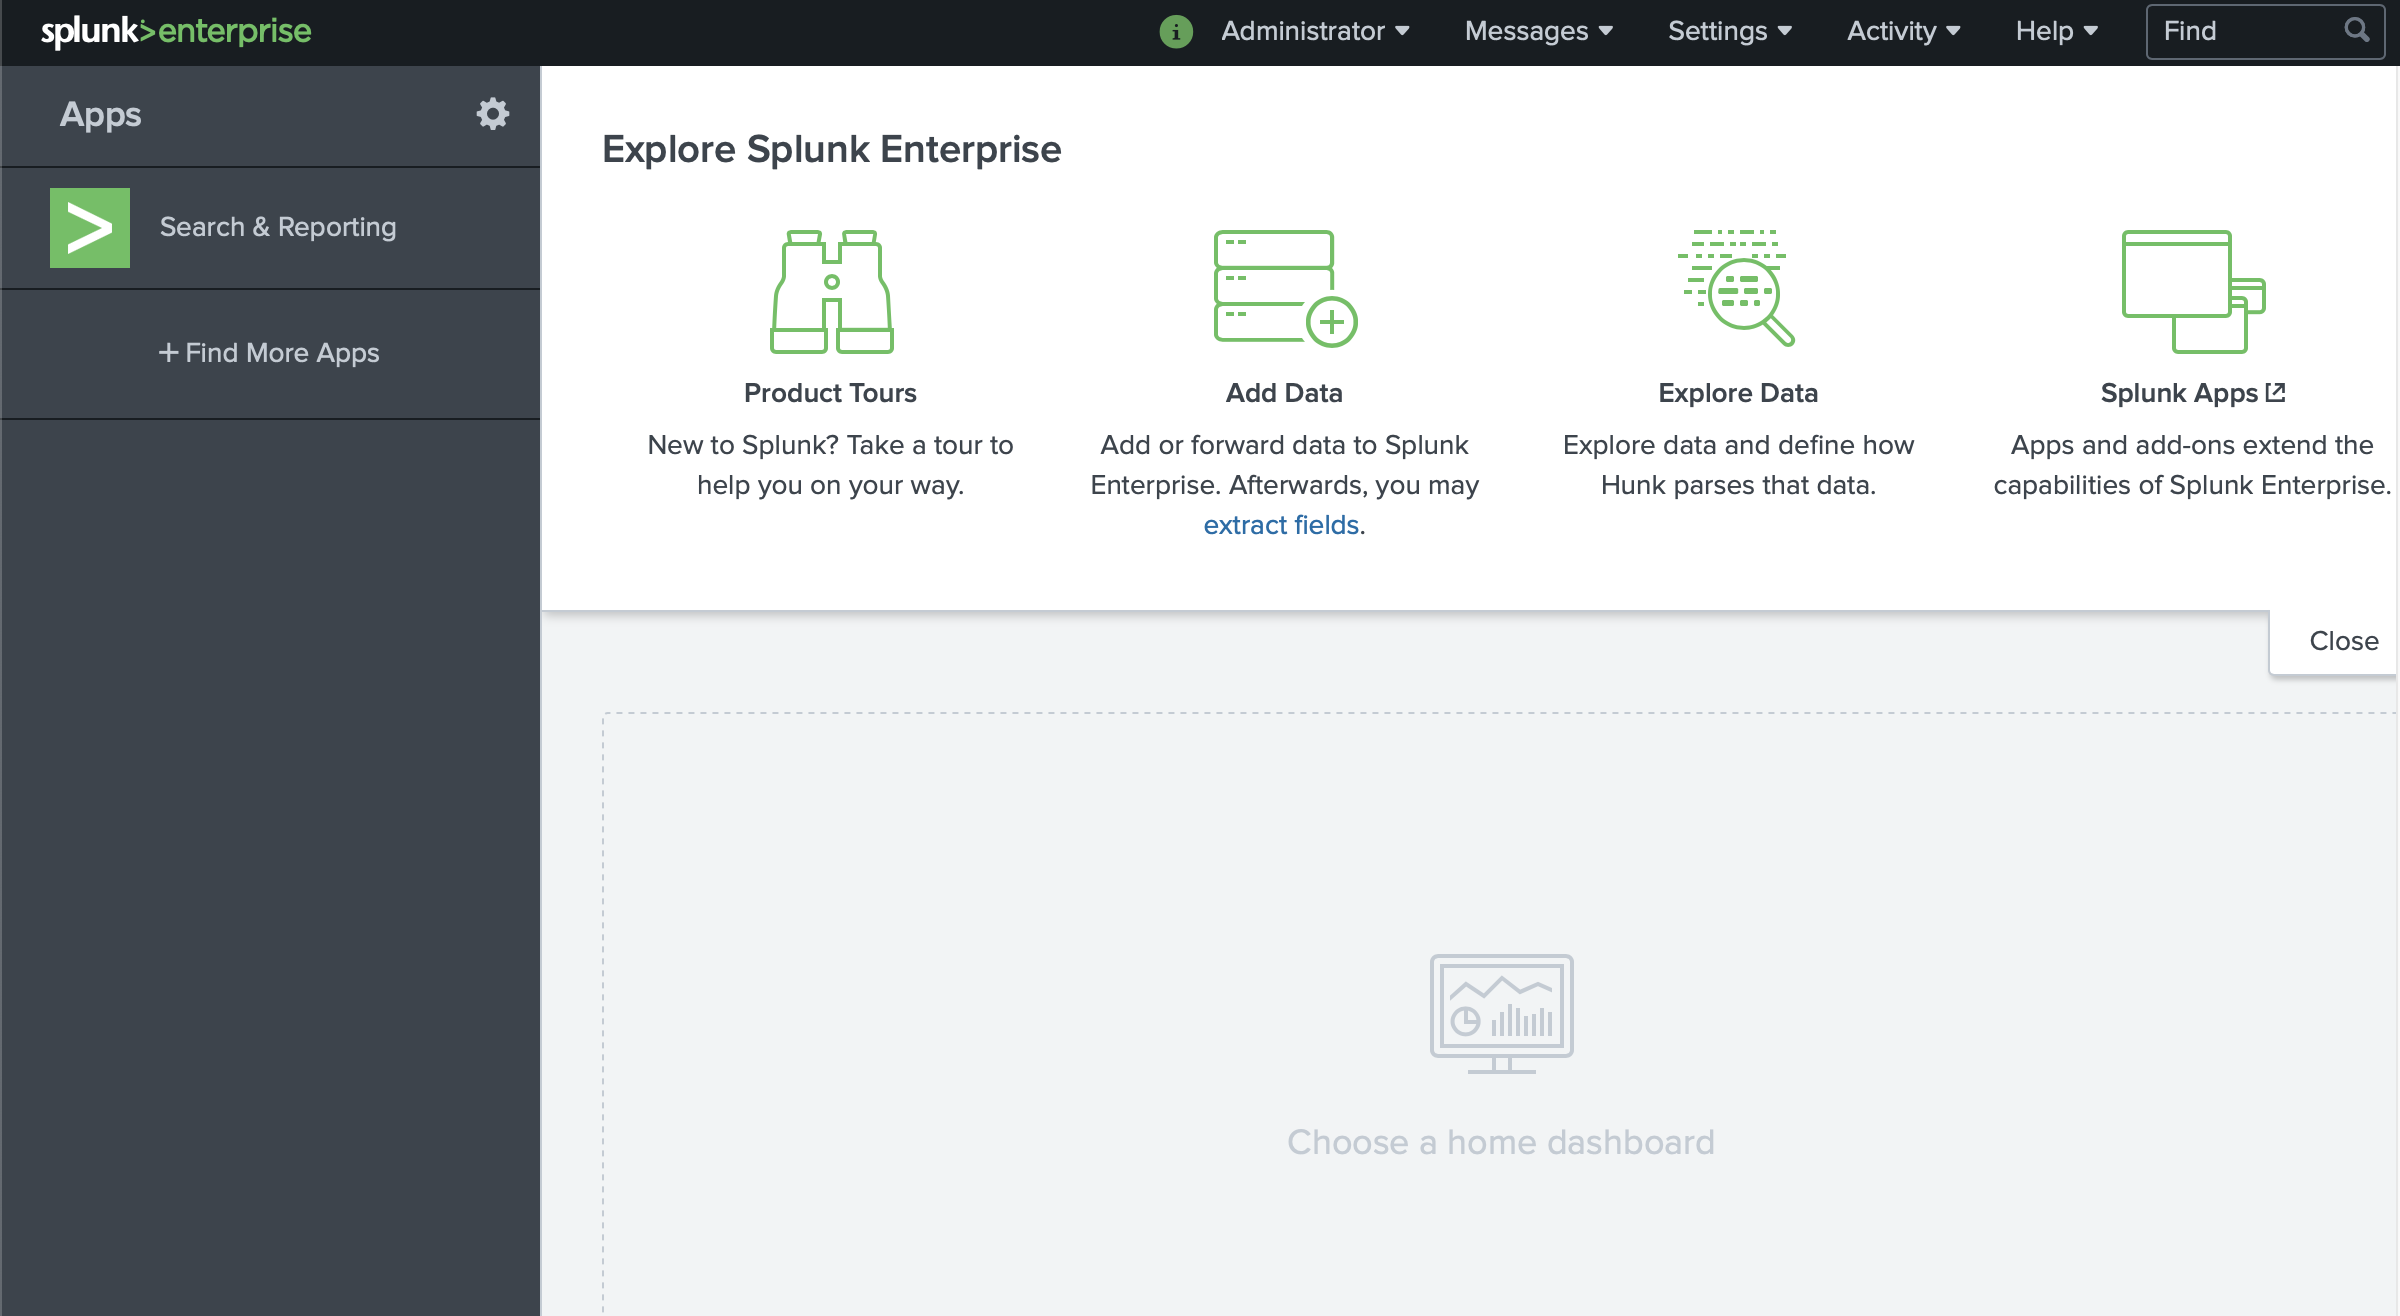
Open Splunk Web in the Browser http://localhost:8000 and log in with the default user admin and password changeme
Monitoring Docker
Install Monitoring Docker application in Splunk.
Install Collectord on Docker
Use our latest installation instructions to install Collectord on docker.
Use https://host.docker.internal:8088/services/collector/event/1.0 as Splunk URL (if you are using Docker for Mac or Windows)
and 00000000-0000-0000-0000-000000000000 as Token. The connection should be insecure. As an example
...
    --env "COLLECTOR__SPLUNK_URL=output.splunk__url=https://host.docker.internal:8088/services/collector/event/1.0" \
    --env "COLLECTOR__SPLUNK_TOKEN=output.splunk__token=00000000-0000-0000-0000-000000000000"  \
    --env "COLLECTOR__SPLUNK_INSECURE=output.splunk__insecure=true"  \
...
Navigate to Monitoring Docker application in Splunk
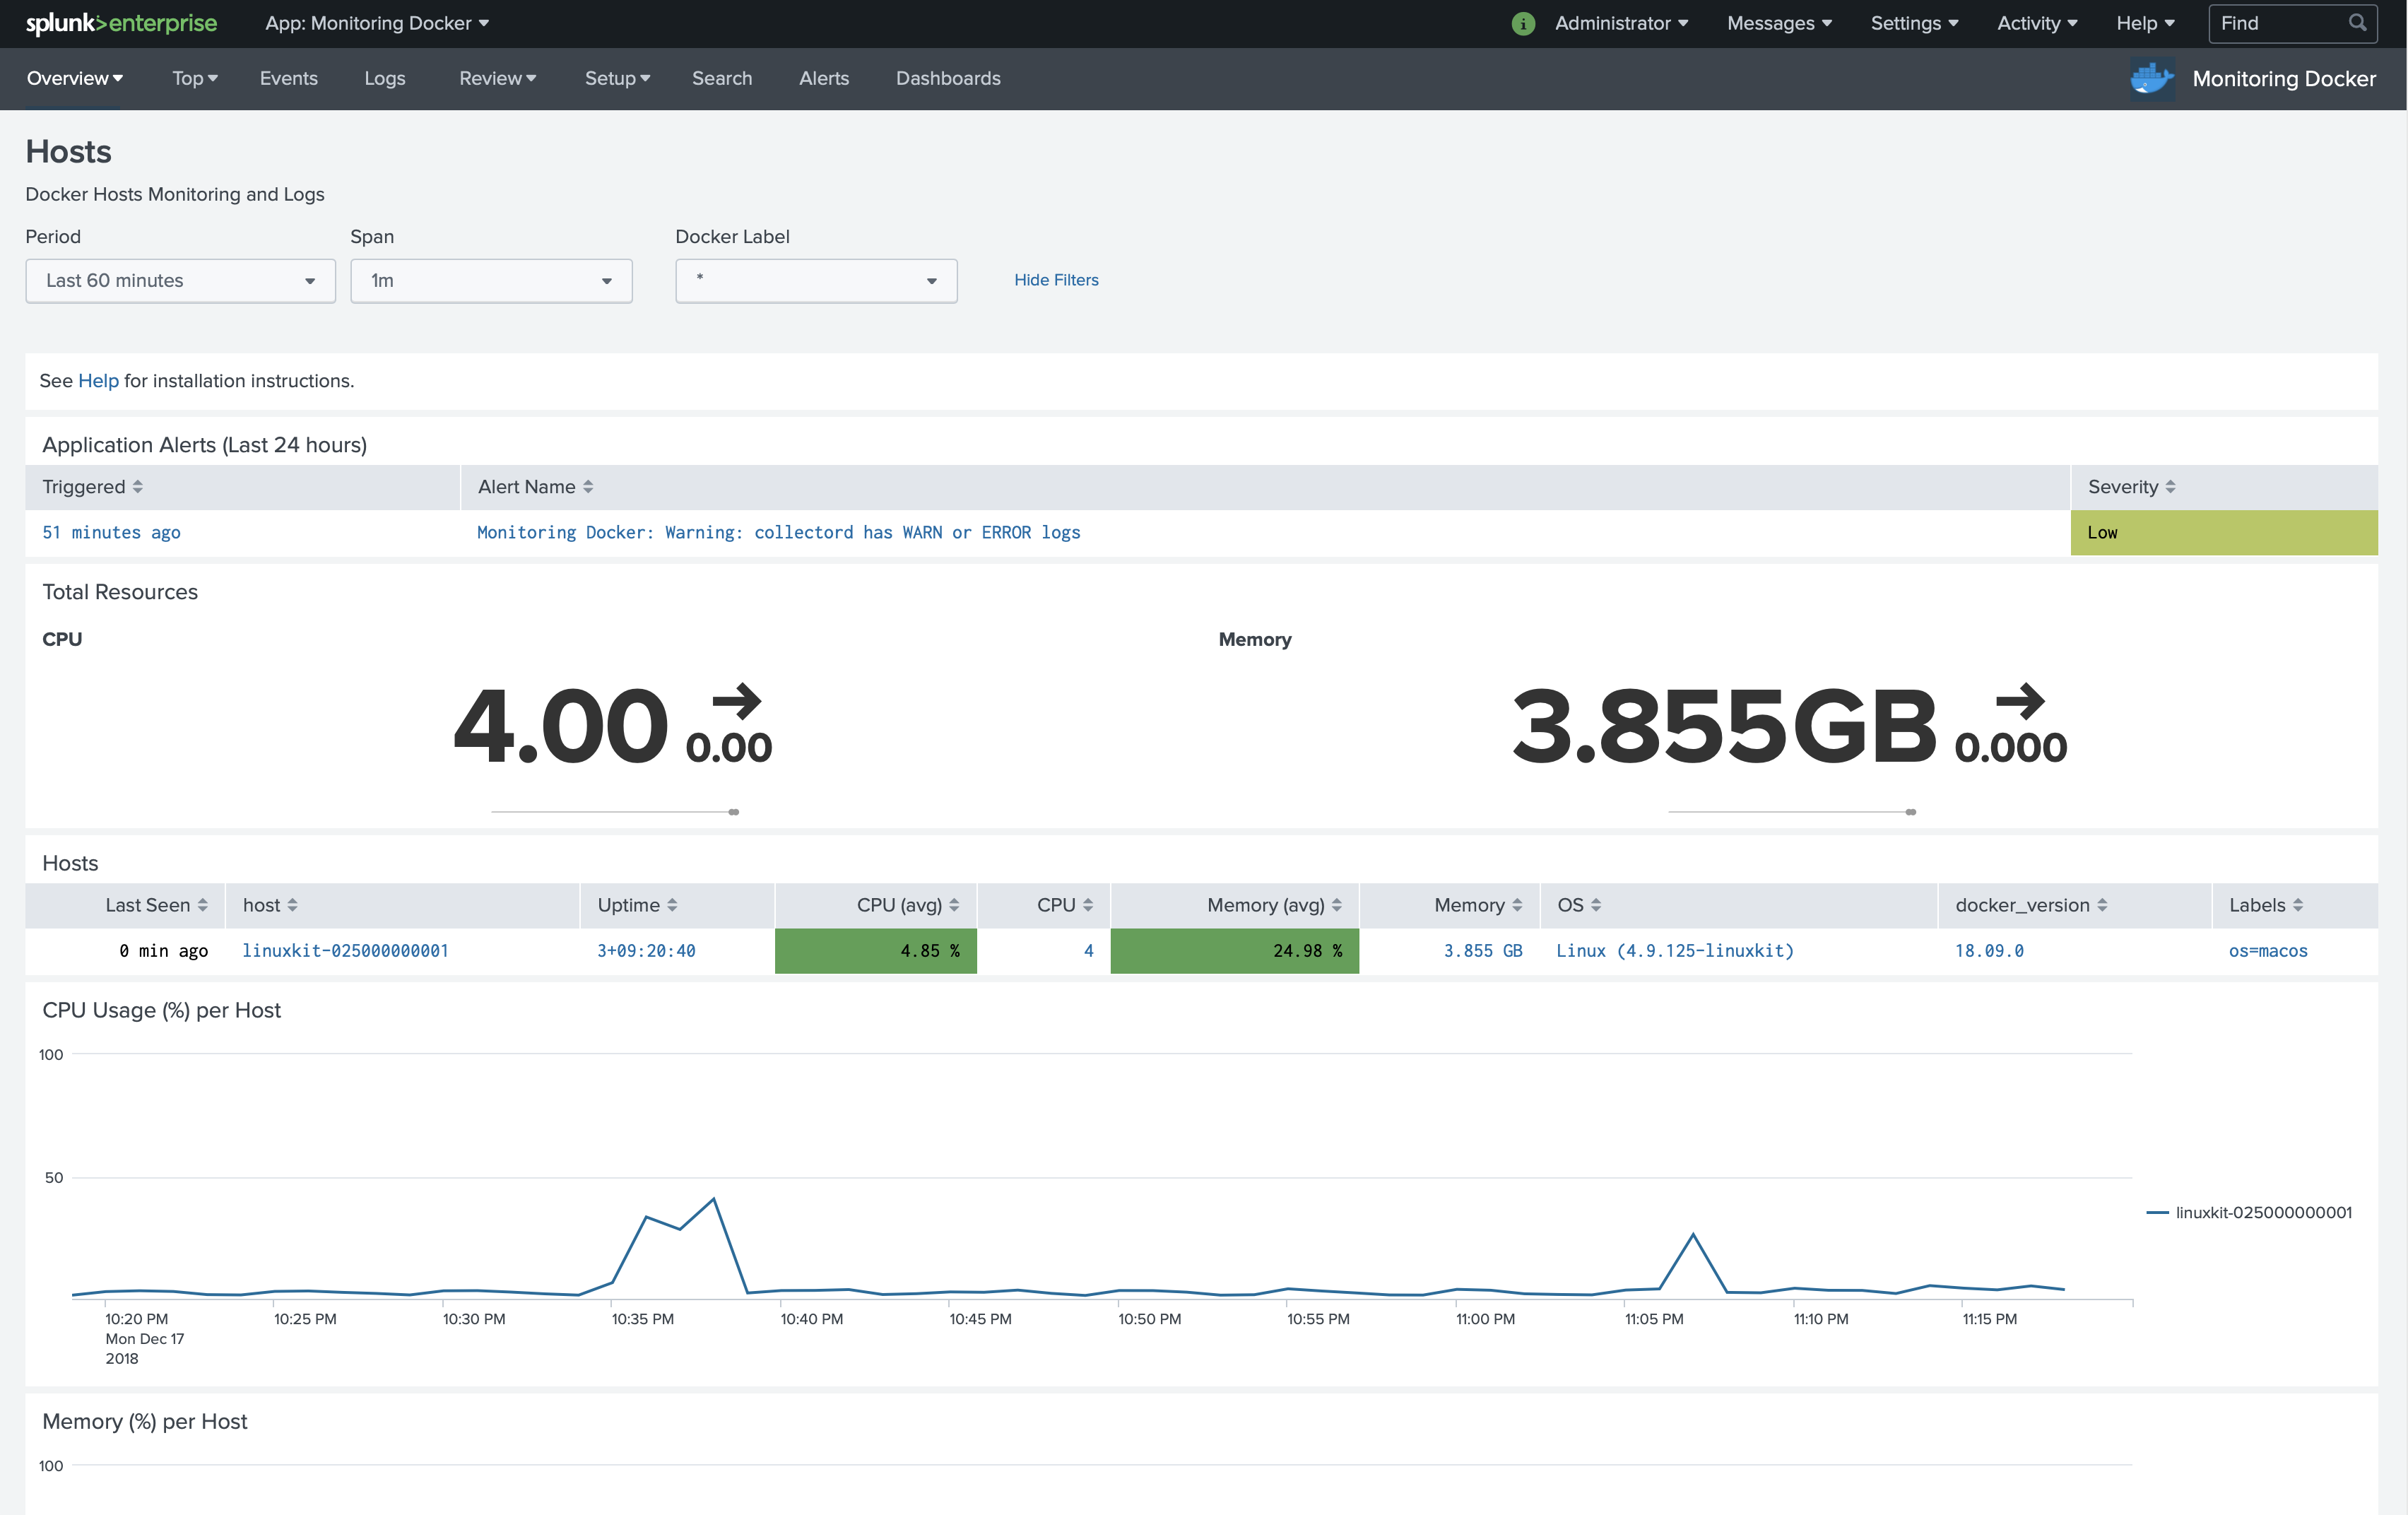
After that, we highly recommend looking at use cases of how you can configure forwarding pipelines with the annotations.
Monitoring Kubernetes
Install Monitoring Kubernetes application in Splunk.
Preparing development box
- Install kubectl
- Install minikube
- Configure minikube
minikube config set cpus 4- adjust CPU (depends on how much CPU your development box has)minikube config set disk-size 60GB- give more disk space for minikube VM (default is 20GB)minikube config set memory 4096- provide more memory (default is 2048)minikube config set vm-driver virtualbox- we have found thatvirtualboxis the most reliablevm-driver; make sure that you have VirtualBox installed.
- Start minikube
minikube start --docker-opt=log-driver=json-file --docker-opt=log-opt=max-size=10M --docker-opt=log-opt=max-file=3 - Verify running minikube and kubectl with
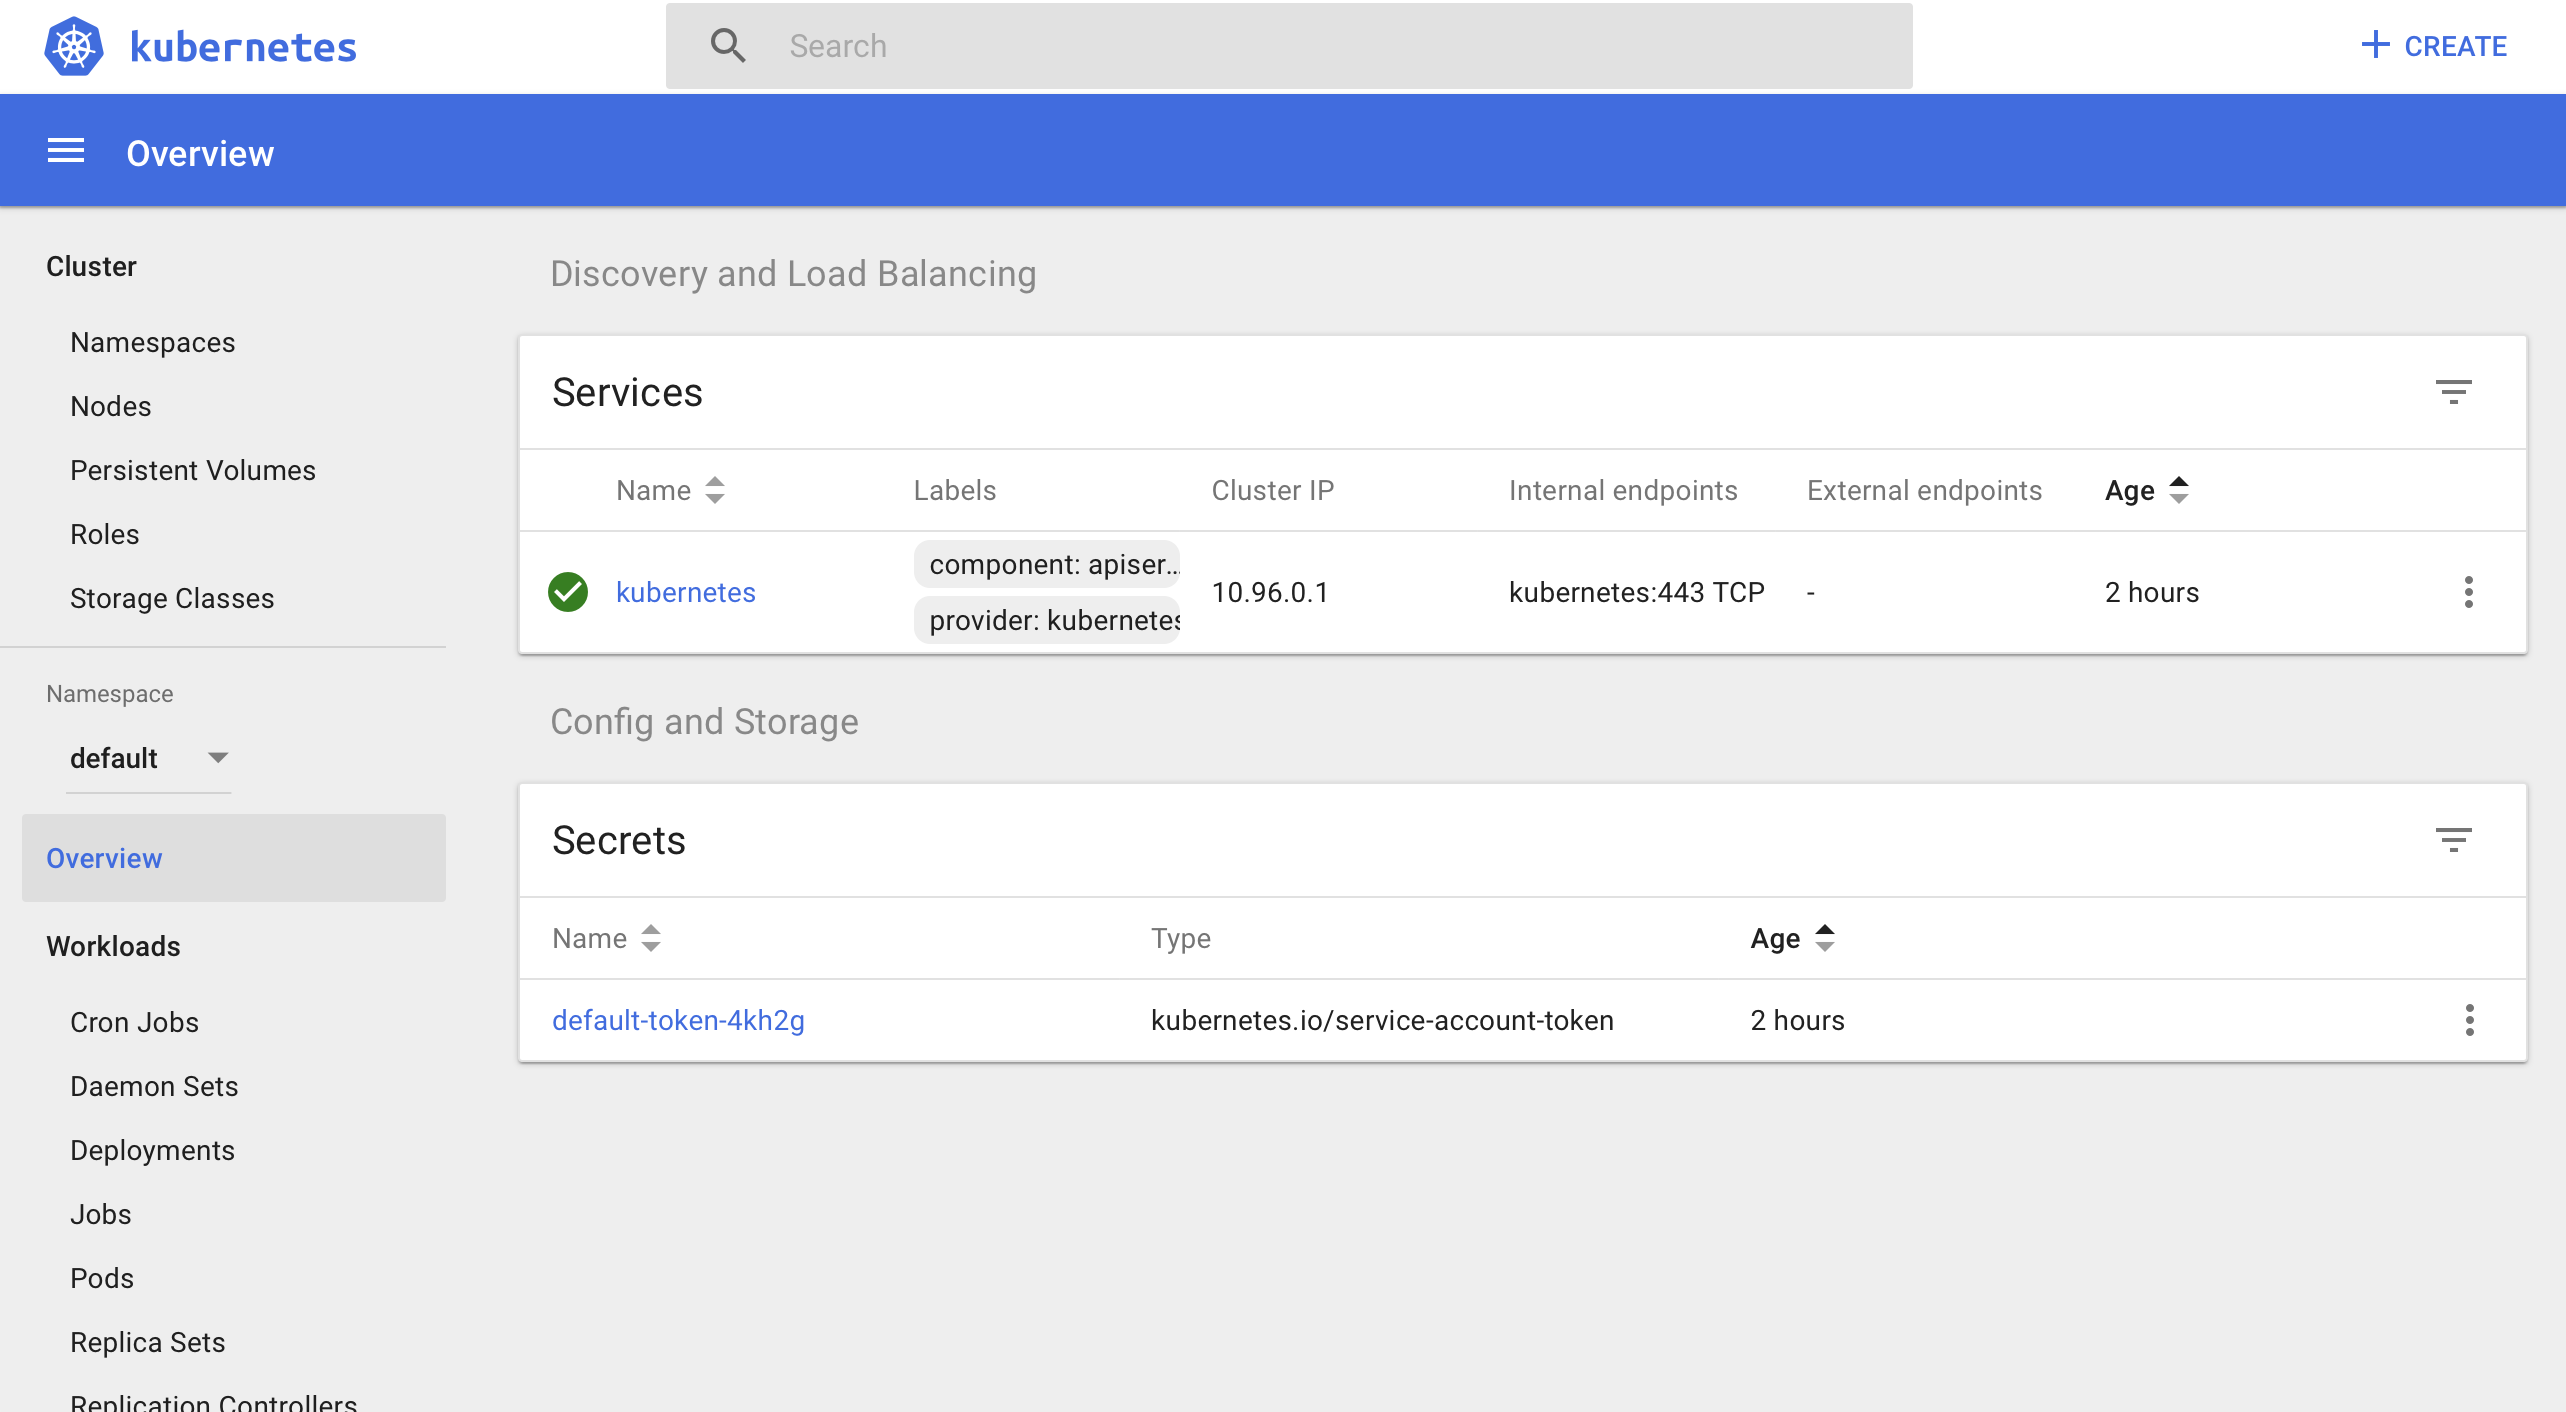
kubectl get nodes - Access Kubernetes Dashboard with
minikube dashboard
Install Collectord on minikube
Use our latest installation instructions to
download the latest YAML configuration file. For Splunk URL use https://10.0.2.2:8088/services/collector/event/1.0 (10.0.2.2
is the host IP address, accessible from the VM), and Token 00000000-0000-0000-0000-000000000000.
Navigate to Monitoring Kubernetes application in Splunk
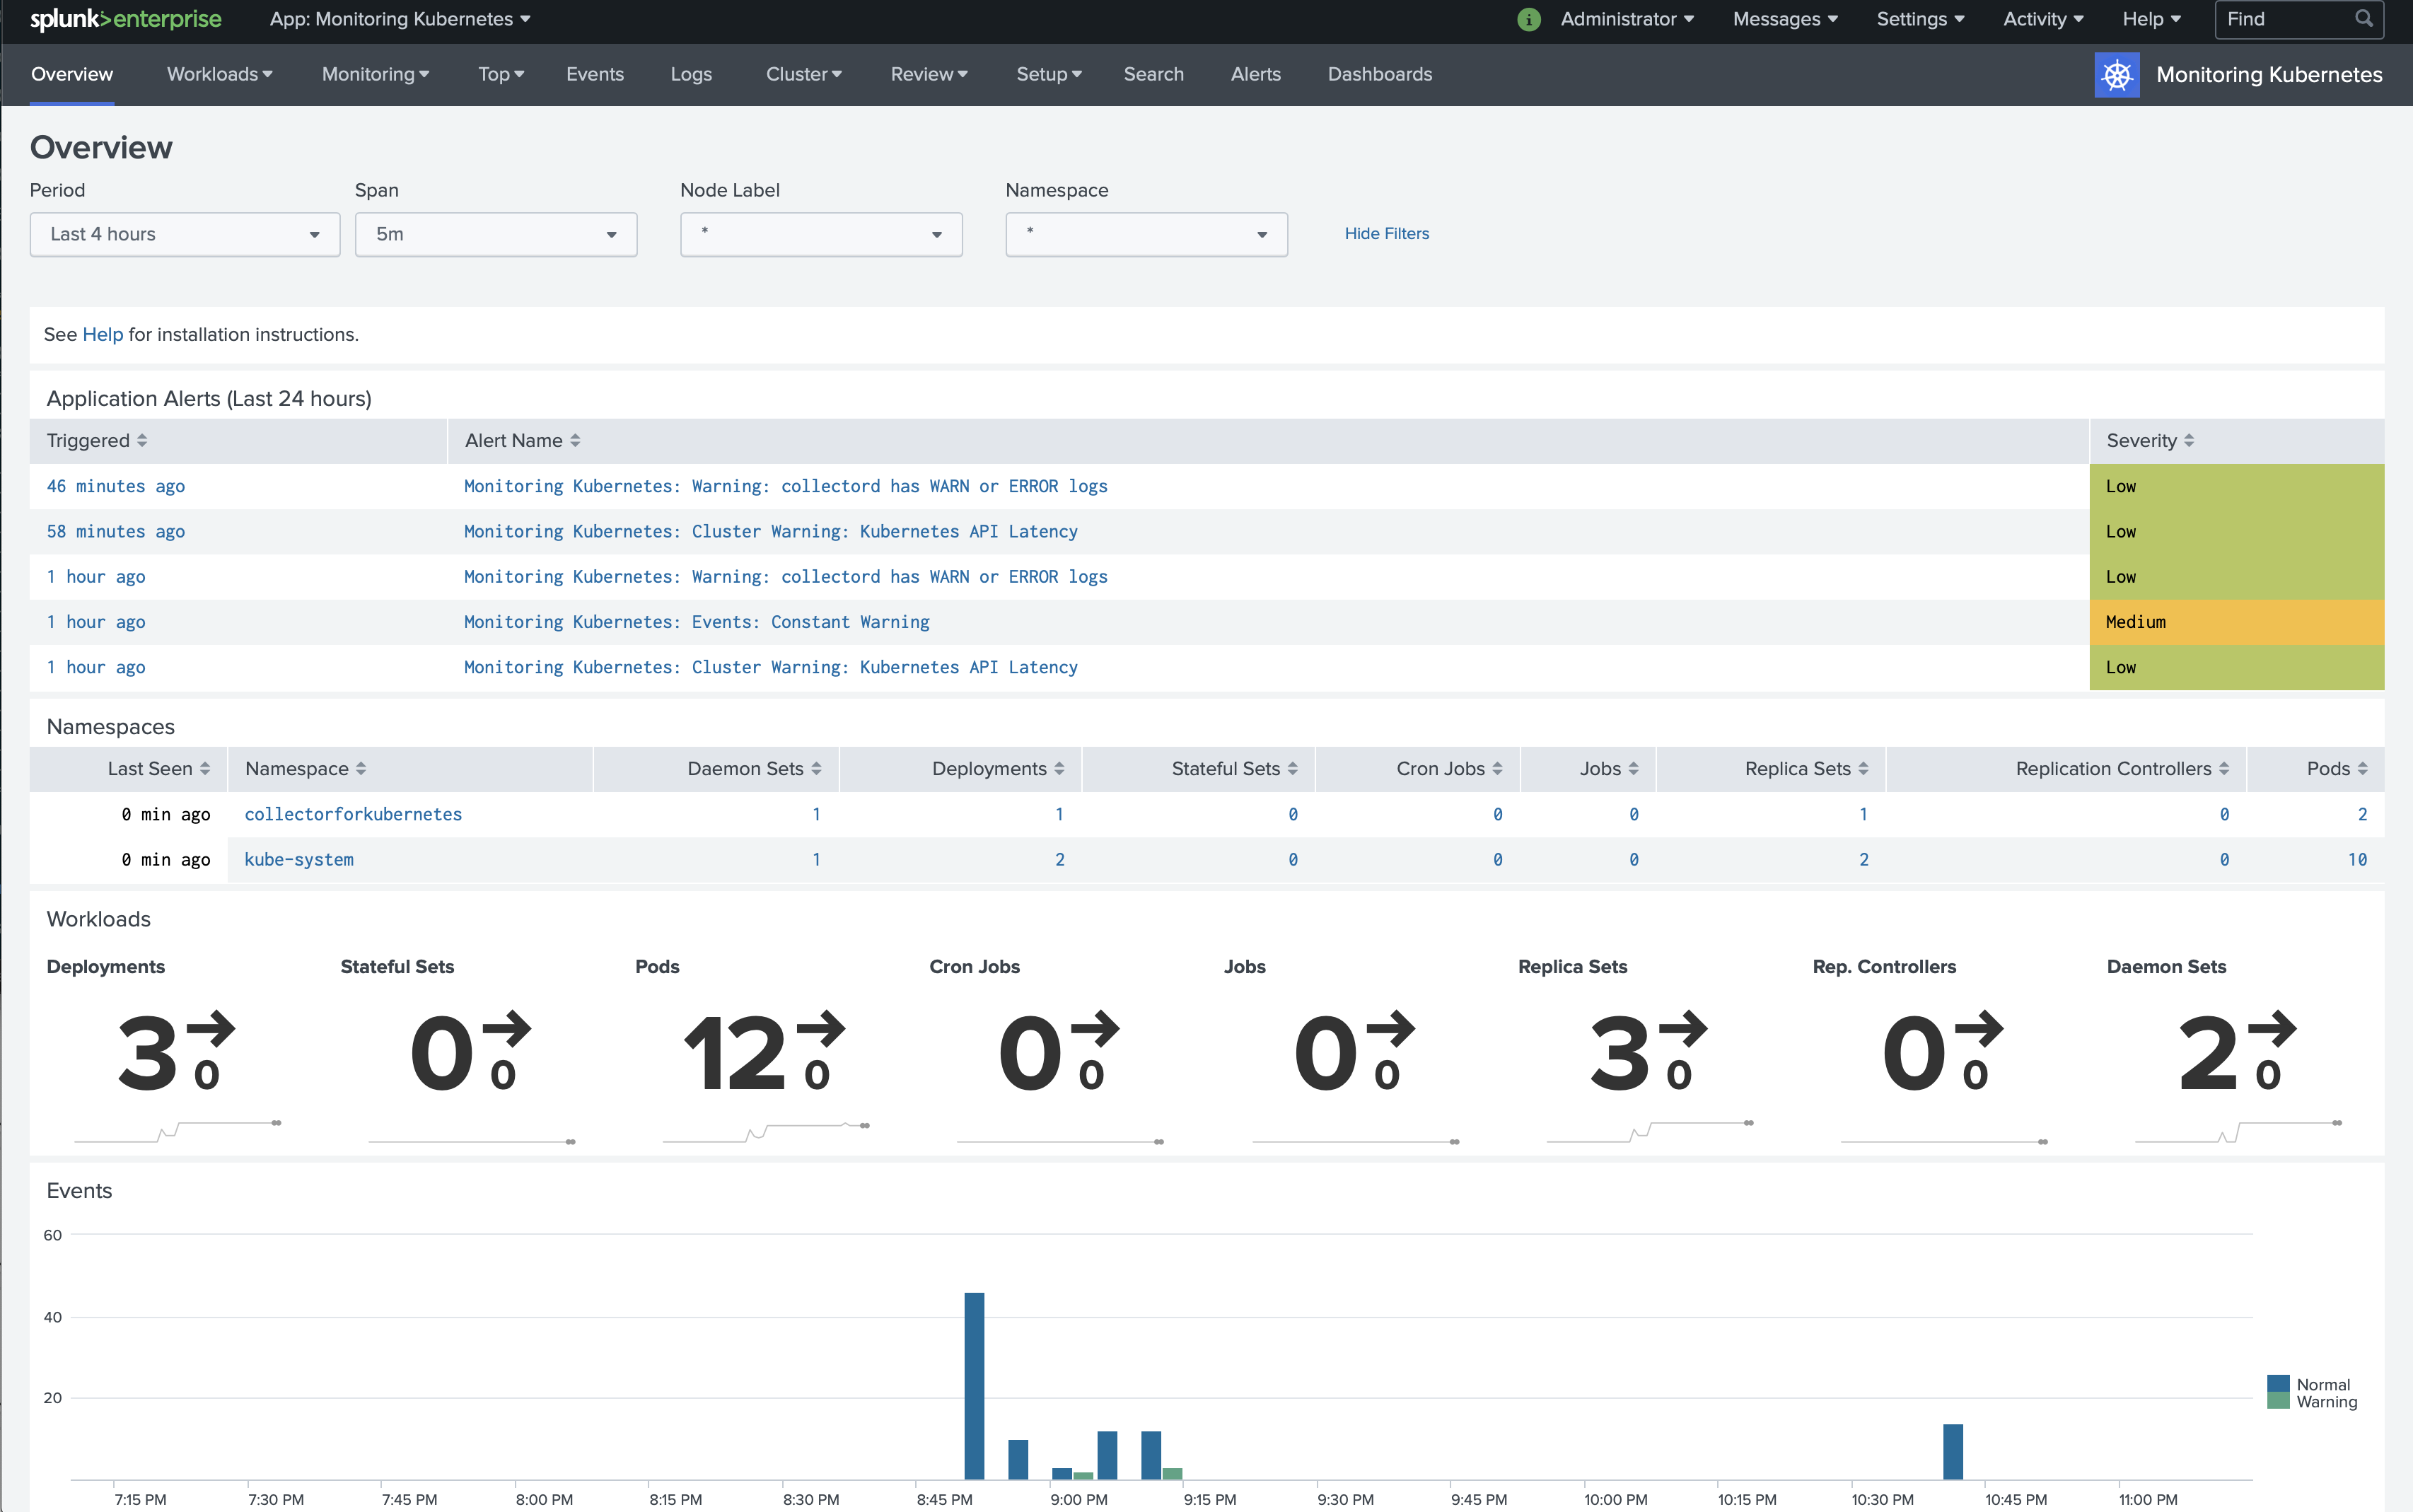
You can try use cases of how to transform and forward additional data the annotations for Collectord.
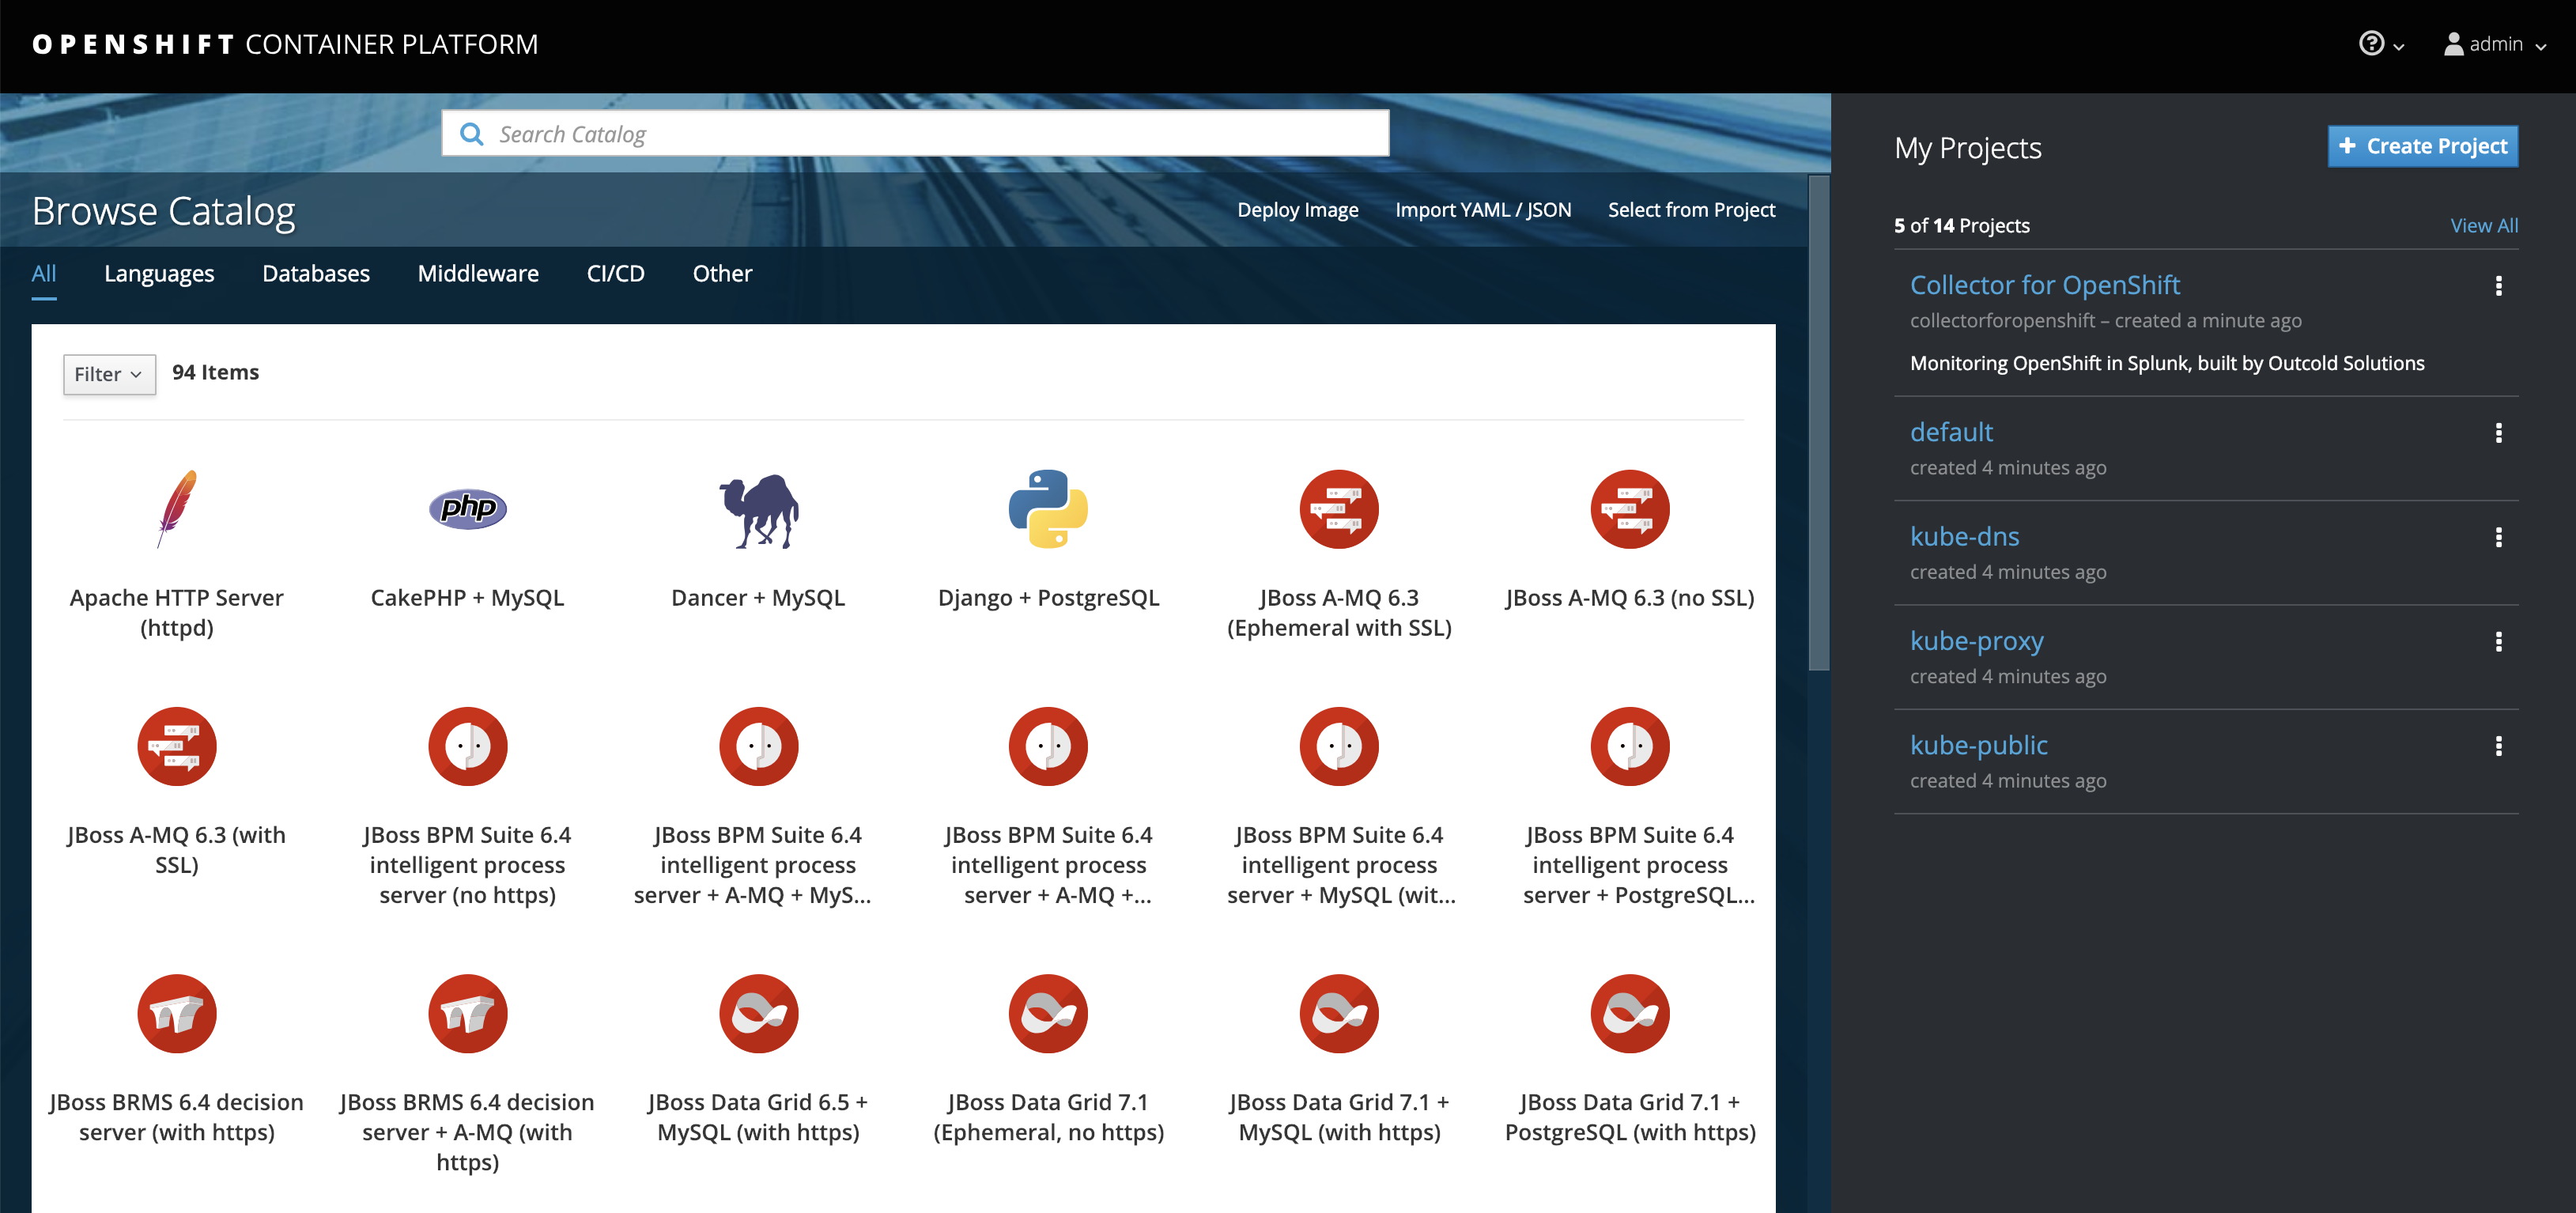
Monitoring OpenShift
Install Monitoring OpenShift application in Splunk.
Preparing development box
You have two options. The first is to use the open source version of minikube from OKD. And the second version is to use Red Hat Container Development Kit (CDK).
- Install minishift from OKD or using CDK.
- Configure minishift
minishift config set cpus 4- adjust CPU (depends on how much CPU your development box has)minishift config set disk-size 60GB- give more disk space for minikube VM (default is 20GB)minishift config set memory 4096- provide more memory (default is 2048)minishift config set vm-driver virtualbox- we have found thatvirtualboxis the most reliablevm-driver; make sure that you have VirtualBox installed.
- Start minishift
minishift start --docker-opt=log-driver=json-file --docker-opt=log-opt=max-size=100M --docker-opt=log-opt=max-file=3. Default configuration is to usejournaldas a log driver, so we need to change it back tojson-file(recommended driver by OpenShift). - Get access to the
ocCLI tool (a replacement forkubectlin the case of OpenShift)eval $(minishift oc-env). - Login as
adminuseroc login -u system:admin. - Fix the label for this node; make it
masterbyoc label node localhost node-role.kubernetes.io/master=true(that helps our configuration recognize this node as a master and start collecting more data). - Access Web Console with
minishift console, use usernameadminand passwordredhat.
Install Collectord on minishift
Use our latest installation instructions to
download the latest YAML configuration file. For Splunk URL use https://10.0.2.2:8088/services/collector/event/1.0 (10.0.2.2
is the host IP address, accessible from the VM), and Token 00000000-0000-0000-0000-000000000000.
After downloading the YAML configuration file, fix the location for the local volumes with
sed -i.bak 's|/var/lib/origin|/var/lib/minishift/base|' collectorforopenshift.yaml.
Navigate to Monitoring OpenShift application in Splunk
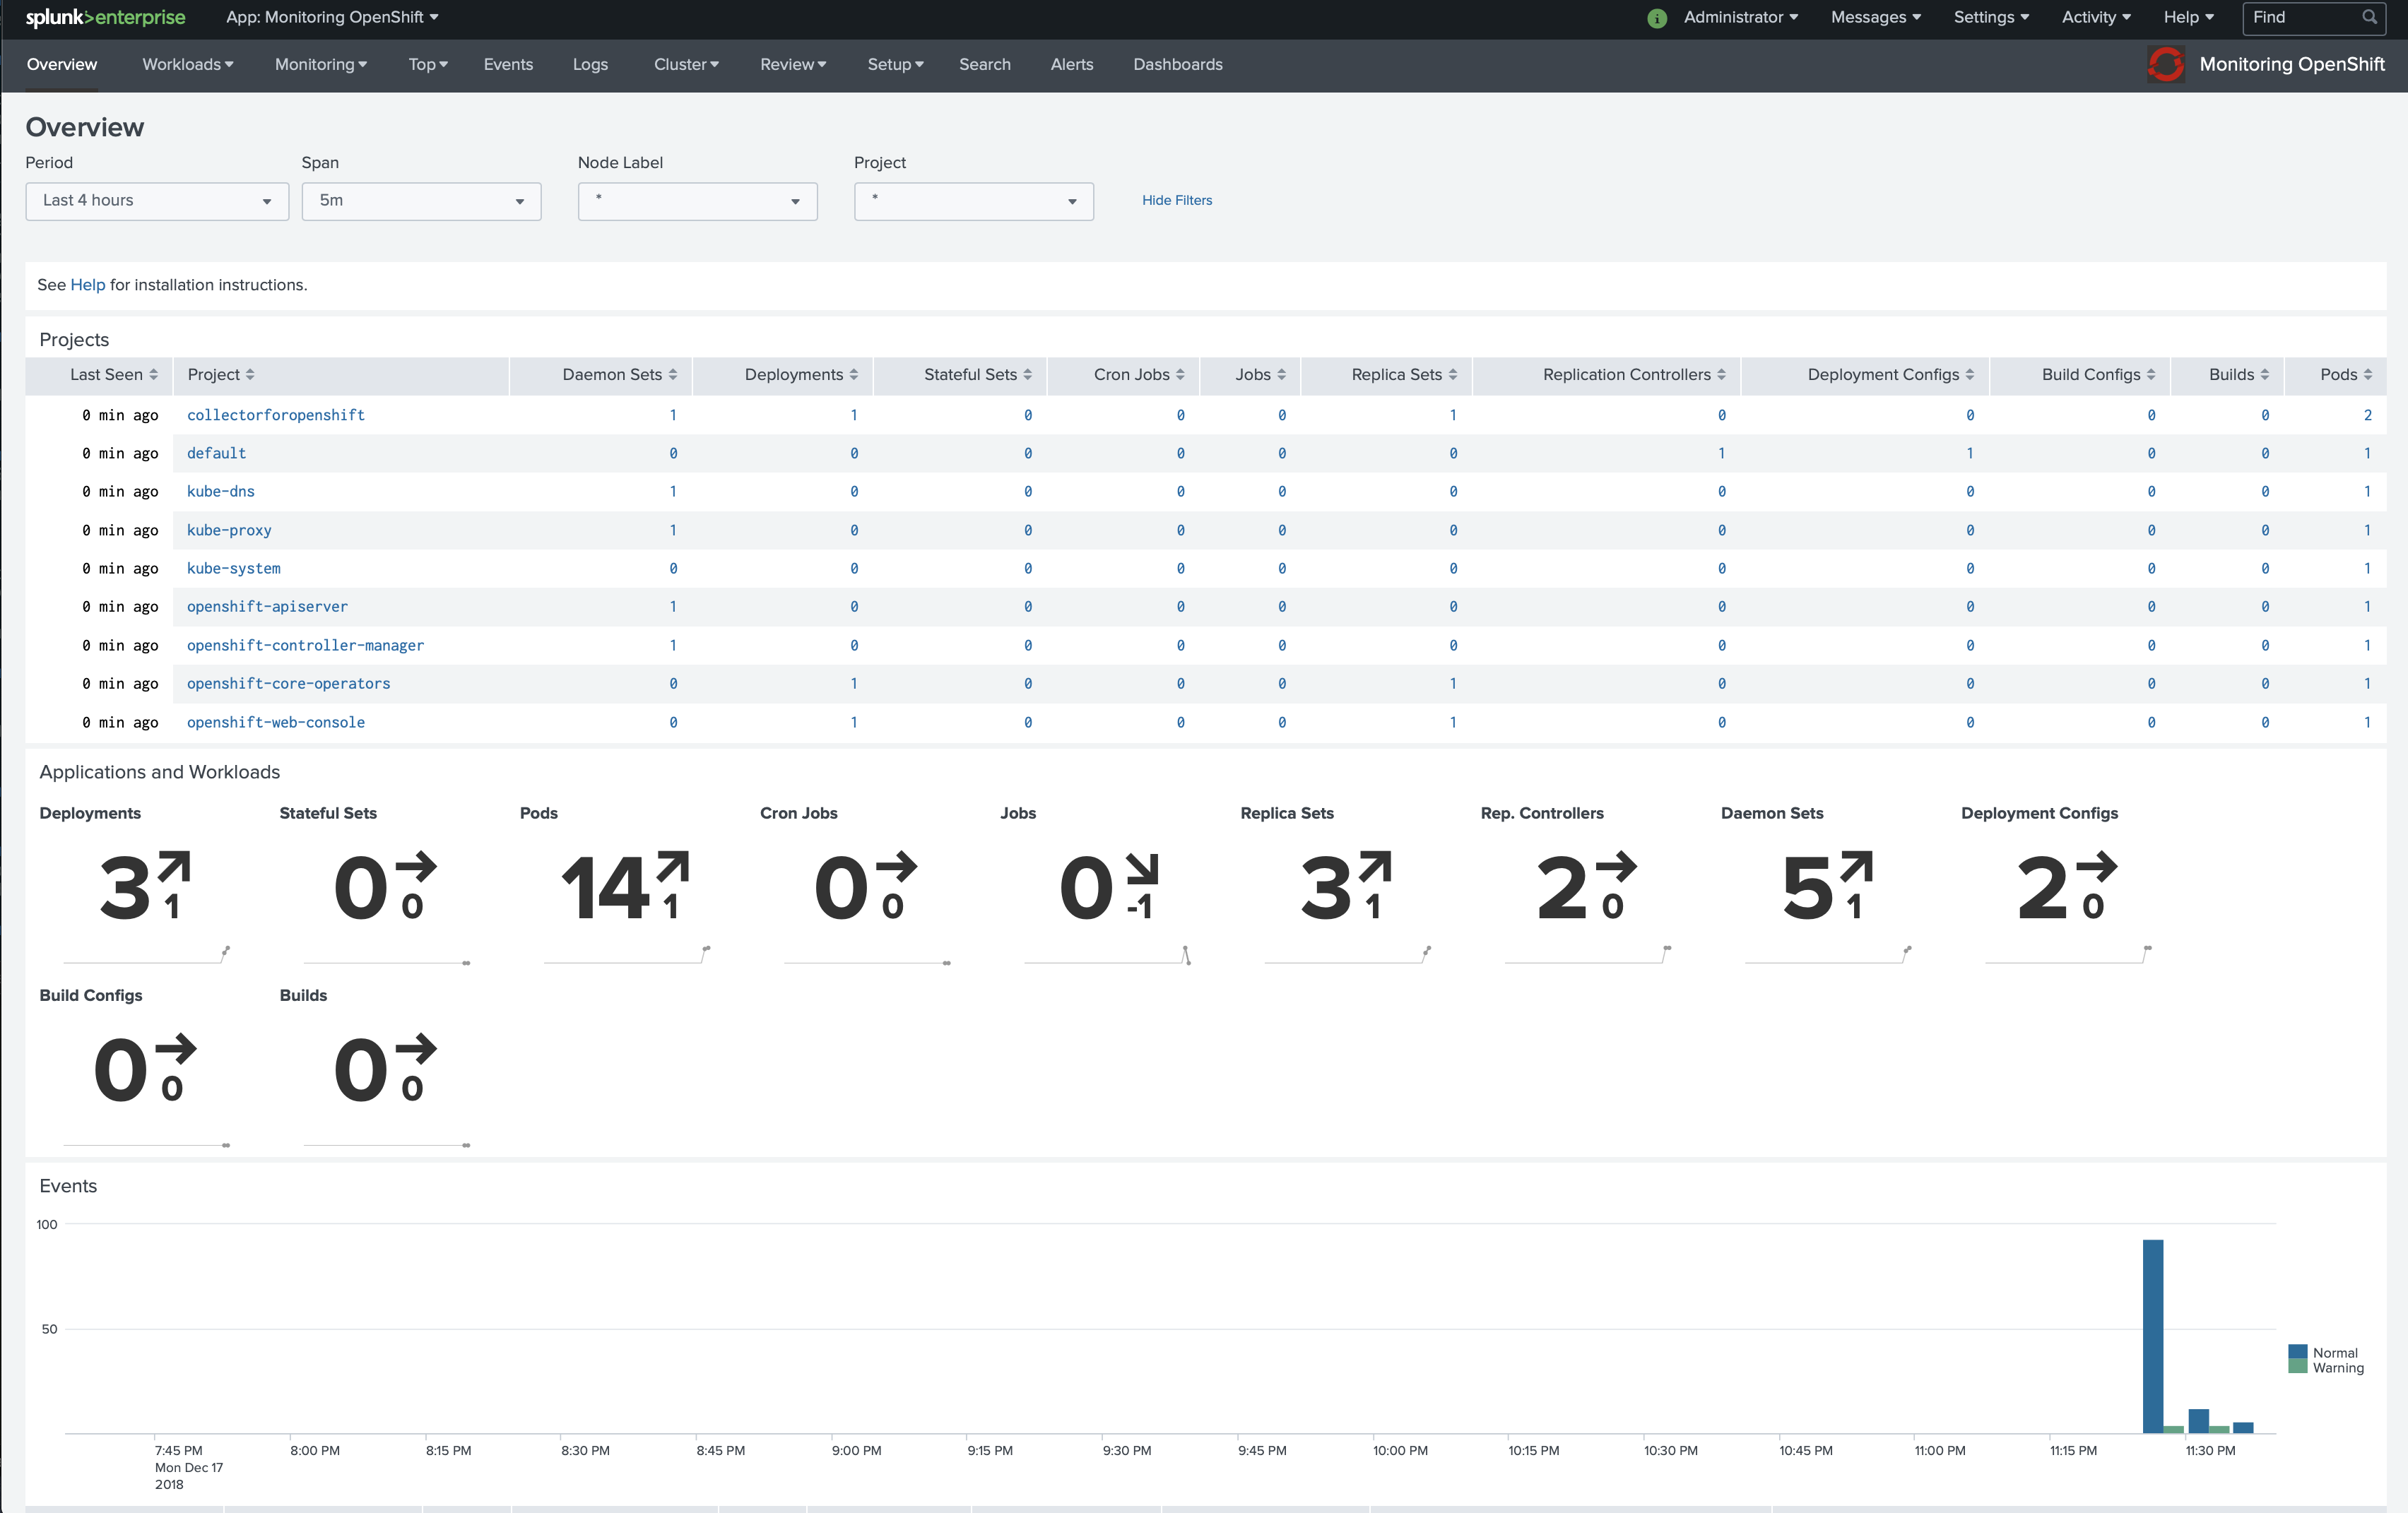
You can try use cases of how to transform and forward additional data the annotations for Collectord.
Learning Kubernetes and OpenShift
If you have just started learning Kubernetes and OpenShift, take a look at Kubernetes tutorials and OKD documentation and Red Hat OpenShift Documentation.
To learn more about Kubernetes and real Kubernetes clusters, I would highly recommend to try using kubeadm to bootstrap local Kubernetes cluster in the Virtual Machines with vagrant.
While you are learning and building applications for Kubernetes you can use our Development License, that is valid for 180 days and allows to monitor up to 5 nodes. Fill the automated form and you will receive the license in a few moments.


