Blog
Performance comparison between Collectord, Fluentd and Fluent-bit
New version 5.3 of our solution for Monitoring Docker, Kubernetes and OpenShift in Splunk comes with an updated Collectord, our container-native software for discovering, transforming and forwarding logs, and for collecting metrics.
We run performance tests using the same tools as we used a few weeks ago in the blog post Forwarding 10,000 1k events per second generated by containers from a single host with ease, and we are excited to share these results with you.
Forwarding 5,000 1KB events per second. Default configuration.
Compared to Version 5.2 CPU usage went down from 40% to 26%. Memory usage went down from 120MB to 38MB.
Comparing performance with Fluentd and Fluent-bit
We were asked a LOT how Collectord performs compared to Fluentd and Fluent-bit. This time we included both Fluentd and Fluent-Bit in our tests. We used Splunk Connect for Kubernetes (v1.0.1, Apache License 2.0) as a Fluentd distribution, and Fluent-bit from fluent/fluent-bit-kubernetes-logging (v0.14.6, Apache License 2.0), with output
1[OUTPUT]
2    Name         splunk
3    Match        *
4    Host         ec2-52-89-58-42.us-west-2.compute.amazonaws.com
5    Port         8088
6    TLS          On
7    TLS.Verify   Off
8    Splunk_Token fdc8aa7a-de1d-494a-8fef-821a9936a589
We disabled Gzip compression for Collectord, because both Fluentd and Fluent-bit do not use gzip compression by default. Although we recommend keeping Gzip compression enabled to reduce the volume of network traffic. We disabled metrics collection for Collectord to only compare the performance of log forwarding capabilities.
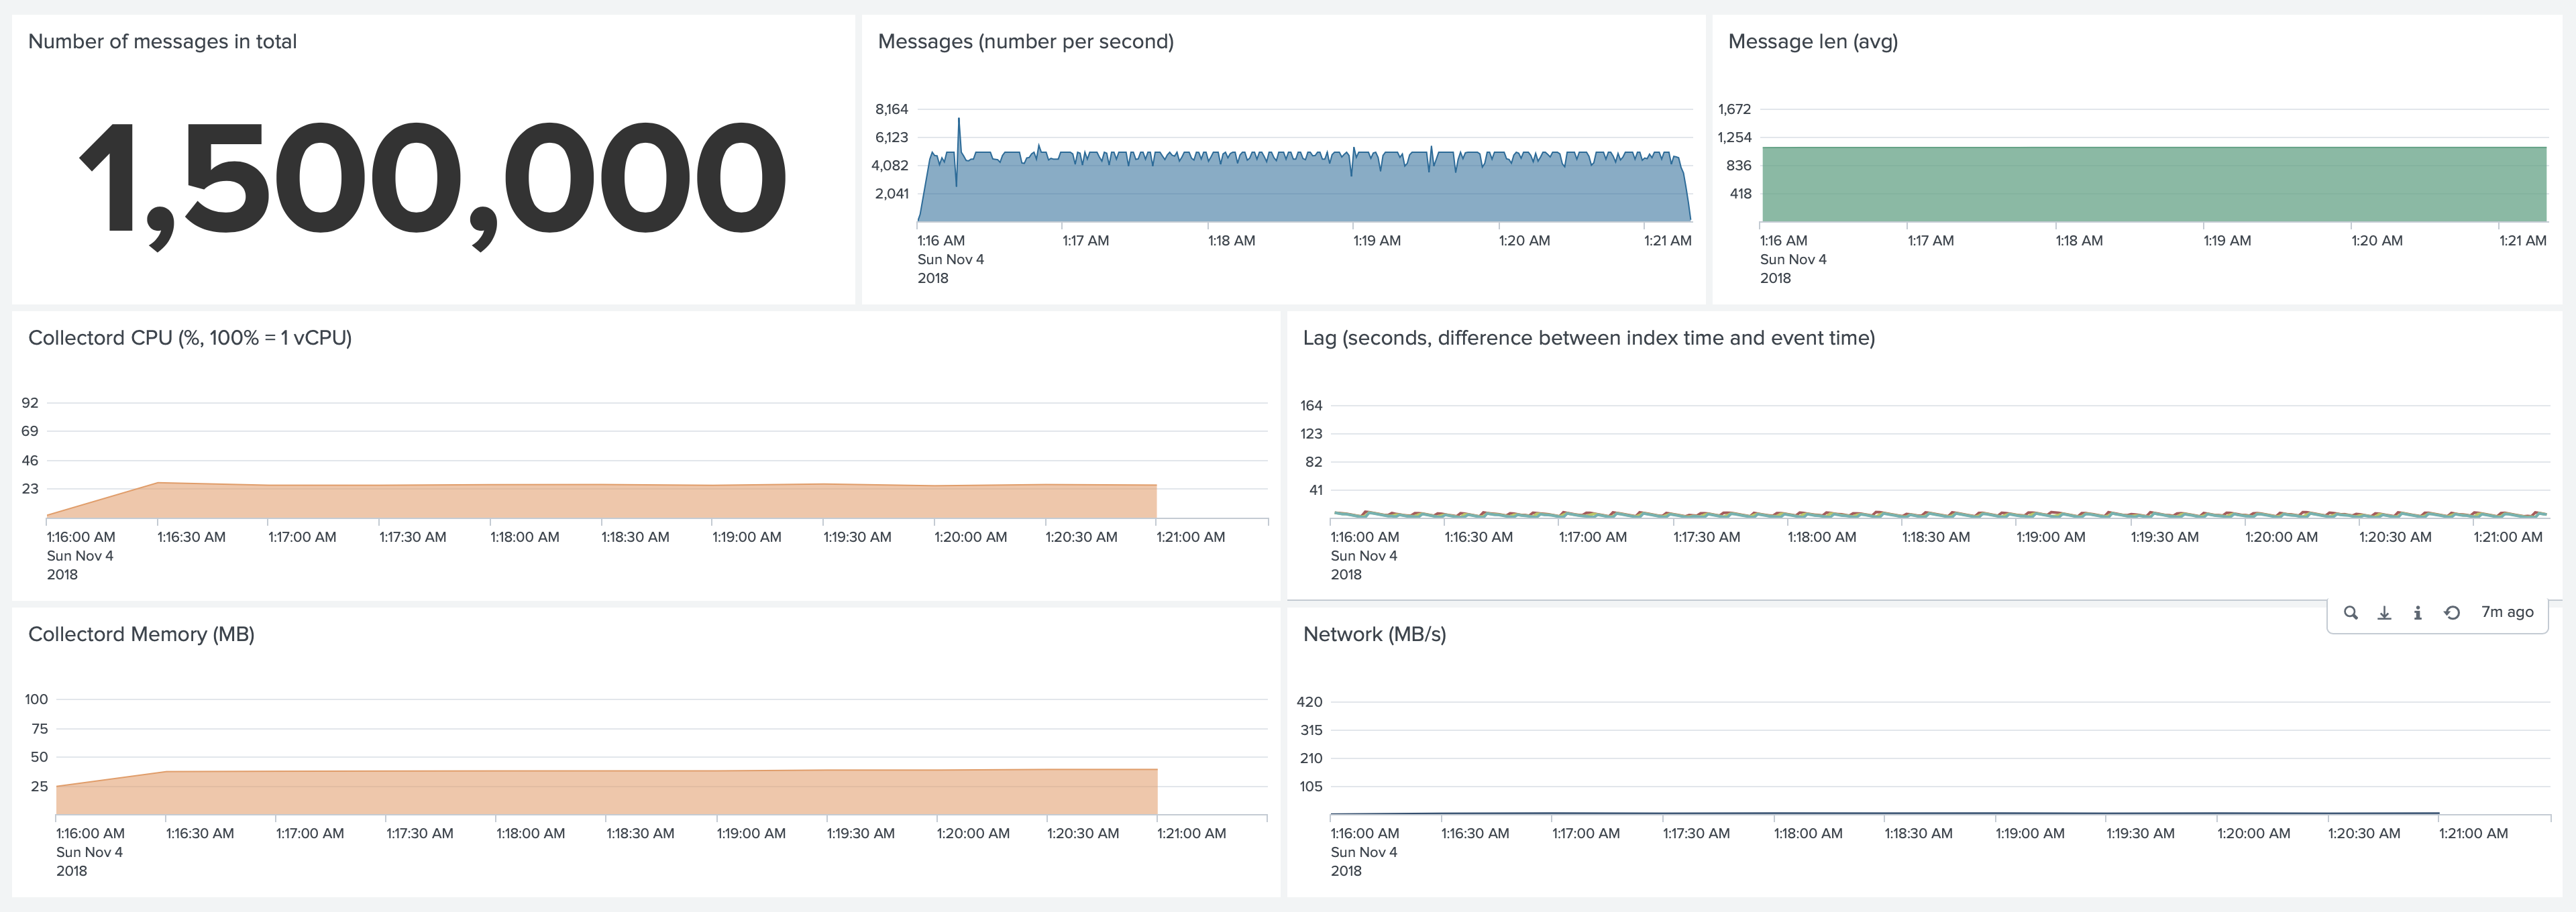
Test 1. Forwarding 5,000 1KB events per second.
Collectord.
Without Gzip compression and metrics collection, CPU Usage went down to 20%, and memory usage to 32MB. And network transmit
went up to around 400MB/s, compared to 4MB/s with gzip compression enabled.
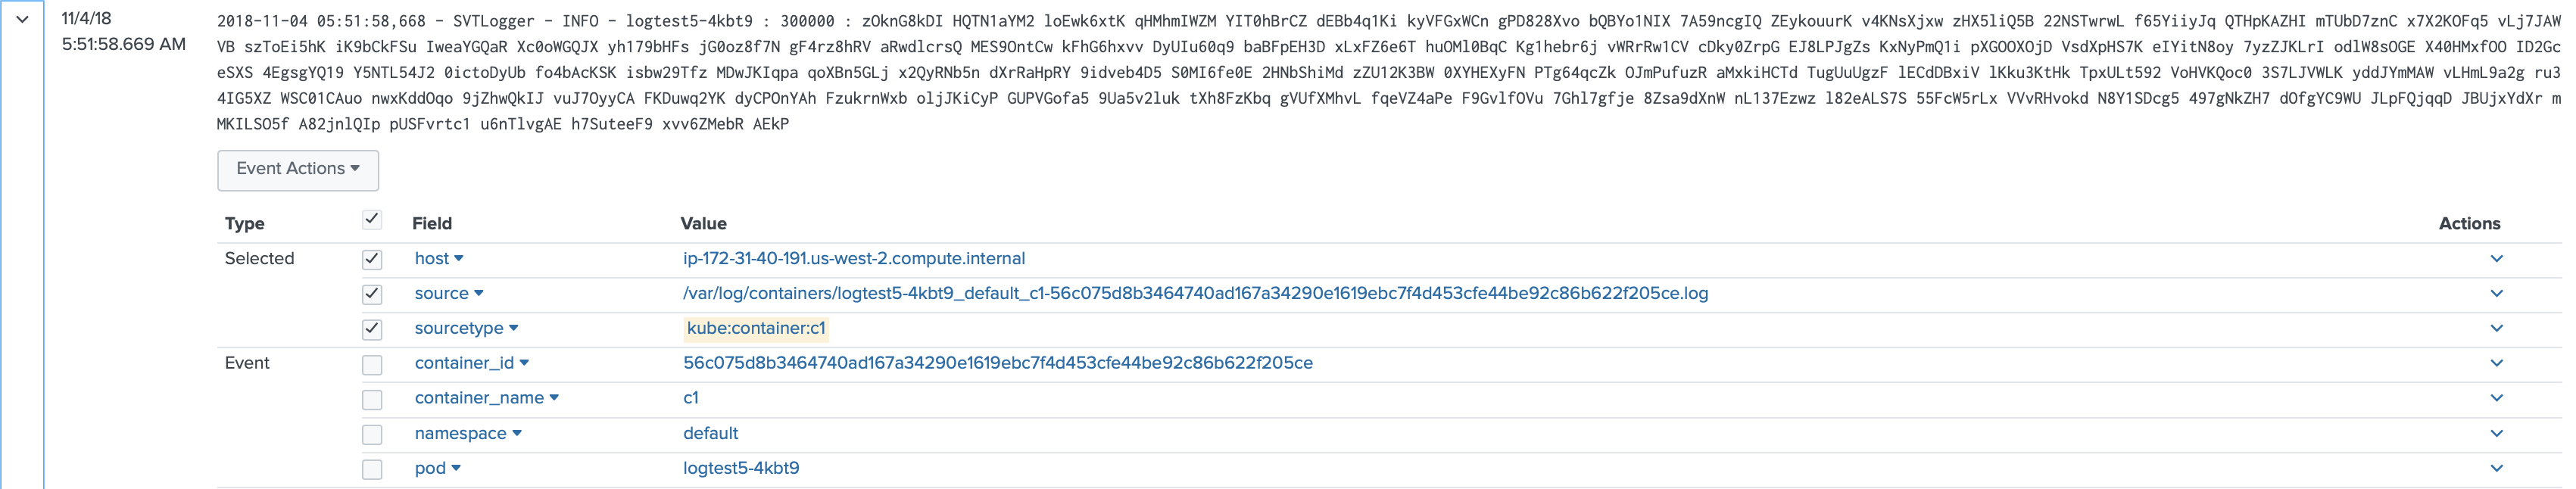
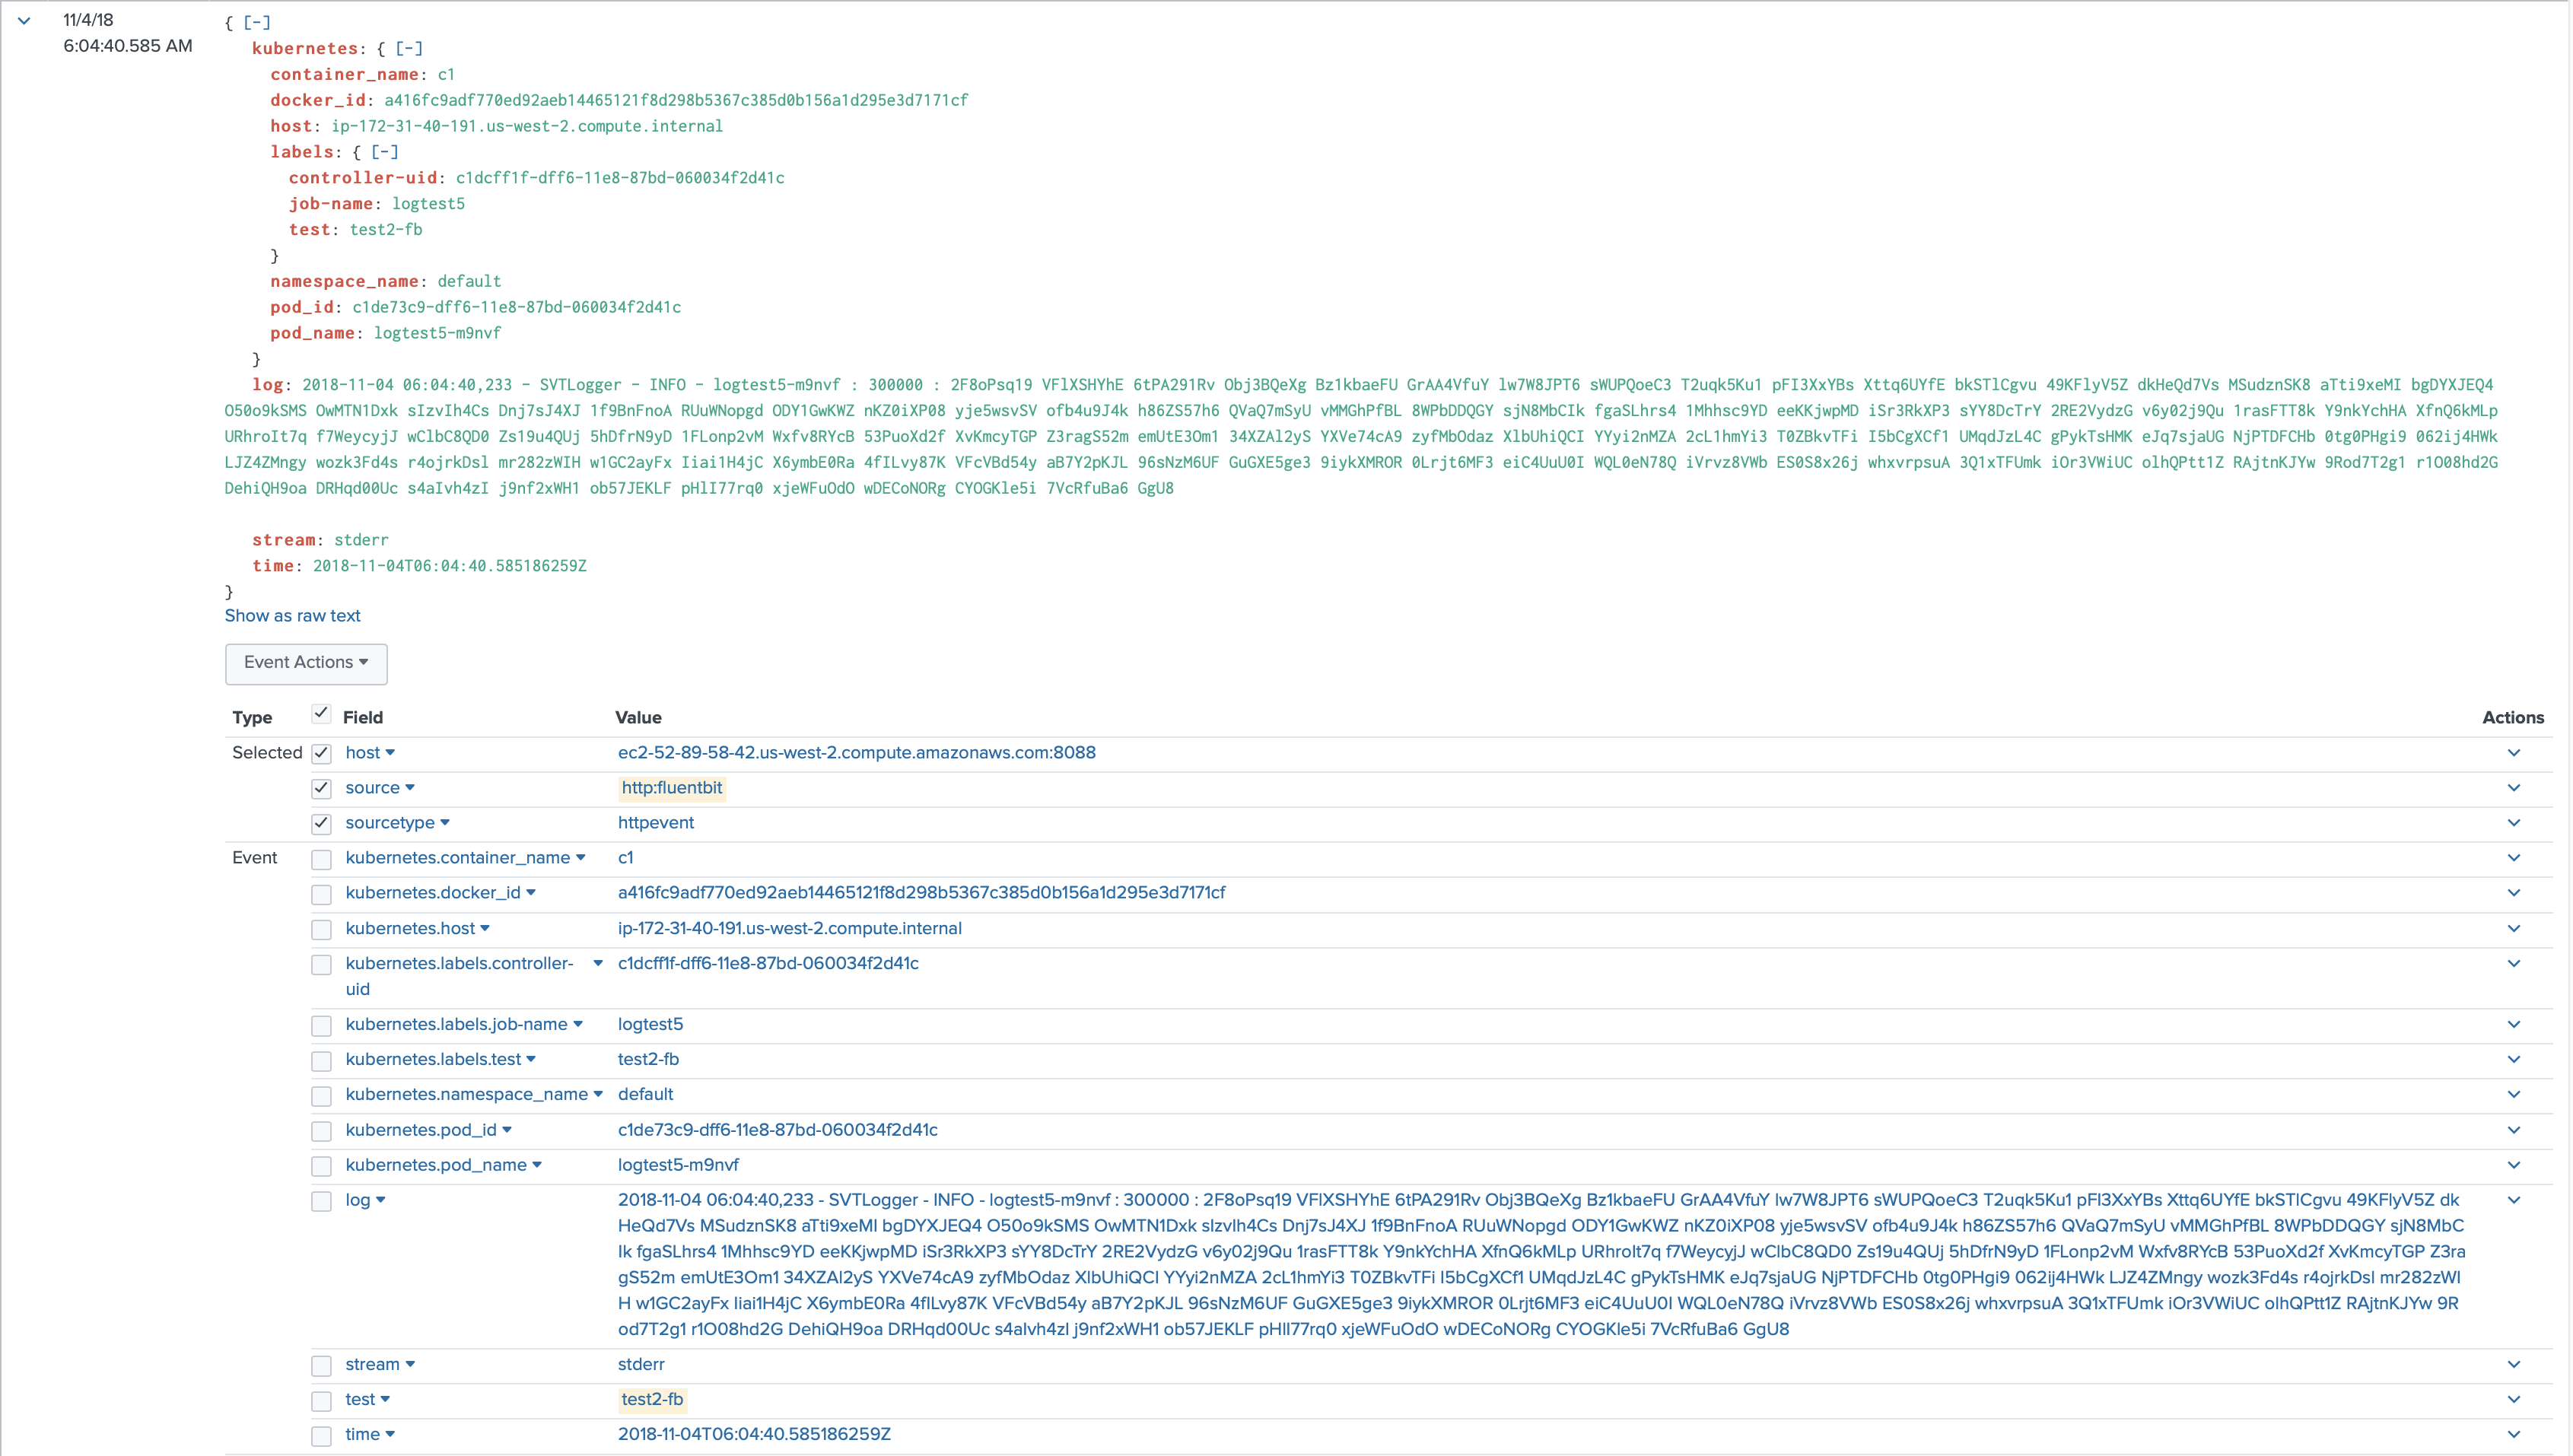
Log format. Collectord attaches metadata from the Pods and Owner workloads as pre-indexed fields to the logs, that allows you to search the logs by Pod name, Job name, Job labels and more. The format of the logs is exactly the same as container writes them to the standard output.
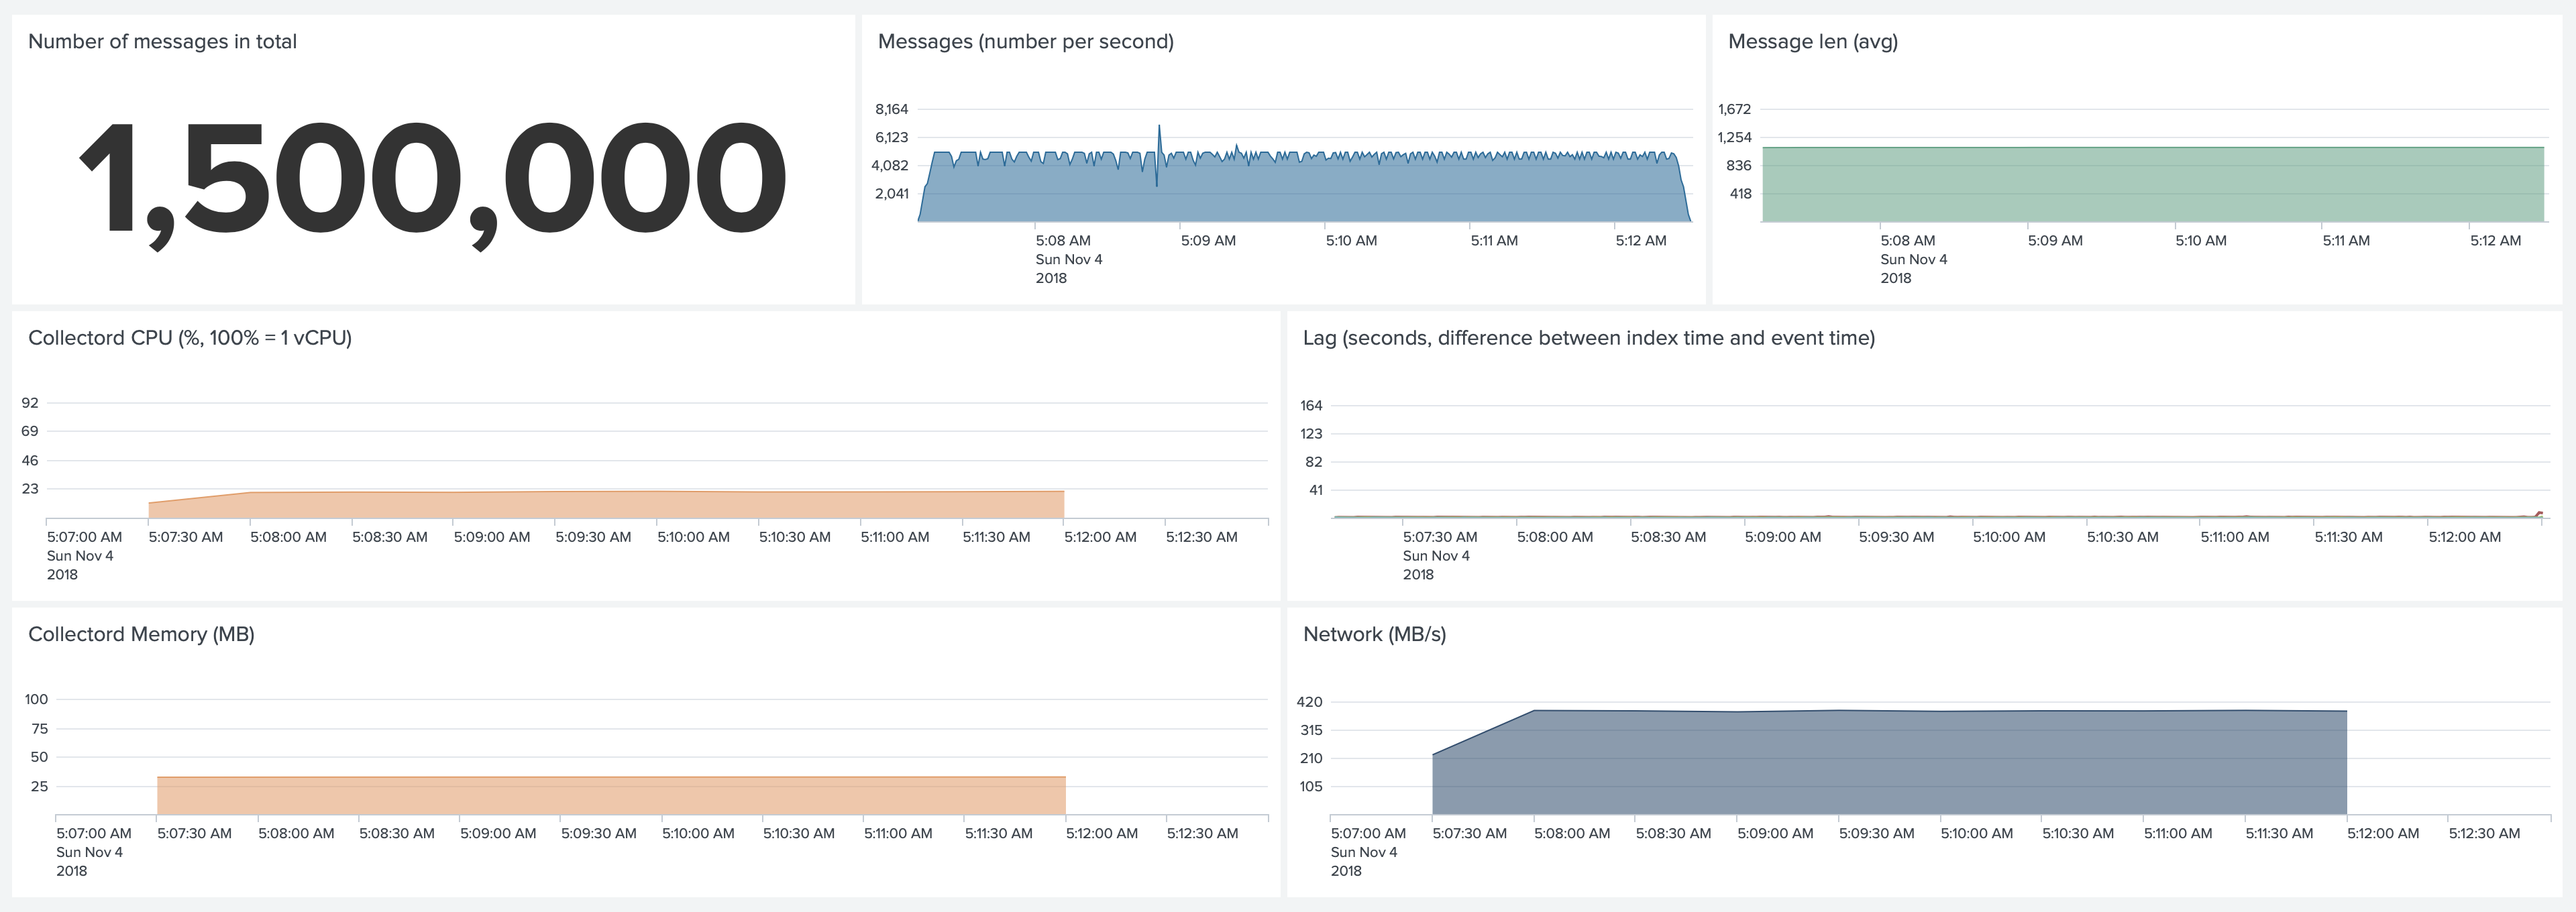
Fluentd. Default configuration.
Fluentd used 80% CPU and 120Mb of Memory. It started forwarding events only 20 seconds after Pods were started (as
reflected by the Lag dashboard), but it could catch up and keep up with this volume of logs.
In both CPU and Memory graphs, the orange line represents an average CPU and Memory usage of the Collectord for comparison.
The number of attached pre-indexed fields is fewer compared to Collectord. Fluentd only attaches metadata from the Pod, but not from the Owner workload, that is the reason, why Fluentd uses less Network traffic. The format of the logs is exactly the same as container writes them to the standard output.
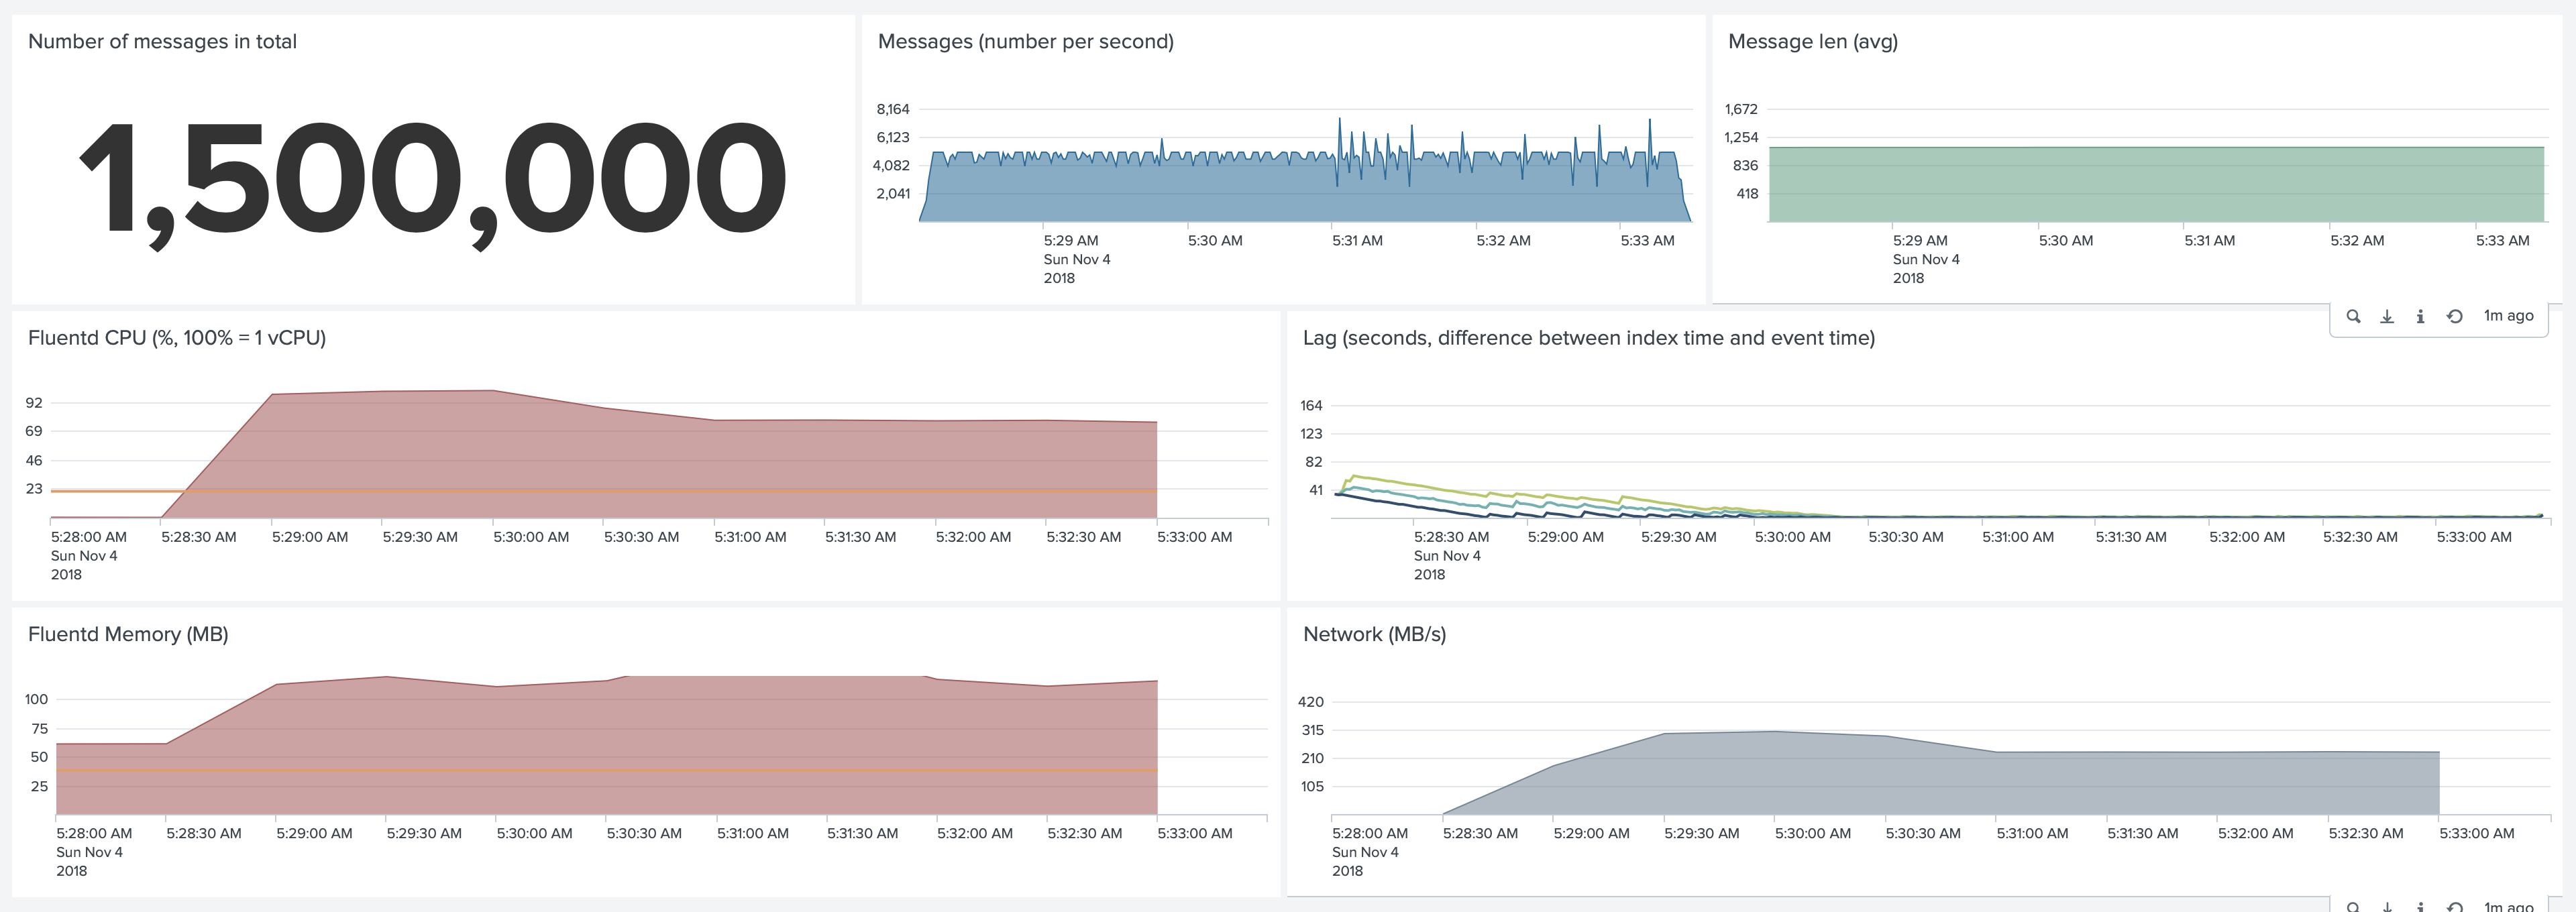
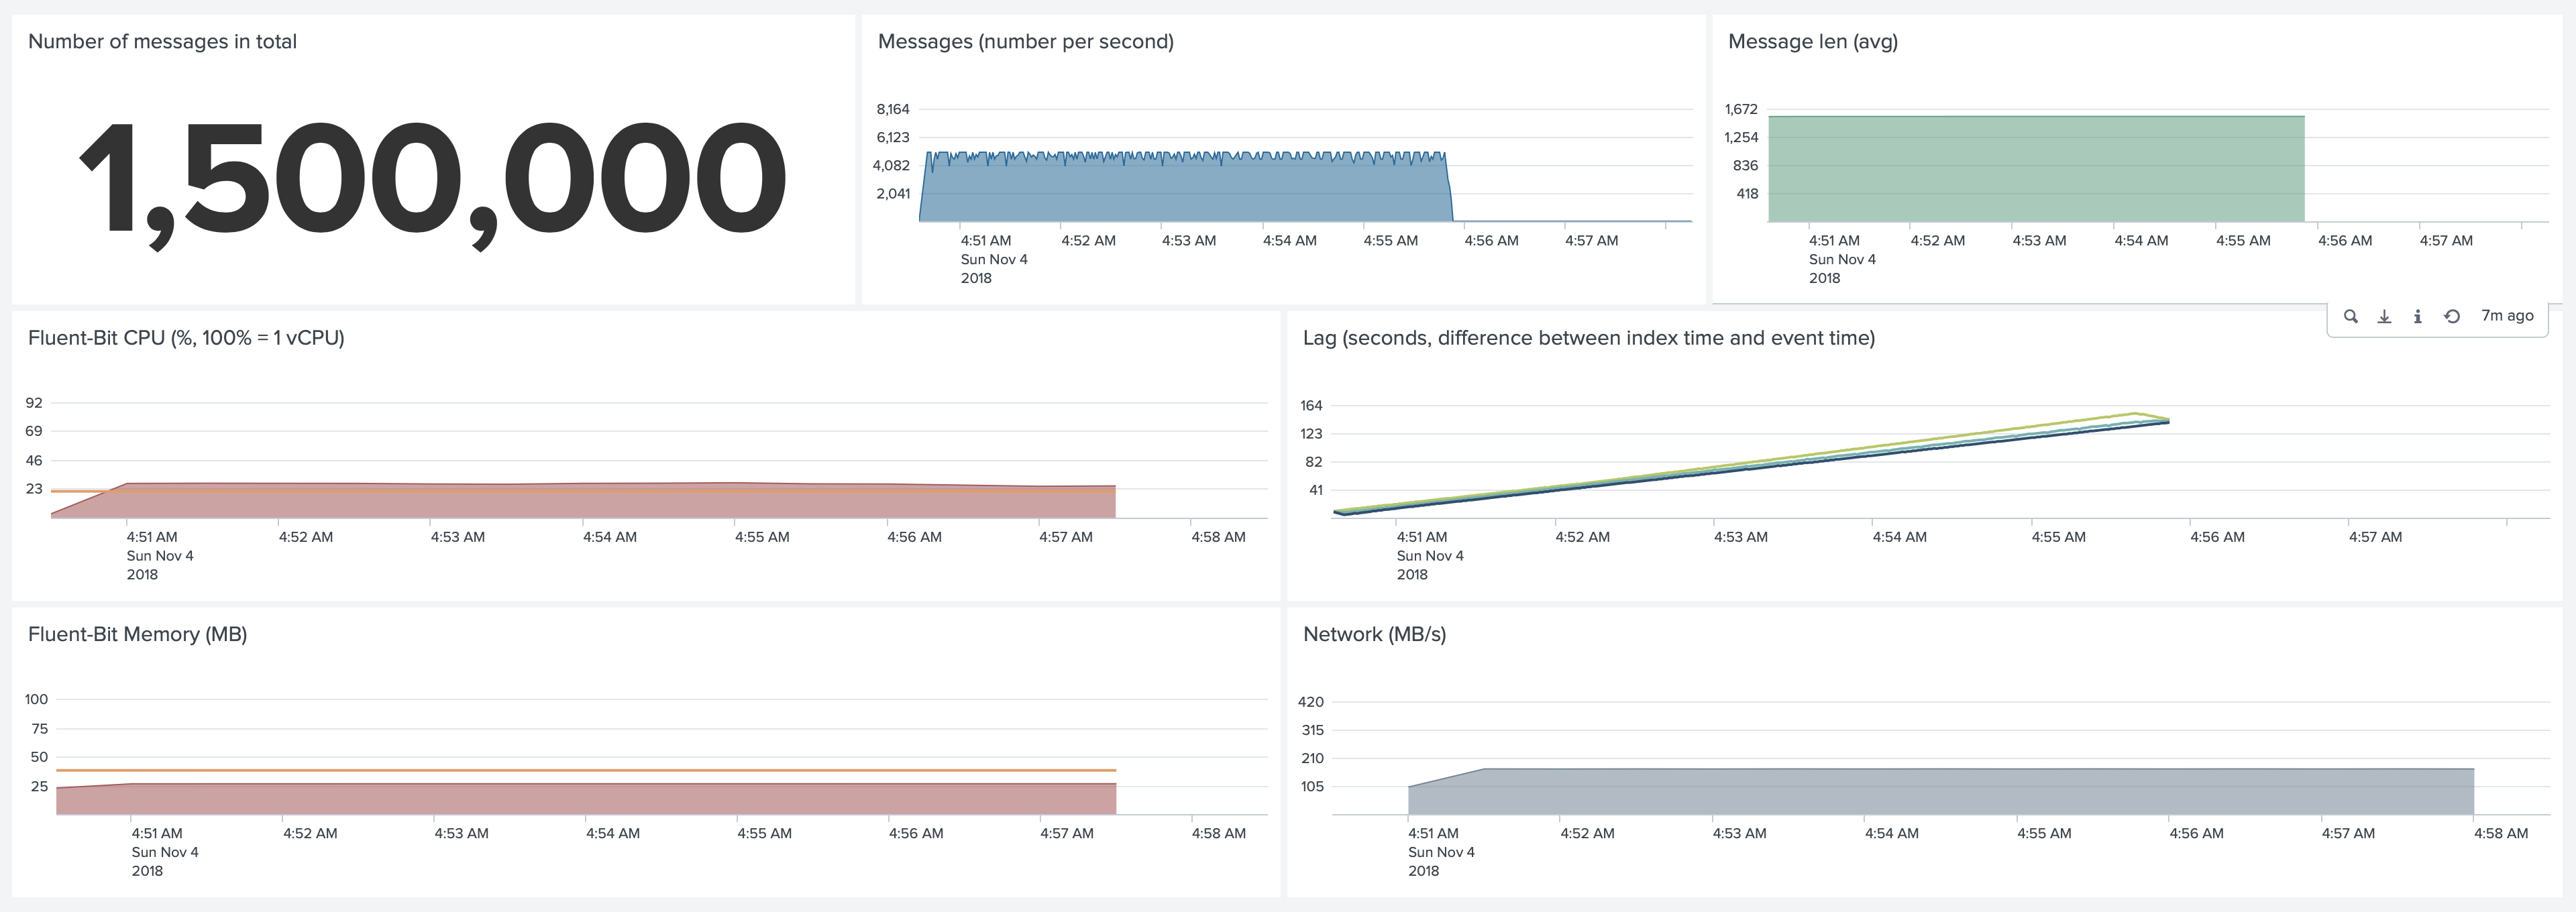
Fluent-bit. Default configuration.
Fluent-bit used 27% CPU and 26MB of Memory. We discovered some issues with keeping up with this volume of logs. As you can see,
the lag (the difference between event time and index time) kept growing to 150 seconds, Fluent-bit needed a few
minutes after Jobs completed to finish forwarding the logs.
In both CPU and Memory graphs, the orange line represents an average CPU and Memory usage of the Collectord for comparison.
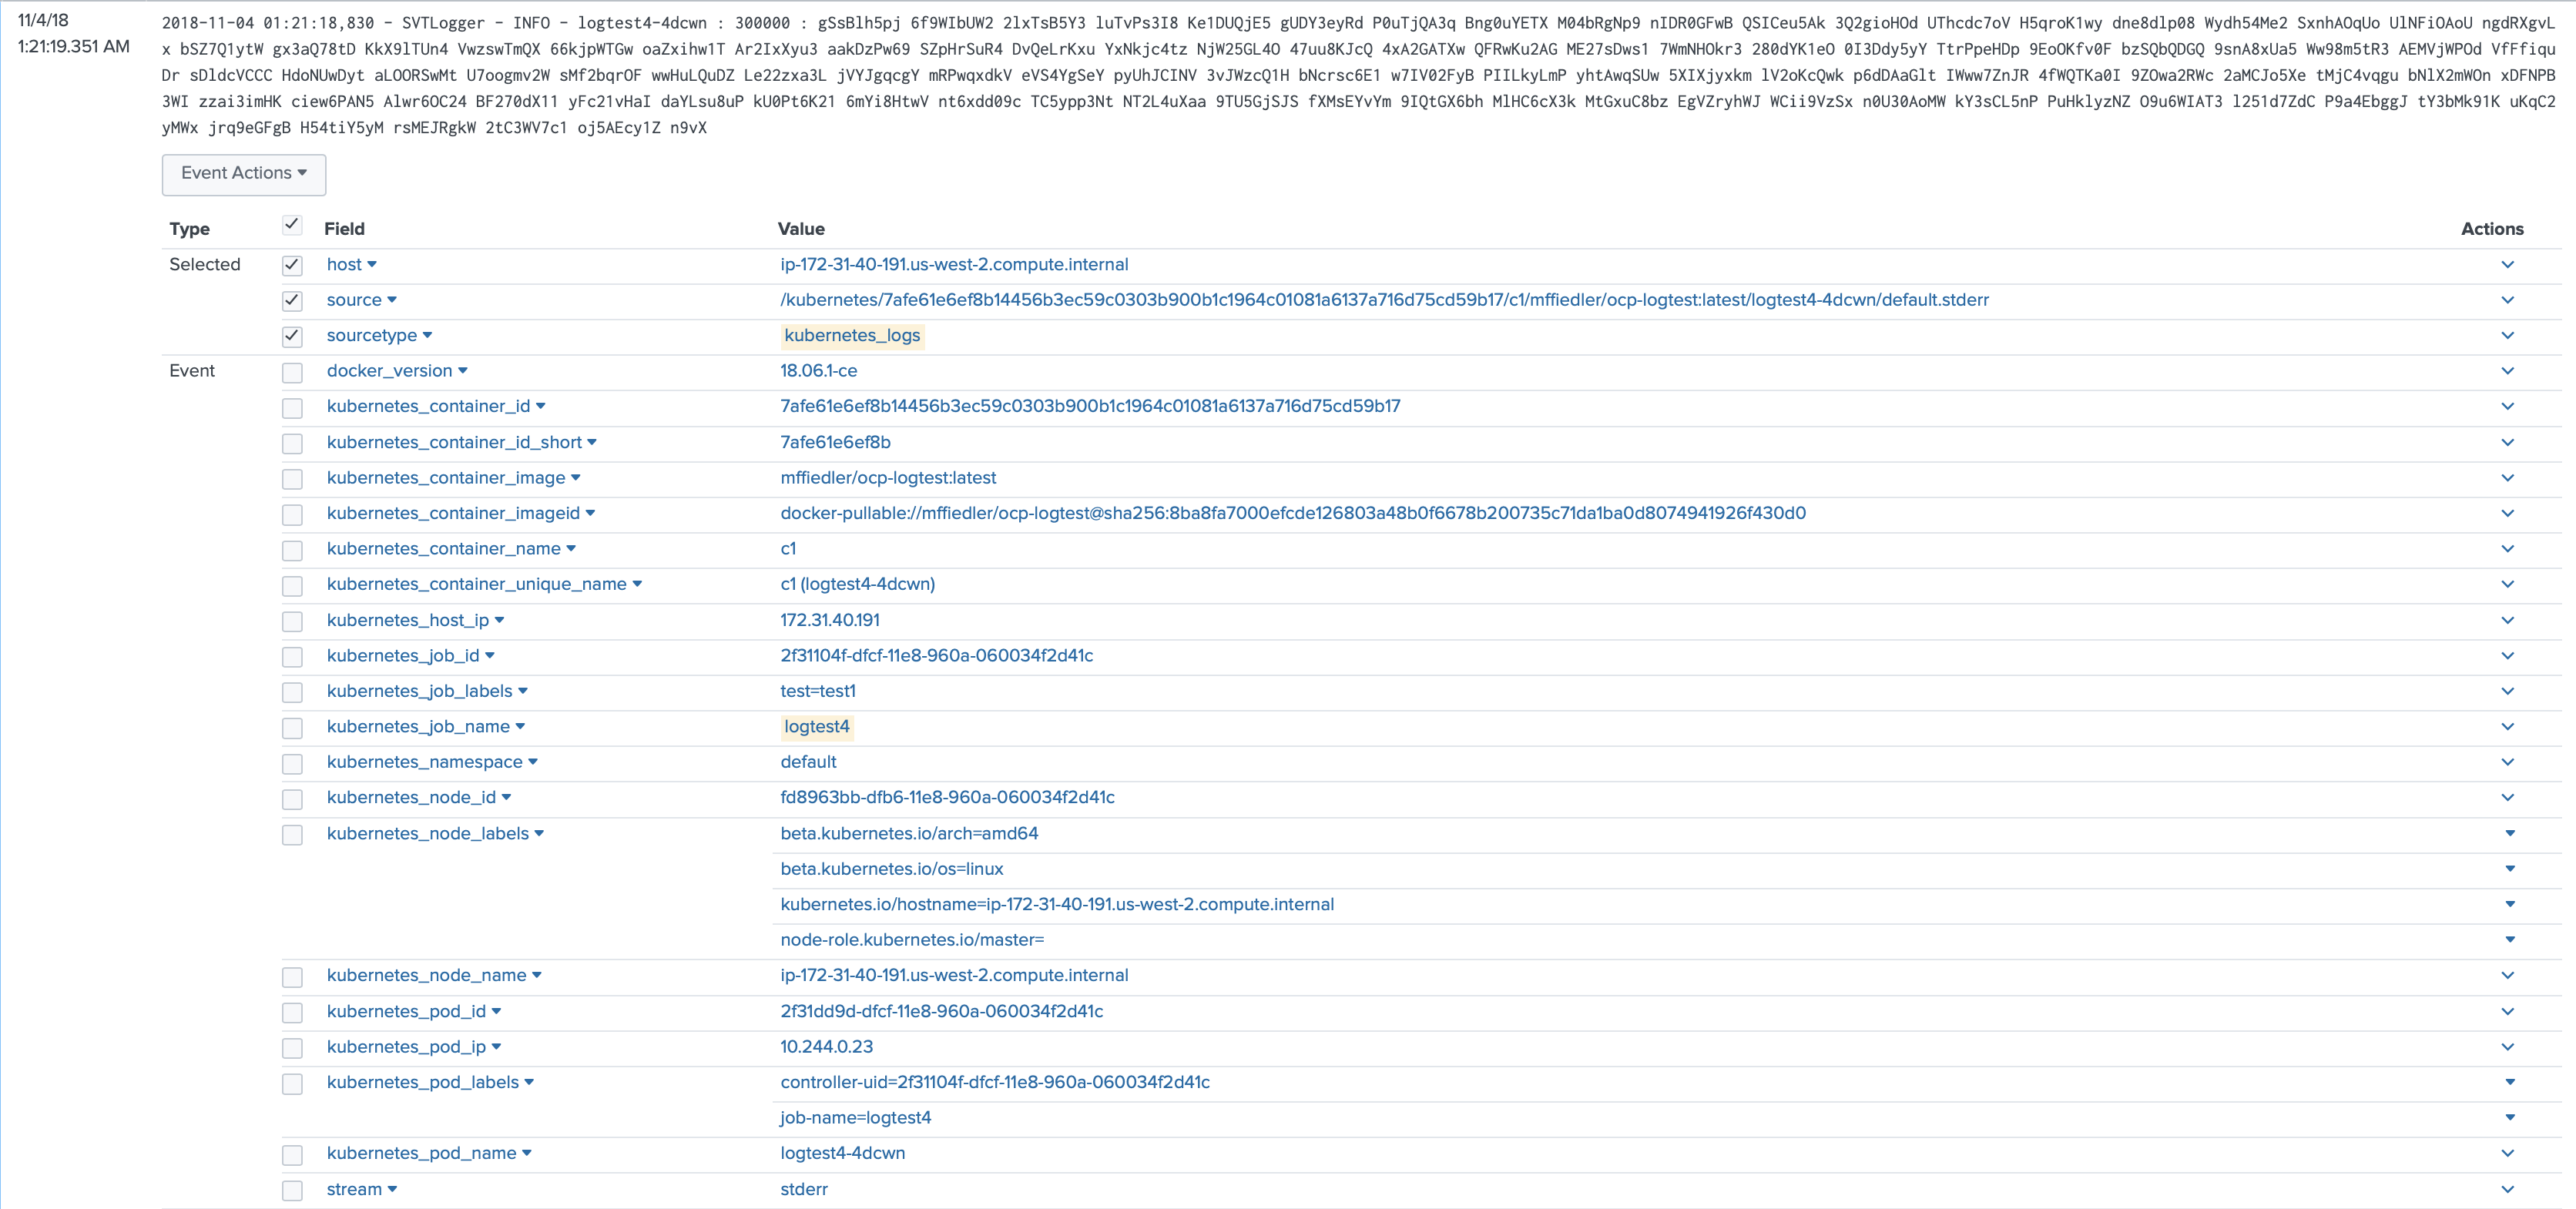
Log format. By default Fluent-bit forwards logs embedded in JSON, which adds to licensing and storage costs. Additional configuration may be required to address that.
Conclusion
We believe that both Fluentd and Fluent-bit are great generic tools, that can work in various environments, but with Collectord you can achieve the performance of Fluent-bit and the flexibility of Fluentd, because Collectord was built specifically for the container environments and optimized for Splunk Http Event Collector. Collectord is a container-native software and always starts forwarding logs almost at the moment of container creation. Collectord has a very high performance for parsing container logs and forwarding data to Splunk HTTP Event Collector.
It is important to keep track of the lag between the indexing time and the time of the event, in Version 5.3 we have added an alert that will help you to monitor that.


