Blog
Monitoring Docker, OpenShift and Kubernetes - Version 5.3
We are happy to share with you a minor update of our solutions for Monitoring Docker, Kubernetes and OpenShift. This update brings improved capabilities for monitoring multiple clusters within one application, better observability for the state of the forwarding data, and also insights into the Splunk Usage.
New annotations
Hashing sensitive data
If you need to hide sensitive data (to hide PII data and be compliant with GDPR) we suggest using the replace patterns
so that you can replace IP addresses with static values like X.X.X.X. But that can complicate observability if you want to
see the trace, or see all the requests from a specific IP address. Now, by using hashing functions, you can get
the same values for the same IP addresses, so that can help you to identify similar values.
With the annotation logs-hashing.1-match you can specify a match regexp.
 1apiVersion: v1
 2kind: Pod
 3metadata:
 4  name: nginx-pod
 5  annotations:
 6    collectord.io/logs-hashing.1-match: '(\d{1,3}\.){3}\d{1,3}'
 7spec:
 8  containers:
 9  - name: nginx
10    image: nginx
The default hashing function is sha256. So the resulting hash value can be larger than the source value.
1EsoXtJryKJQ28wPgFmAwoh5SXSZuIJJnQzgBqP1AcaA - - [18/Nov/2018:01:25:27 +0000] "GET /404 HTTP/1.1" 404 153 "-" "Wget" "-"But you can specify the hash function. For example, when we set collectord.io/logs-hashing.1-function: 'fnv-1a-64' to minimize
the length of the hash result, we get a smaller hash result
1qrr-cQTZFL4 - - [18/Nov/2018:01:27:17 +0000] "GET /404 HTTP/1.1" 404 153 "-" "Wget" "-"- Monitoring OpenShift v5 - Annotations
- Monitoring Kubernetes v5 - Annotations
- Monitoring Docker v5 - Annotations
Annotations for specific container
Pods can have more than one container, but you cannot specify annotations on the container level. With version 5.3 we
allow defining container-specific annotations with the format collectord.io/{container_name}--{annotation}: {annotation-value}.
As an example, if you have nginx containers running with other images, and you want to define various annotations, you
can do that as in this example
 1apiVersion: v1
 2kind: Pod
 3metadata:
 4  name: nginx-pod
 5  annotations:
 6    collectord.io/nginx--logs-hashing.1-match: '(\d{1,3}\.){3}\d{1,3}'
 7    collectord.io/get-trigger--logs-output: devnull
 8spec:
 9  containers:
10  - name: nginx
11    image: nginx
12  - name: get-trigger
13    image: busybox
14    args: [/bin/sh, -c,
15           'while true; do wget -qO- localhost:80; sleep 5; done']
In that example, the annotation logs-hashing.1-match is applied only to the nginx container, and logs-output to the get-trigger
container.
Other annotations
collectord.io/logs-joinmultiline- disable multi-line joining for the Podcollectord.io/logs-disabled- completely disable log processing. The difference fromlogs-output=devnullis that in case ofdevnulloutput Collectord still reads the logs, so if you change the output later, Collectord will start processing logs right from the moment when you changed the output. In the case of changingdisabled=truetofalse, Collectord will start forwarding logs from this container as this is a new container, starting from the beginning of the log files.
Improved observability
We have added several alerts that can help you to troubleshoot issues with Collectord. Alerts to show when Collectord reports errors in the processing pipeline, for example when it fails to extract the fields. Alert for showing when Collectord reports Warning messages that can identify issues with the access to API Server, or that not all the requests to Splunk HEC can be delivered from the first time. The third alert is about the lag between the time of event and indexing time, this alert can identify issues with the performance of Collectord or the Splunk Indexing pipeline.
Reducing Splunk Licensing cost for Network Socket Data and Events
We improved identification for the events that we already sent to Splunk. That allows reducing the amount of events Collectord forwards to Splunk. With a very high number of events, that can be a significant change.
In version 5.3 Collectord groups network socket connections with the similar remote and local IP. For example, if a local
container has two connections
1remote_addr | remote_port | local_addr | local_port  | protocol | tcp_state | time
210.128.0.3  |        9090 | 10.128.0.1 |       55338 | tcp      | TIME_WAIT | 2018-11-17 16:53:03.668
310.128.0.3  |        9090 | 10.128.0.1 |       55432 | tcp      | TIME_WAIT | 2018-11-17 16:53:03.668
With version 5.3 Collectord groups them and adds an additional field connections
1remote_addr | remote_port | local_addr | local_port  | protocol | tcp_state | time                    | connections
210.128.0.3  |        9090 | 10.128.0.1 | 55338-55432 | tcp      | TIME_WAIT | 2018-11-17 16:53:03.668 | 2
We have found that this grouping can reduce licensing cost of network socket table data by a factor of 4.
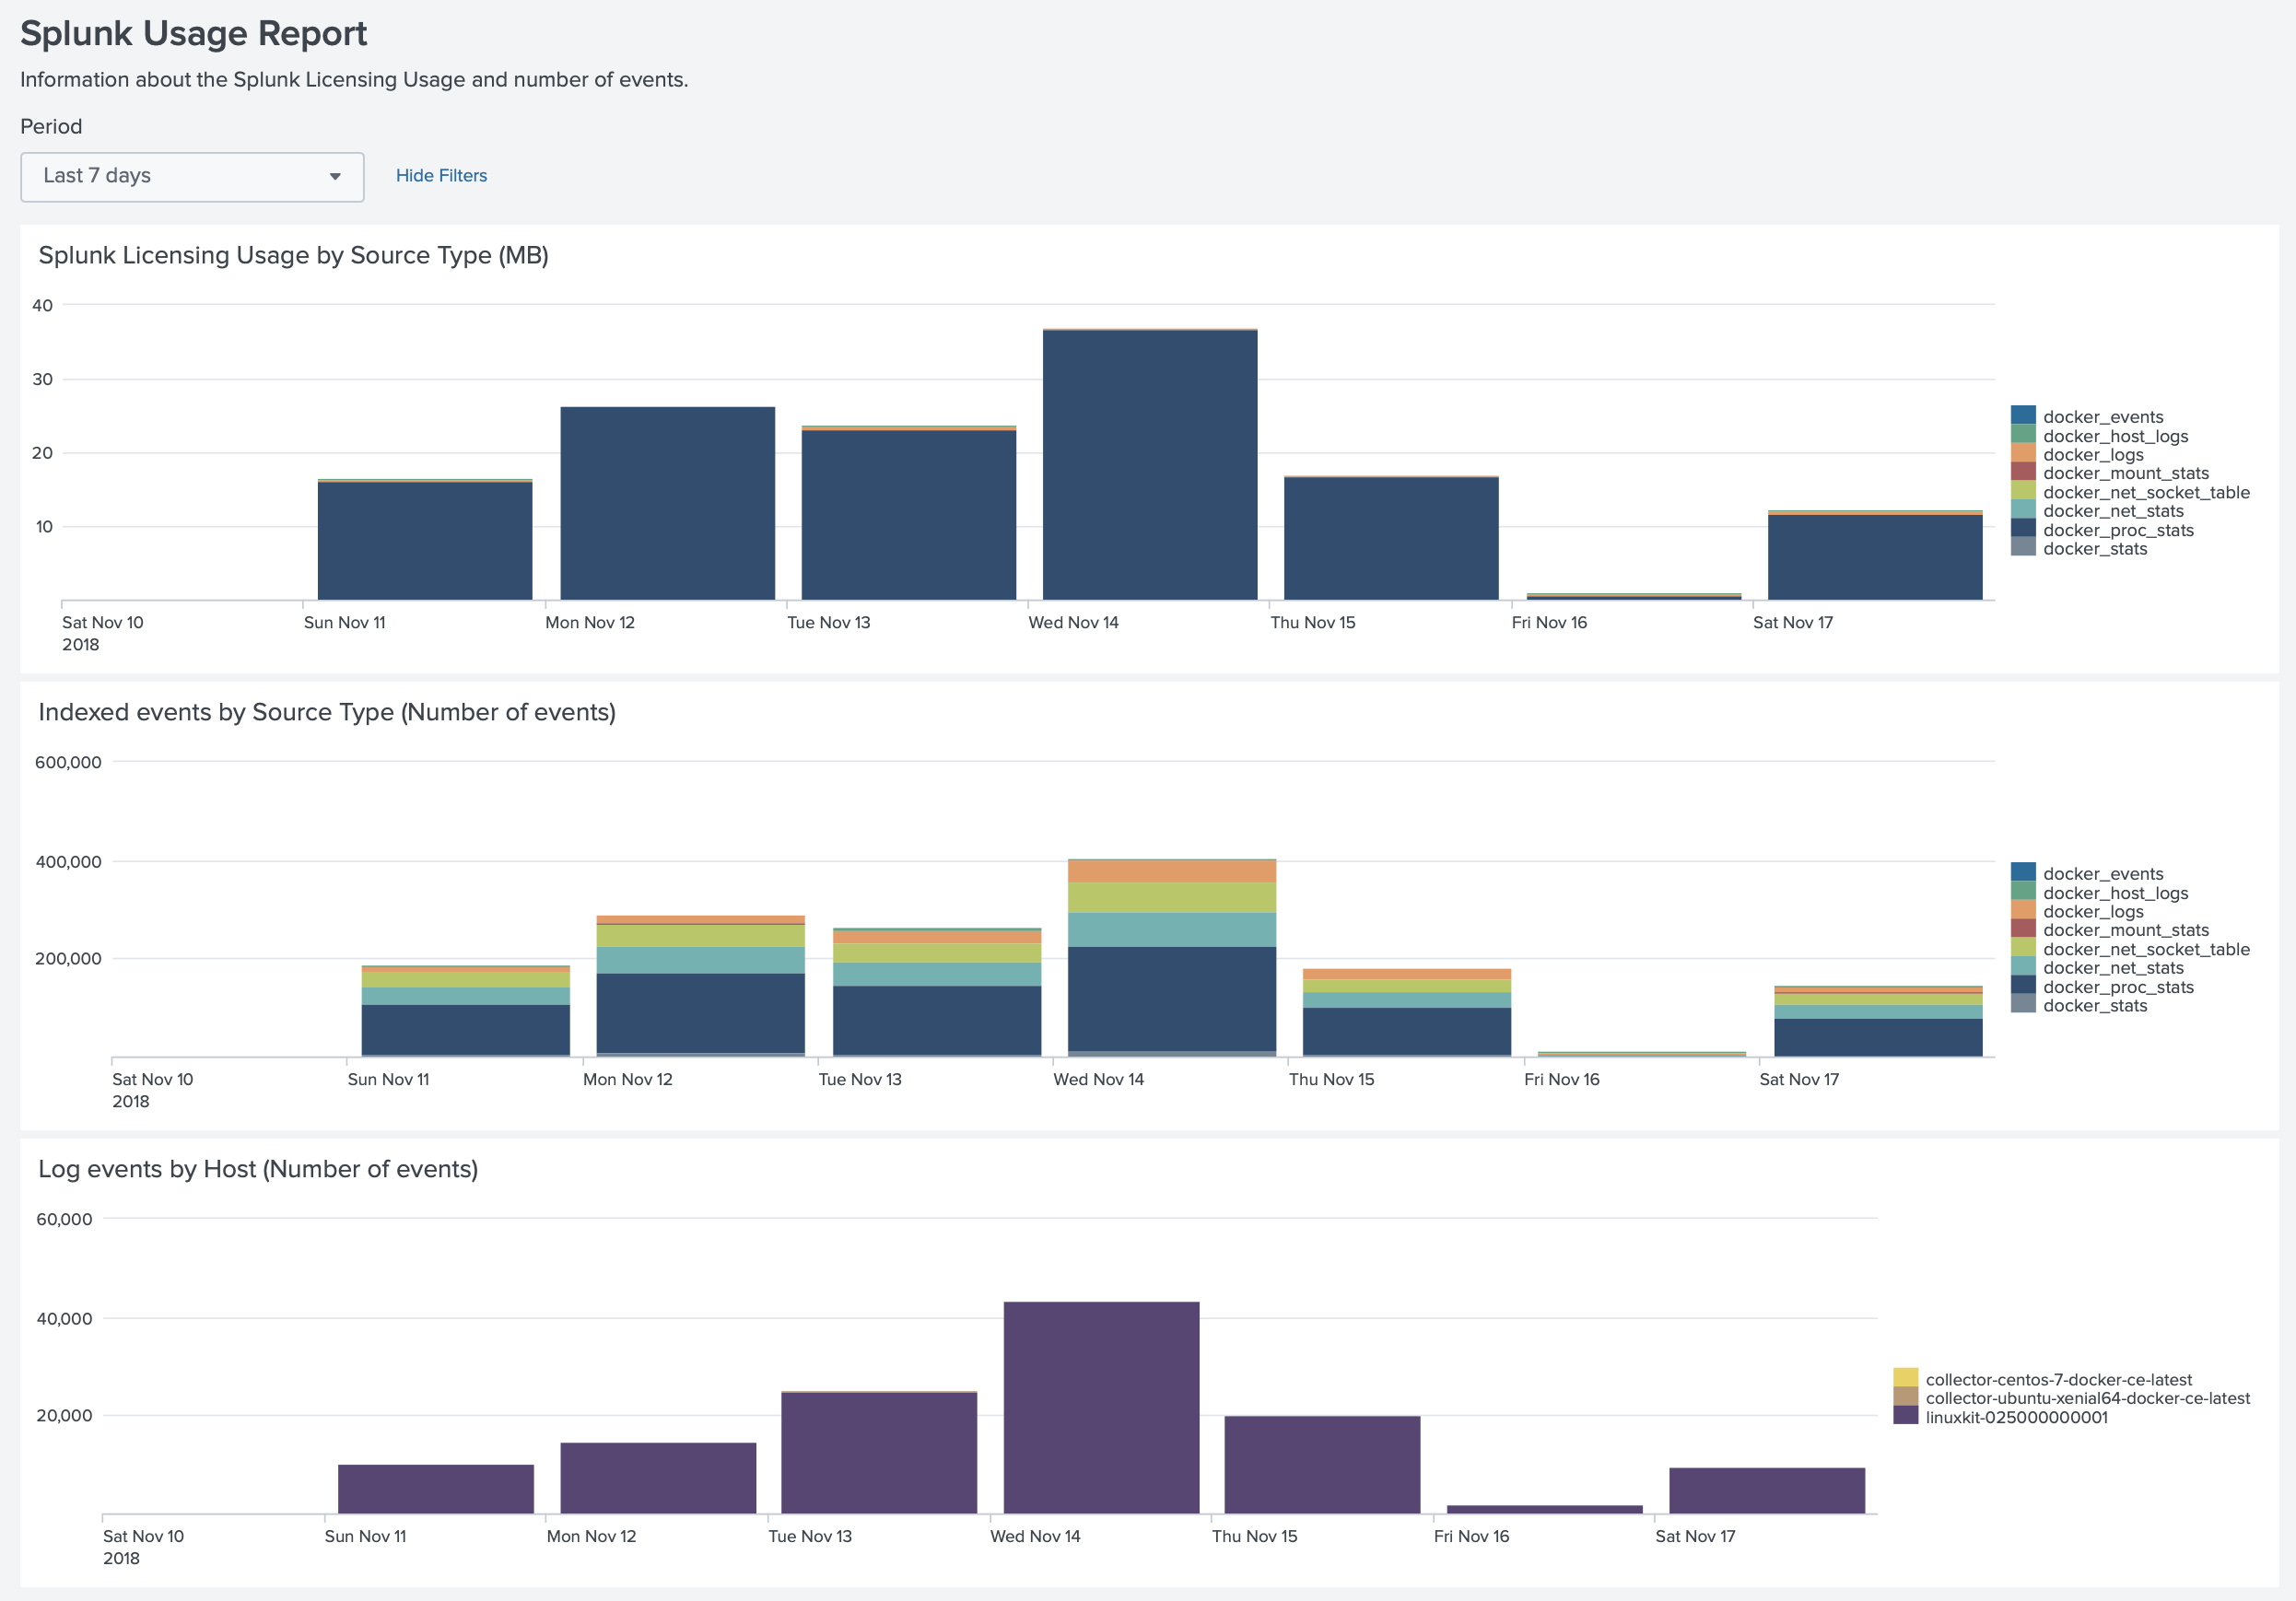
You can also see how much licensing cost is taken by the application with the Splunk Usage dashboard.
Performance improvements
With version 5.3 we significantly improved memory usage and log processing performance. You can see the result in a separate blog post Performance comparison between Collectord, Fluentd and Fluent-bit.
Links
You can find more information about other minor updates by following the links below.
Upgrade instructions
Release notes
- Monitoring OpenShift - Release notes
- Monitoring Kubernetes - Release notes
- Monitoring Docker - Release notes


