Blog
Monitoring Docker, OpenShift and Kubernetes - v5.2 - bug postmortem (lookup with alerts causing replication activities on SHC)
We have released a patch 5.2.180 for version 5.2 of our applications for Splunk. This patch fixes an important issue in Search Head Cluster deployments: lookup with alerts causing very often replication activities on SHC. If you are currently using version 5.2 with Splunk Search Head Clustering deployments, please upgrade ASAP.
Actions for Upgrade
- If you are using version
5.2upgrade to5.2.180. - Verify that you don’t have any triggers left in the local folder, if you have already overwritten some of our alerts
cat $SPLUNK_ETC/apps/monitoring*/default/savedsearches.conf | grep 'action.lookup'. If you do, remove all of the lines, starting withaction.lookup. - Remove lookups for alerts
ls $SPLUNK_ETC/apps/monitoring*/lookups/*_alerts.csvfrom our applicationsmonitoringopenshift,monitoringdocker,monitoringkubernetes. We have several static lookups as well in thelookupsfolder.
Postmortem
Since version 2.0 we have had alerts in our applications. But all of these alerts were only about license overuse and
expiration, or for letting you know that you are using not the correct version of Collectord. With version 5.2
we brought many alerts to help you monitor the health of the system. We tested every alert separately to
verify that these alerts work, and that we have a dashboard in the application that can help you diagnose this alert further.
Triggered alerts aren’t visible in Splunk if you don’t know where to look. You need to specify custom triggers for them or check triggered alerts manually in the Activity → Triggered Alerts.
We wanted to be able to tell customers right out of the box if something is wrong with their deployments or clusters. Among all the available triggers that Splunk has by default, we felt that writing to a CSV file was the best option. This option did not require any additional configuration, and we believed it should not affect the system anyhow. And we used this file to show the triggered alerts on the first page of our applications.
We knew that for every new append in the CSV file, this would trigger a replication on the SHC. We did the math; 30 alerts, running in ranges from 5 minutes to 24 hours, in the worst-case scenario could trigger 30 SHC replications in 5 minutes. Even if the file grows to a few megabytes, that should be easy to replicate.
After we heard that one of our customers had an issue with this lookup, we started an investigation and set up a lab with the Search Head Cluster, where we tried to reproduce the worst scenario. We changed every alert so that it always triggers.
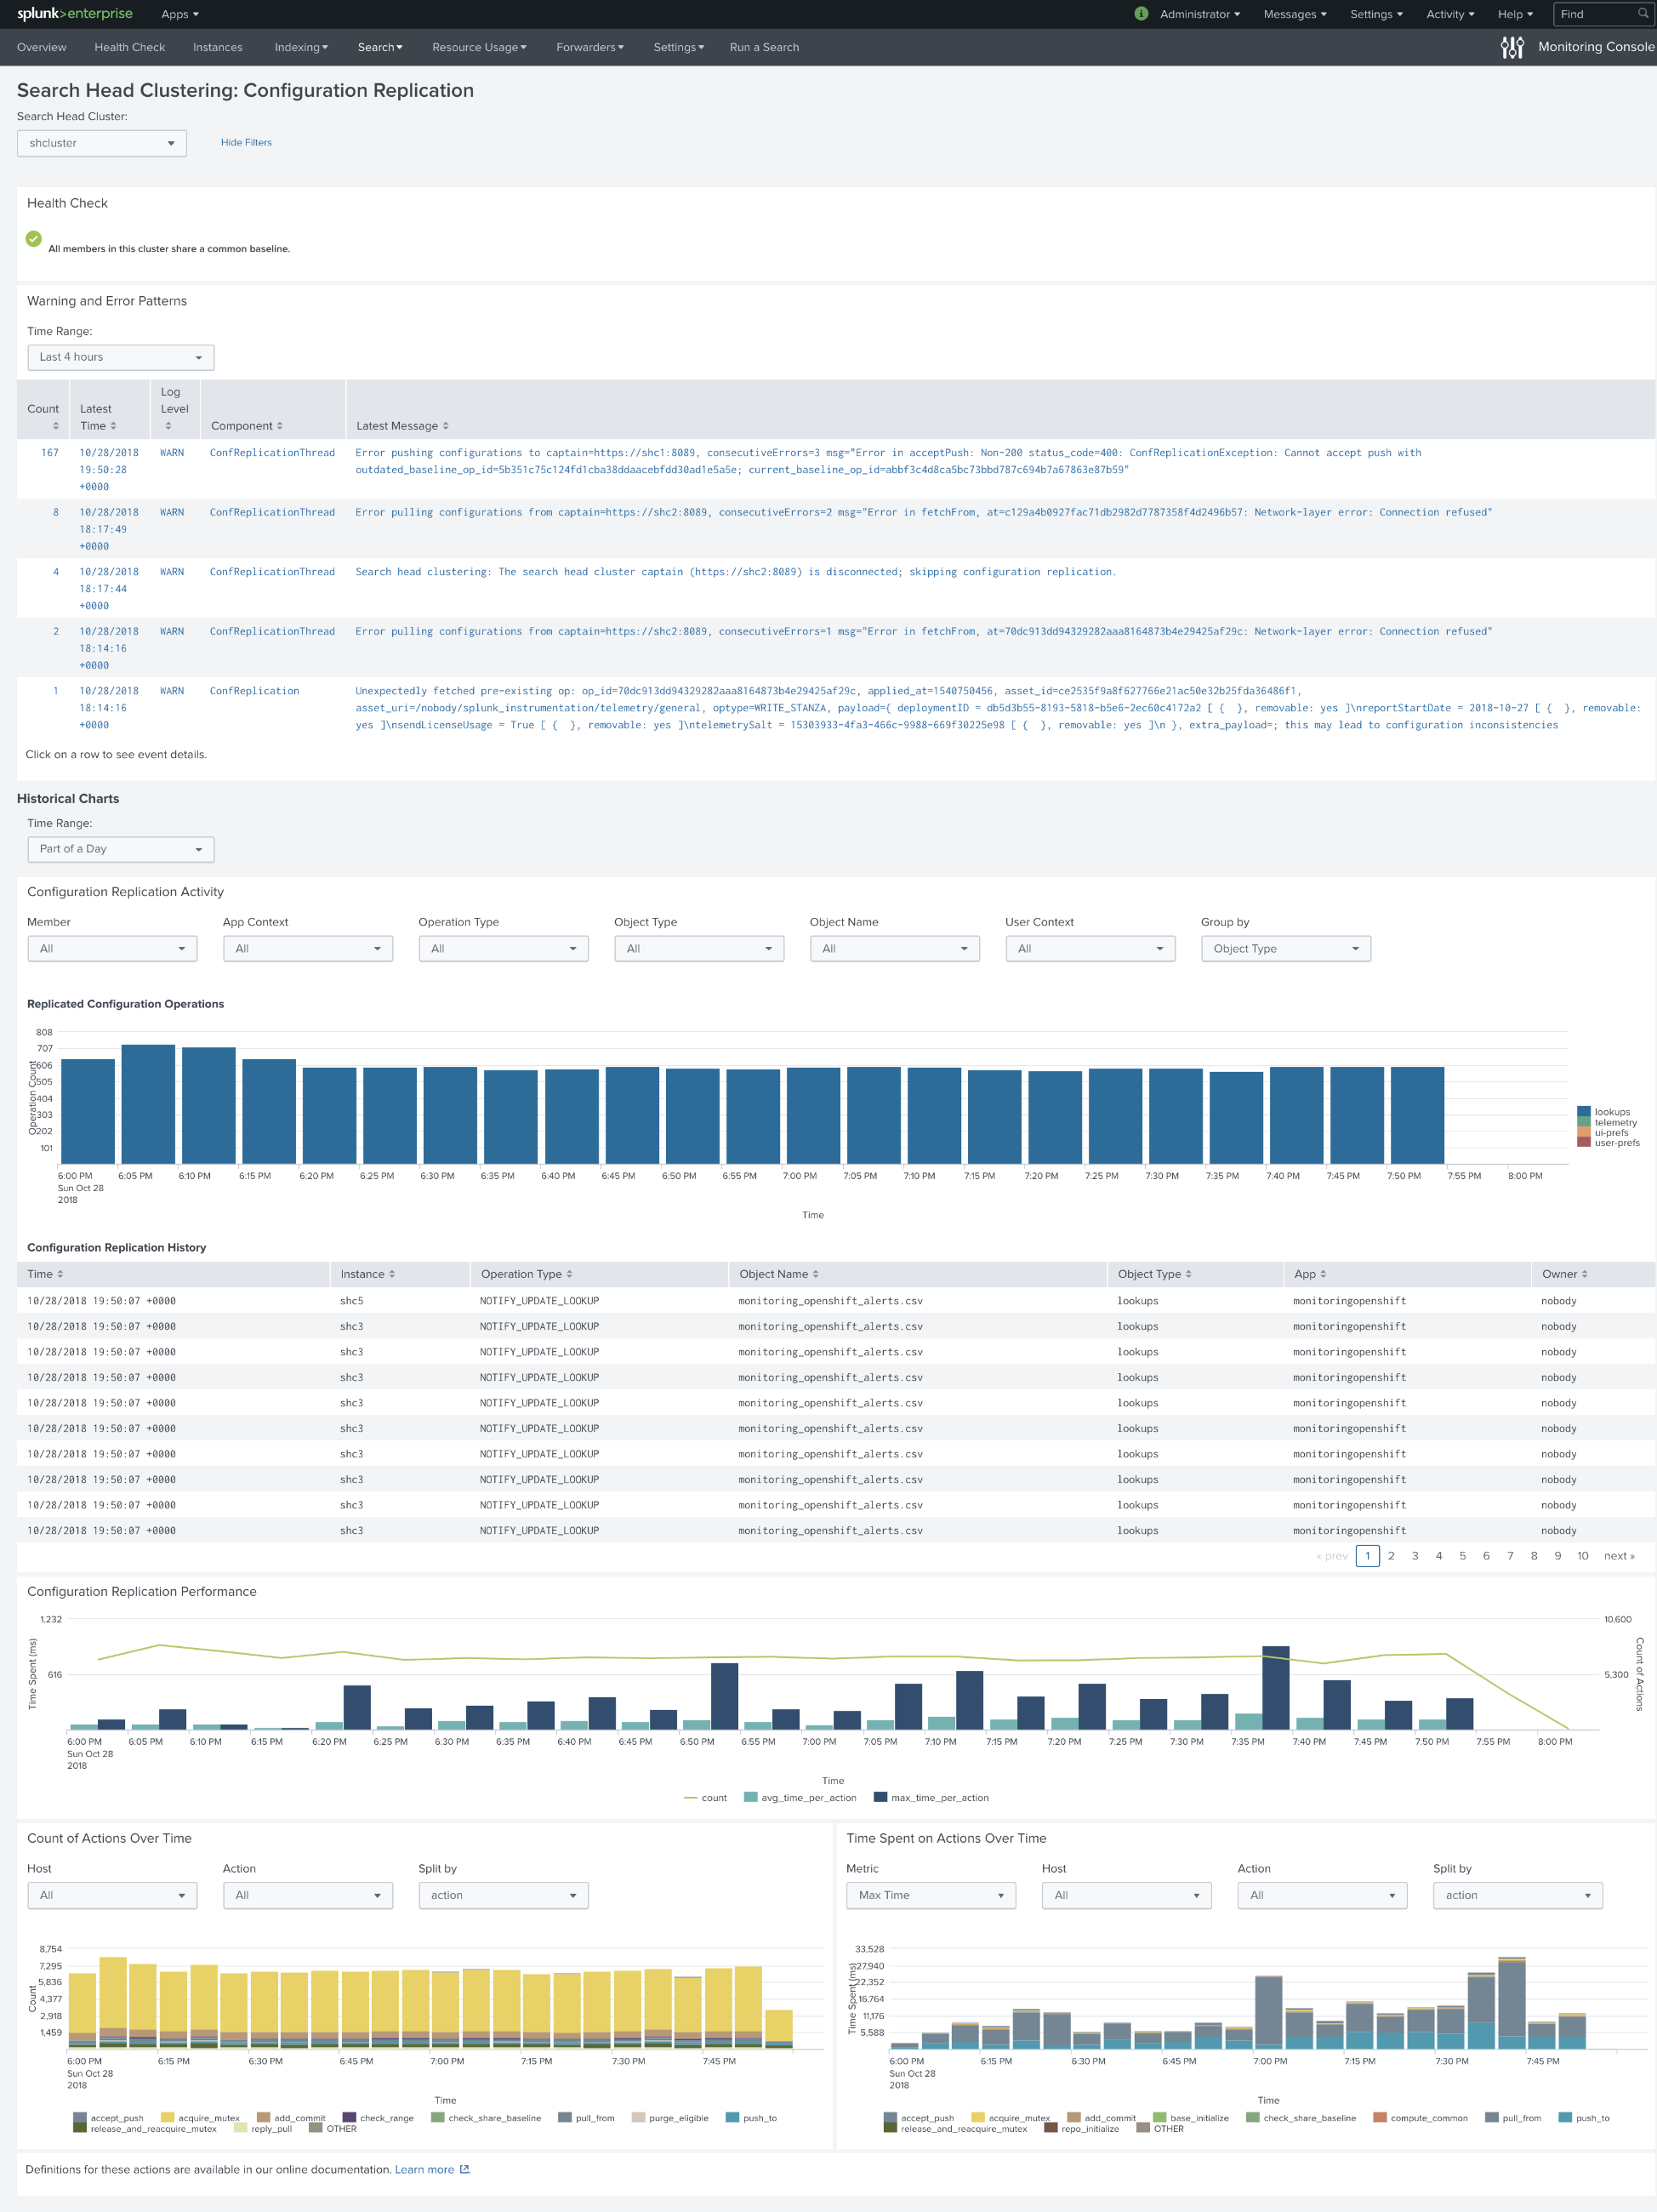
In just 3 hours we observed that:
- Lookup file grew to over 1Mb.
- Time spent on actions went from 5 seconds to 30 seconds.
- This behavior caused over 600 replicated configuration operations every 5 minutes. Considering that we only had 30 savedsearches writing to this lookup file, it felt too high.
- Lookup file got corrupted a few times (you could see a text in several
_timecells).
A corrupted lookup file causes searches to fail. We go back to the same problem: the application wants to show you alerts, and you will not be able to see them.

It was clear that this was not an option for us anymore. We could not use CSV for storing fired alerts. Sadly, KVStore lookups are not available as a trigger action for alerts. KVStore would not cause any issues with the SHC replication.
Action 1. Remove alert lookups
The first action was simple. We removed all lookup actions from our alerts (savedsearches.conf)
1action.lookup = 1
2action.lookup.append = 1
3action.lookup.filename = monitoring_docker_alerts.csv
And modified our searches. We do not need to normalize all the results to the same set of fields anymore. Instead, we can show more information with every saved search, as in the example below
Action 2. Use rest API to show alerts on the first page
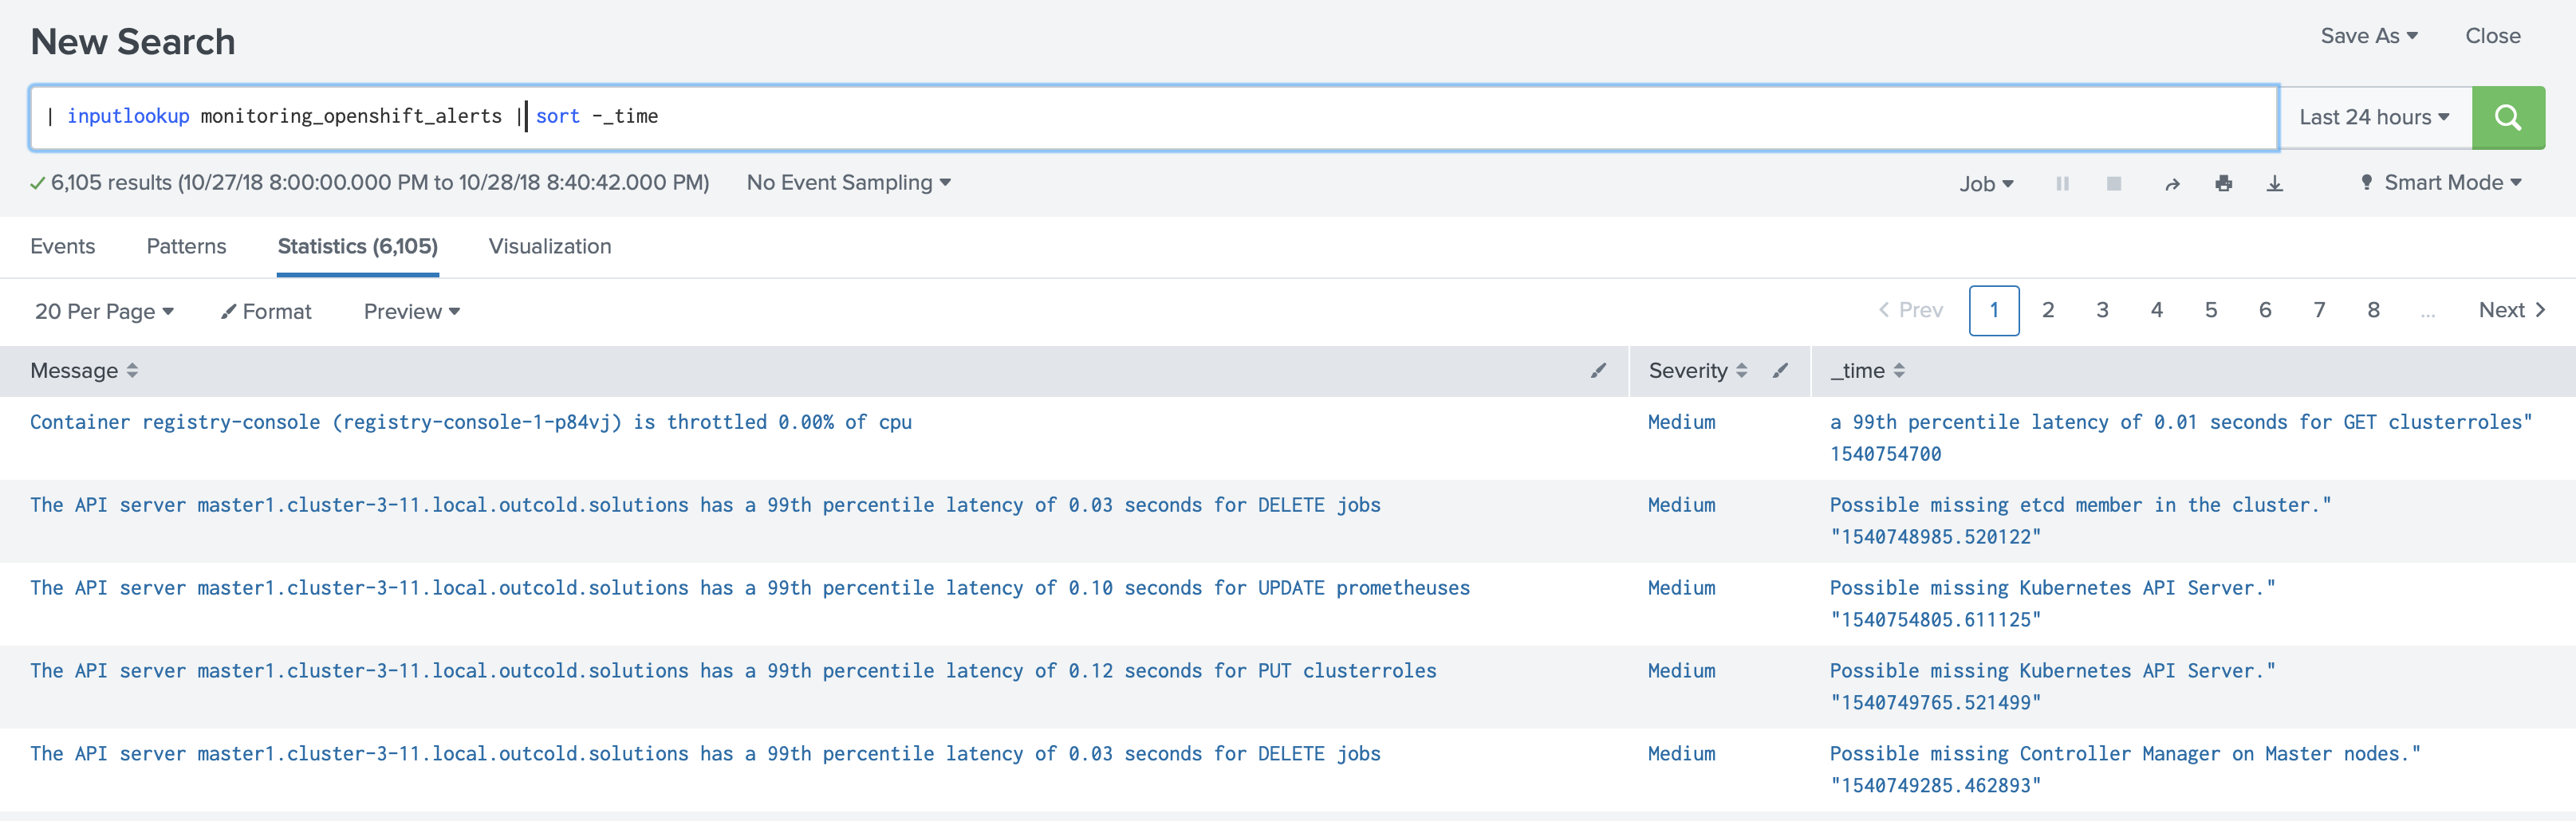
Instead of relying on the CSV lookups, we started to use REST API directly to get the list of fired alerts.
1| rest splunk_server=local count=1024 /servicesNS/-/monitoringopenshift/alerts/fired_alerts/-Alternatively you can find fired alerts from the _audit index
1index=_audit action="alert_fired" ss_app=monitoringdocker |But for that you need to give your users access to the internal indexes. And most of the non-admins do not have access to these indexes.
After the patch
After we changed the implementation of saved searches, we reran a test. We replaced every alert so it always triggers; after running this test for 12 hours, we got almost a thousand fired events. These events do not affect SHC in any way, no unnecessary replications, and time for actions stays the same.
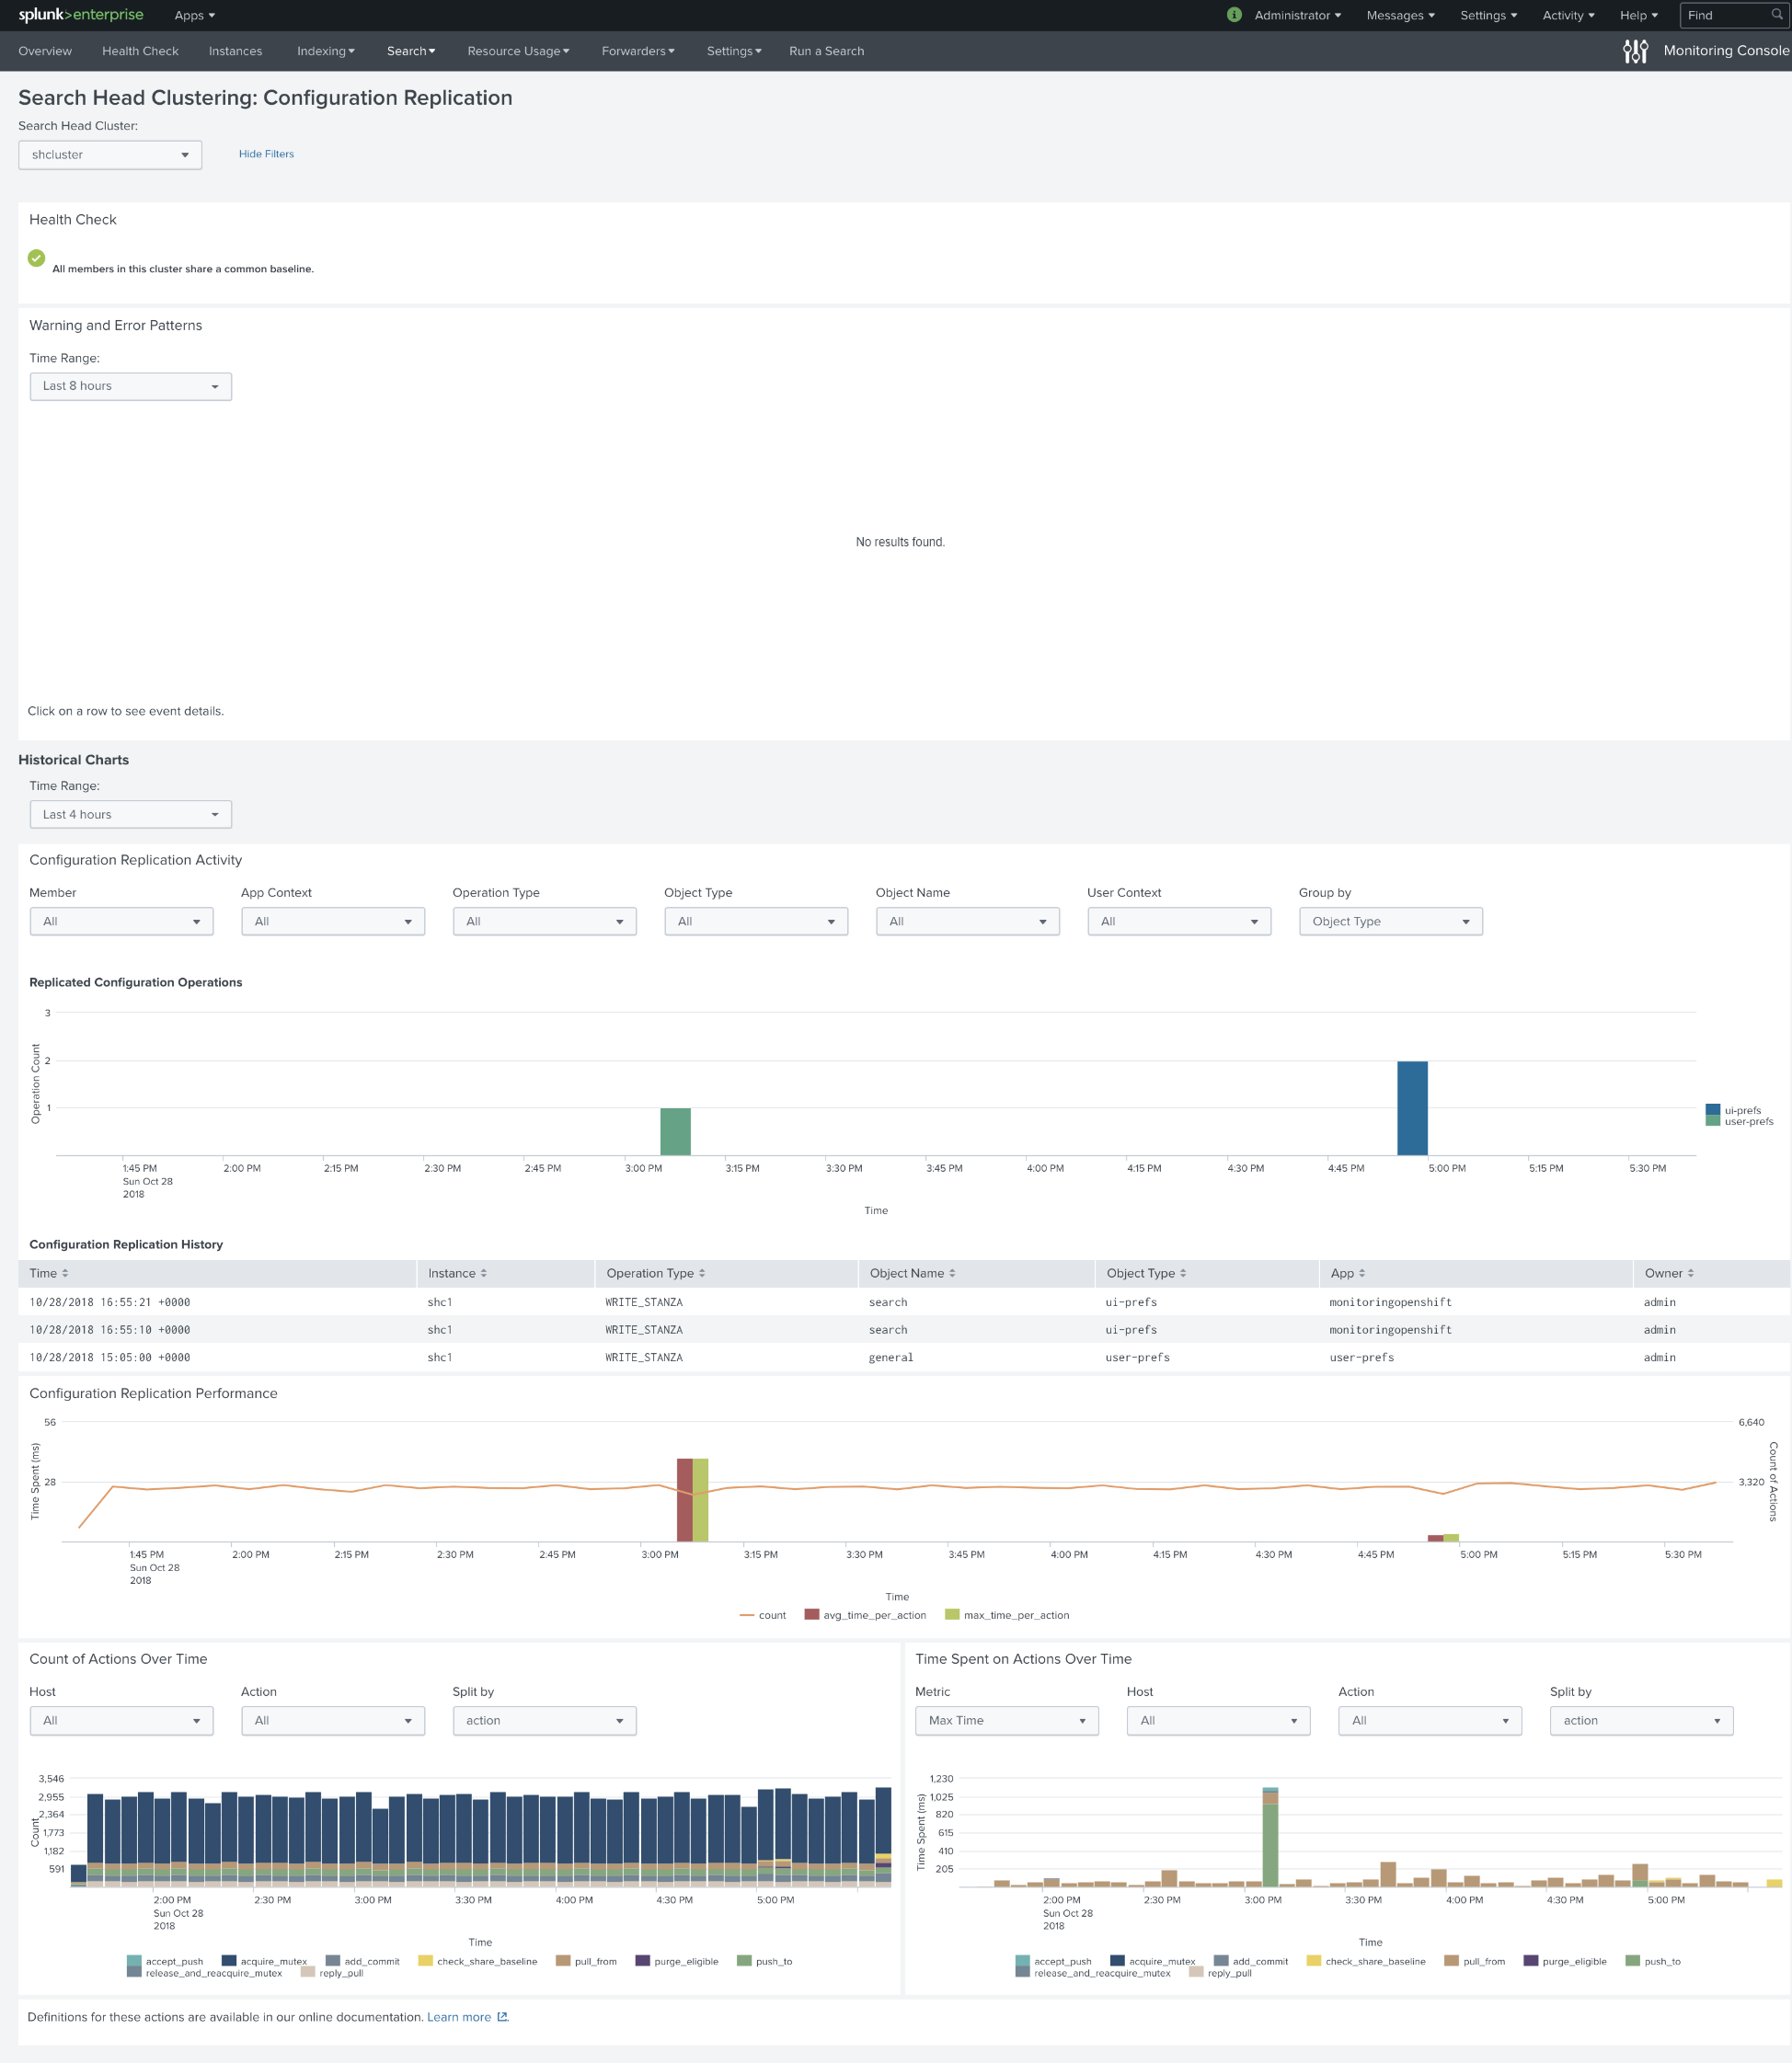
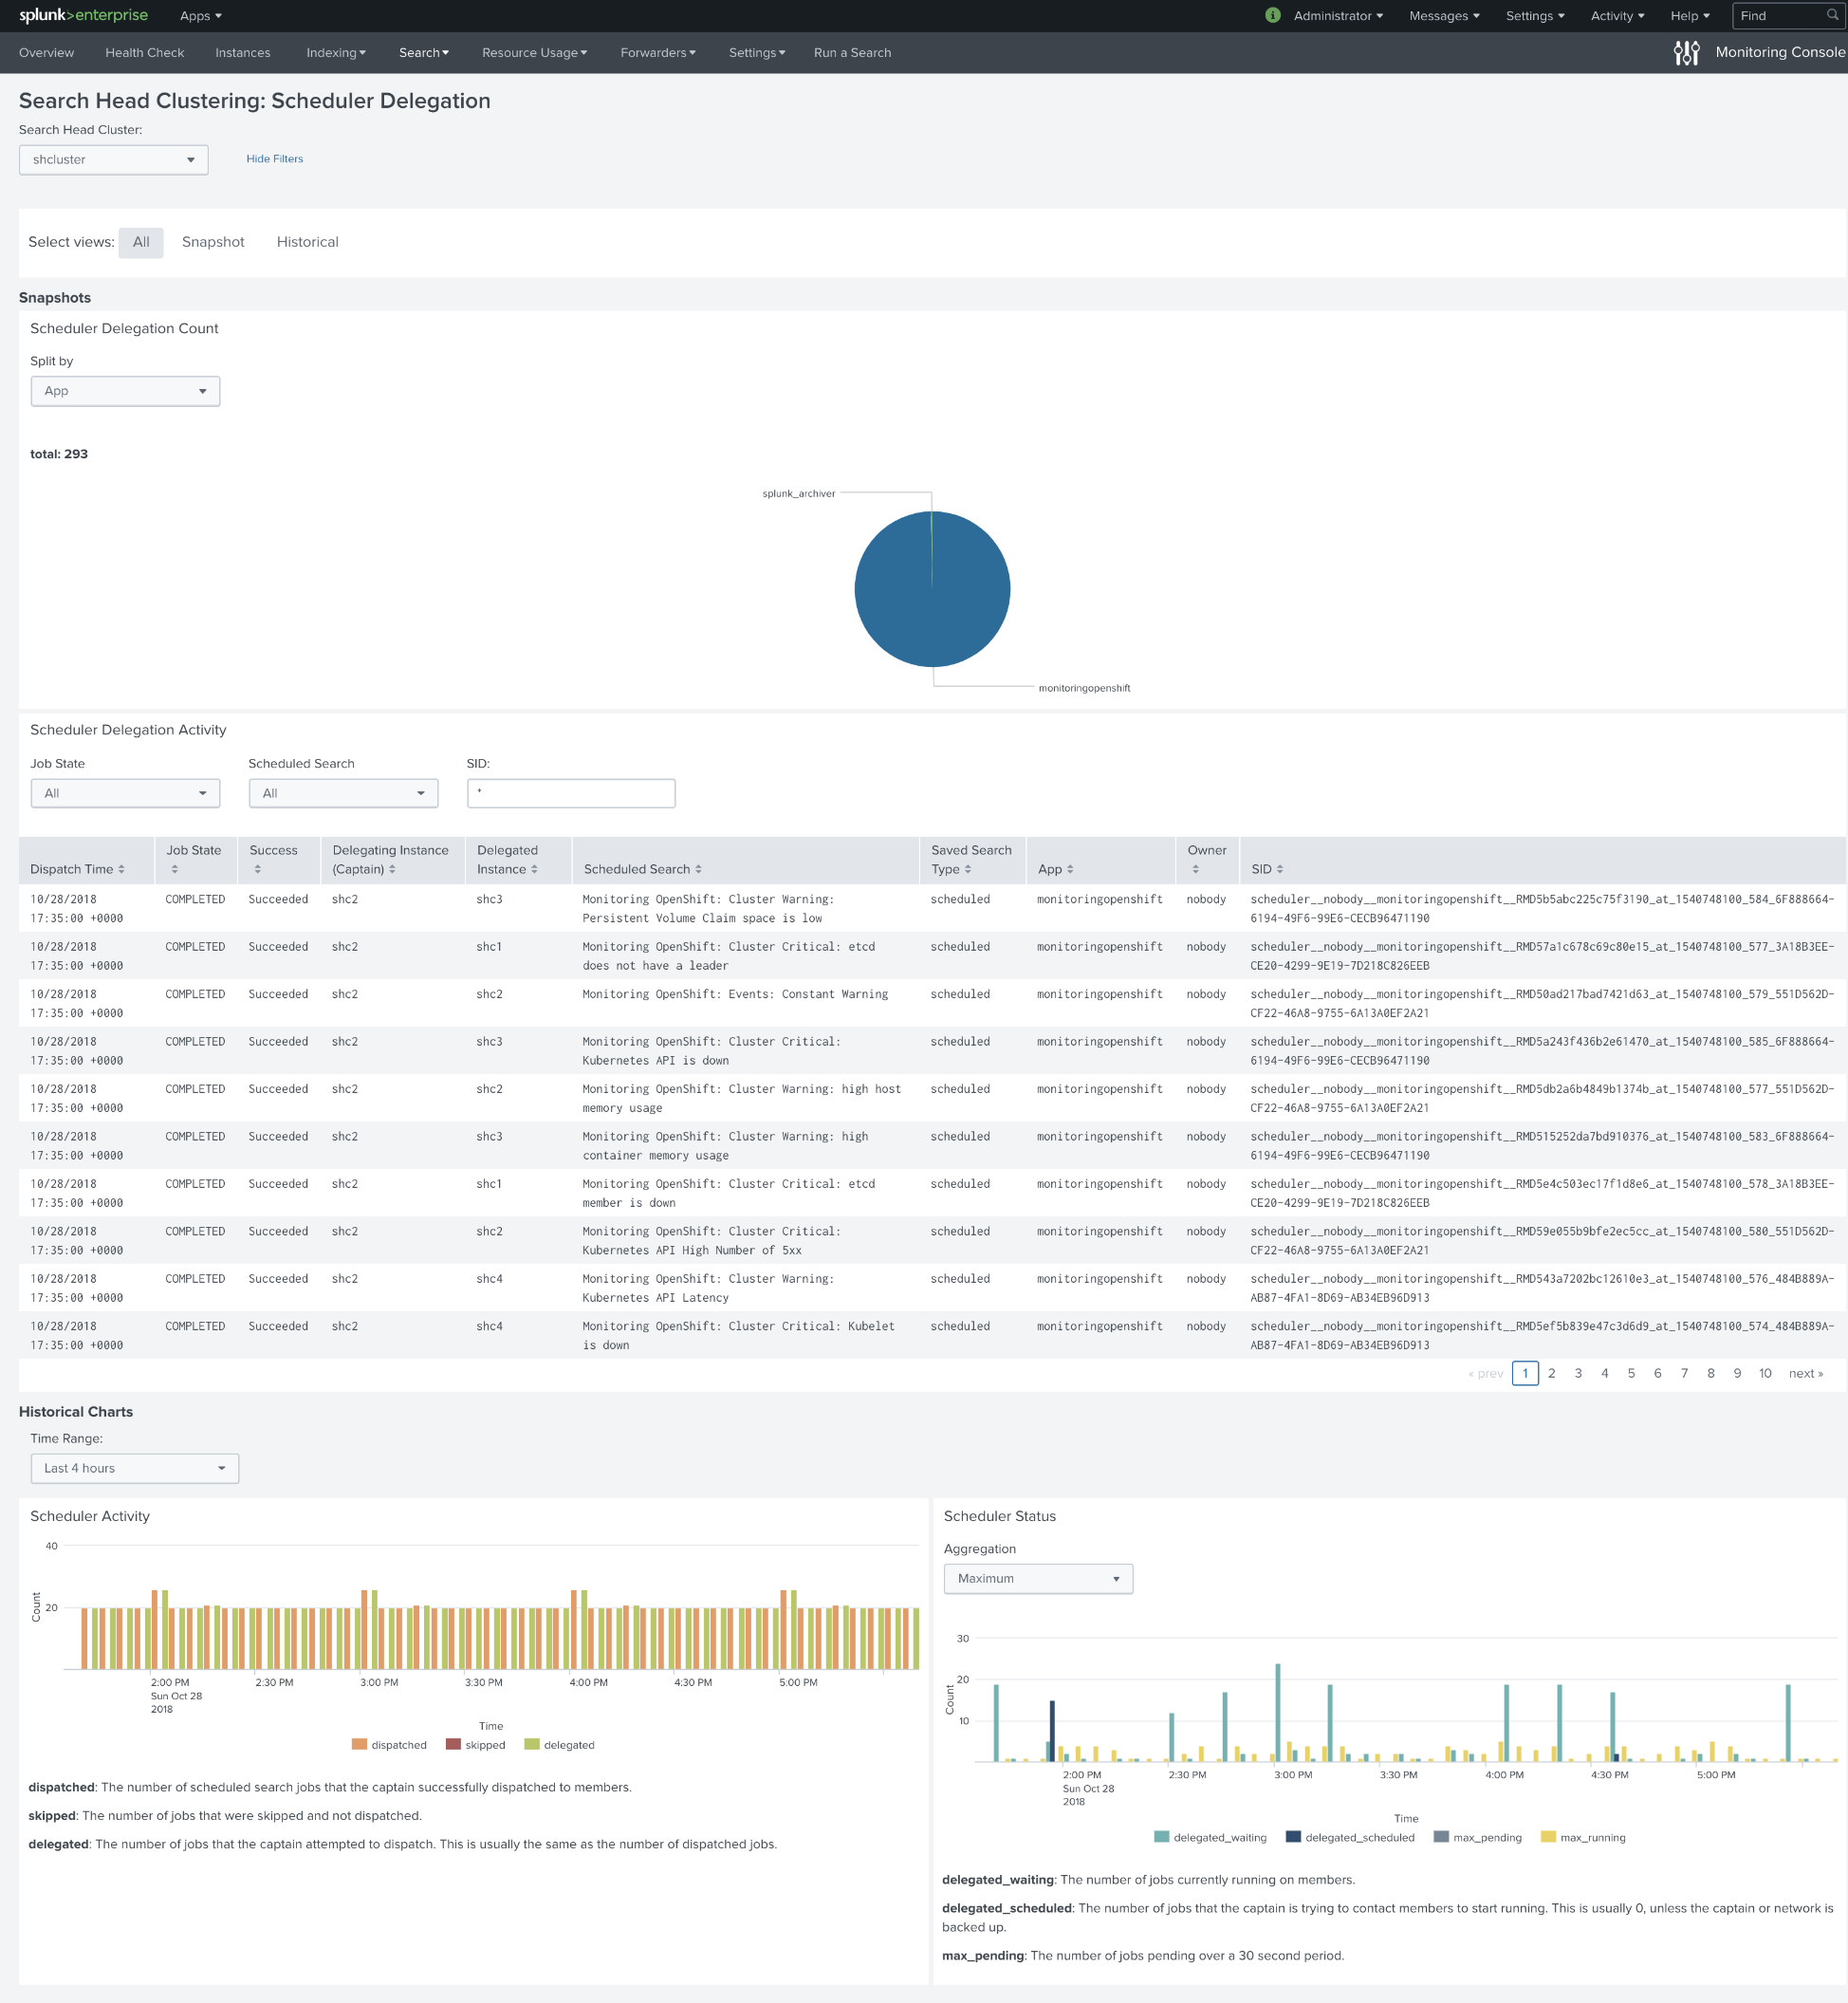
Below is the dashboard of searches scheduled on Search Head Cluster. About 120 searches per hour on average.
Conclusion
If you are using Search Head Cluster with version 5.2 of our applications, please make sure that you have upgraded
to the latest patched version 5.2.180. Note that using dynamic CSV lookups for SHC environments is not a great option,
even if these lookups are small.


