Blog
Forwarding 10,000 1k events per second generated by containers from a single host with ease
It is good to know the limits of your infrastructure. We are continually testing Collectord in our labs. Today we want to share with you the results of the tests that we have performed on AWS EC2 instances. So you can use it as a reference for planning the capacity and the cost of your deployments. We will provide you with information on how we ran the tests and how we measured the performance.
[UPDATE (2018-11-04)] Up to 35% CPU performance improvements, 3 times less memory usage in upcoming version 5.3.
Tests performed on 2018-10-20
Environment
AWS
We used two EC2 instances. In the same VPC, in the same AZ, default Tenancy, with AMI ami-0d1000aff9a9bad89 (Amazon Linux 2).
- c5d.xlarge (4 vCPU, 8GiB, 100 NVMe SSD) for Splunk
- m5.large (2 vCPU, 8GiB, 20GB gp2 EBS) for testing environment (for most tests)
- c5d.xlarge (4 vCPU, 8GiB, 100 NVMe SSD) for 10,000 1k events per second test (we note below)
Splunk
We deployed Splunk inside of the container. We used version 7.2.0. One index for all events.
Docker
 1docker version
 2Client:
 3 Version:           18.06.1-ce
 4 API version:       1.38
 5 Go version:        go1.10.3
 6 Git commit:        e68fc7a215d7133c34aa18e3b72b4a21fd0c6136
 7 Built:             Wed Sep 26 23:00:19 2018
 8 OS/Arch:           linux/amd64
 9 Experimental:      false
10
11Server:
12 Engine:
13  Version:          18.06.1-ce
14  API version:      1.38 (minimum version 1.12)
15  Go version:       go1.10.3
16  Git commit:       e68fc7a/18.06.1-ce
17  Built:            Wed Sep 26 23:01:44 2018
18  OS/Arch:          linux/amd64
19  Experimental:     false
JSON logging driver configuration
1{
2  "log-driver": "json-file",
3  "log-opts" : {
4    "max-size" : "100m",
5    "max-file" : "3"
6  }
7}
Collectord for docker
In our tests we used the latest released version of Collectord for Docker 5.2.
We used two configurations. One that works out of the box (with gzip compression, SSL, join rules). The second configuration
used HTTP connection for HEC, disabled gzip compression and no join rules.
1...
2--env "COLLECTOR__SPLUNK_URL=output.splunk__url=http://splunk-example:8088/services/collector/event/1.0" \
3--env "COLLECTOR__SPLUNK_GZIP=output.splunk__compressionLevel=nocompression"  \
4--env "COLLECTOR__JOIN=pipe.join__disabled=true" \
5...
Kubernetes
We used a single instance cluster bootstrapped with kubeadm.
1kubectl version
2Client Version: version.Info{Major:"1", Minor:"12", GitVersion:"v1.12.1", GitCommit:"4ed3216f3ec431b140b1d899130a69fc671678f4", GitTreeState:"clean", BuildDate:"2018-10-05T16:46:06Z", GoVersion:"go1.10.4", Compiler:"gc", Platform:"linux/amd64"}
3Server Version: version.Info{Major:"1", Minor:"12", GitVersion:"v1.12.1", GitCommit:"4ed3216f3ec431b140b1d899130a69fc671678f4", GitTreeState:"clean", BuildDate:"2018-10-05T16:36:14Z", GoVersion:"go1.10.4", Compiler:"gc", Platform:"linux/amd64"}
Collectord for kubernetes
In our tests we used the latest released version of Collectord for Kubernetes 5.2.
Similarly to Docker, we used two configurations. One that works out of the box (with gzip compression, SSL, join rules).
The second configuration used HTTP connection for HEC, disabled gzip compression and no join rules.
1[output.splunk]
2url = http://splunk-example:8088/services/collector/event/1.0
3compressionLevel=nocompression
4
5[pipe.join]
6disabled = true
Log generator
We used ocp_logtest with the following configuration
1python ocp_logtest.py --line-length=1024 --num-lines=300000 --rate 60000 --fixed-lineThat configuration generates close to 1,000 events from one container with the average size of 1024 bytes.
To run it in Docker we used the command below. To forward 5,000 events we would run five of these containers in parallel.
1docker run --rm \
2  --label=test=testN \
3  -d docker.io/mffiedler/ocp-logtest:latest \
4  python ocp_logtest.py --line-length=1024 --num-lines=300000 --rate 60000 --fixed-line
To run the log generator in Kubernetes we used Jobs. Each had the same definition as the one below. To forward 5,000 events we would run five
of these Jobs in parallel (you need to change the name of the job).
 1apiVersion: batch/v1
 2kind: Job
 3metadata:
 4  name: logtestX
 5  labels:
 6    test: 'testN'
 7spec:
 8  template:
 9    spec:
10      restartPolicy: Never
11      containers:
12      - name: c1
13        image: docker.io/mffiedler/ocp-logtest:latest
14        command:
15          - python
16        args:
17          - ocp_logtest.py
18          - --line-length=1024
19          - --num-lines=300000
20          - --rate=60000
21          - --fixed-line
Tests
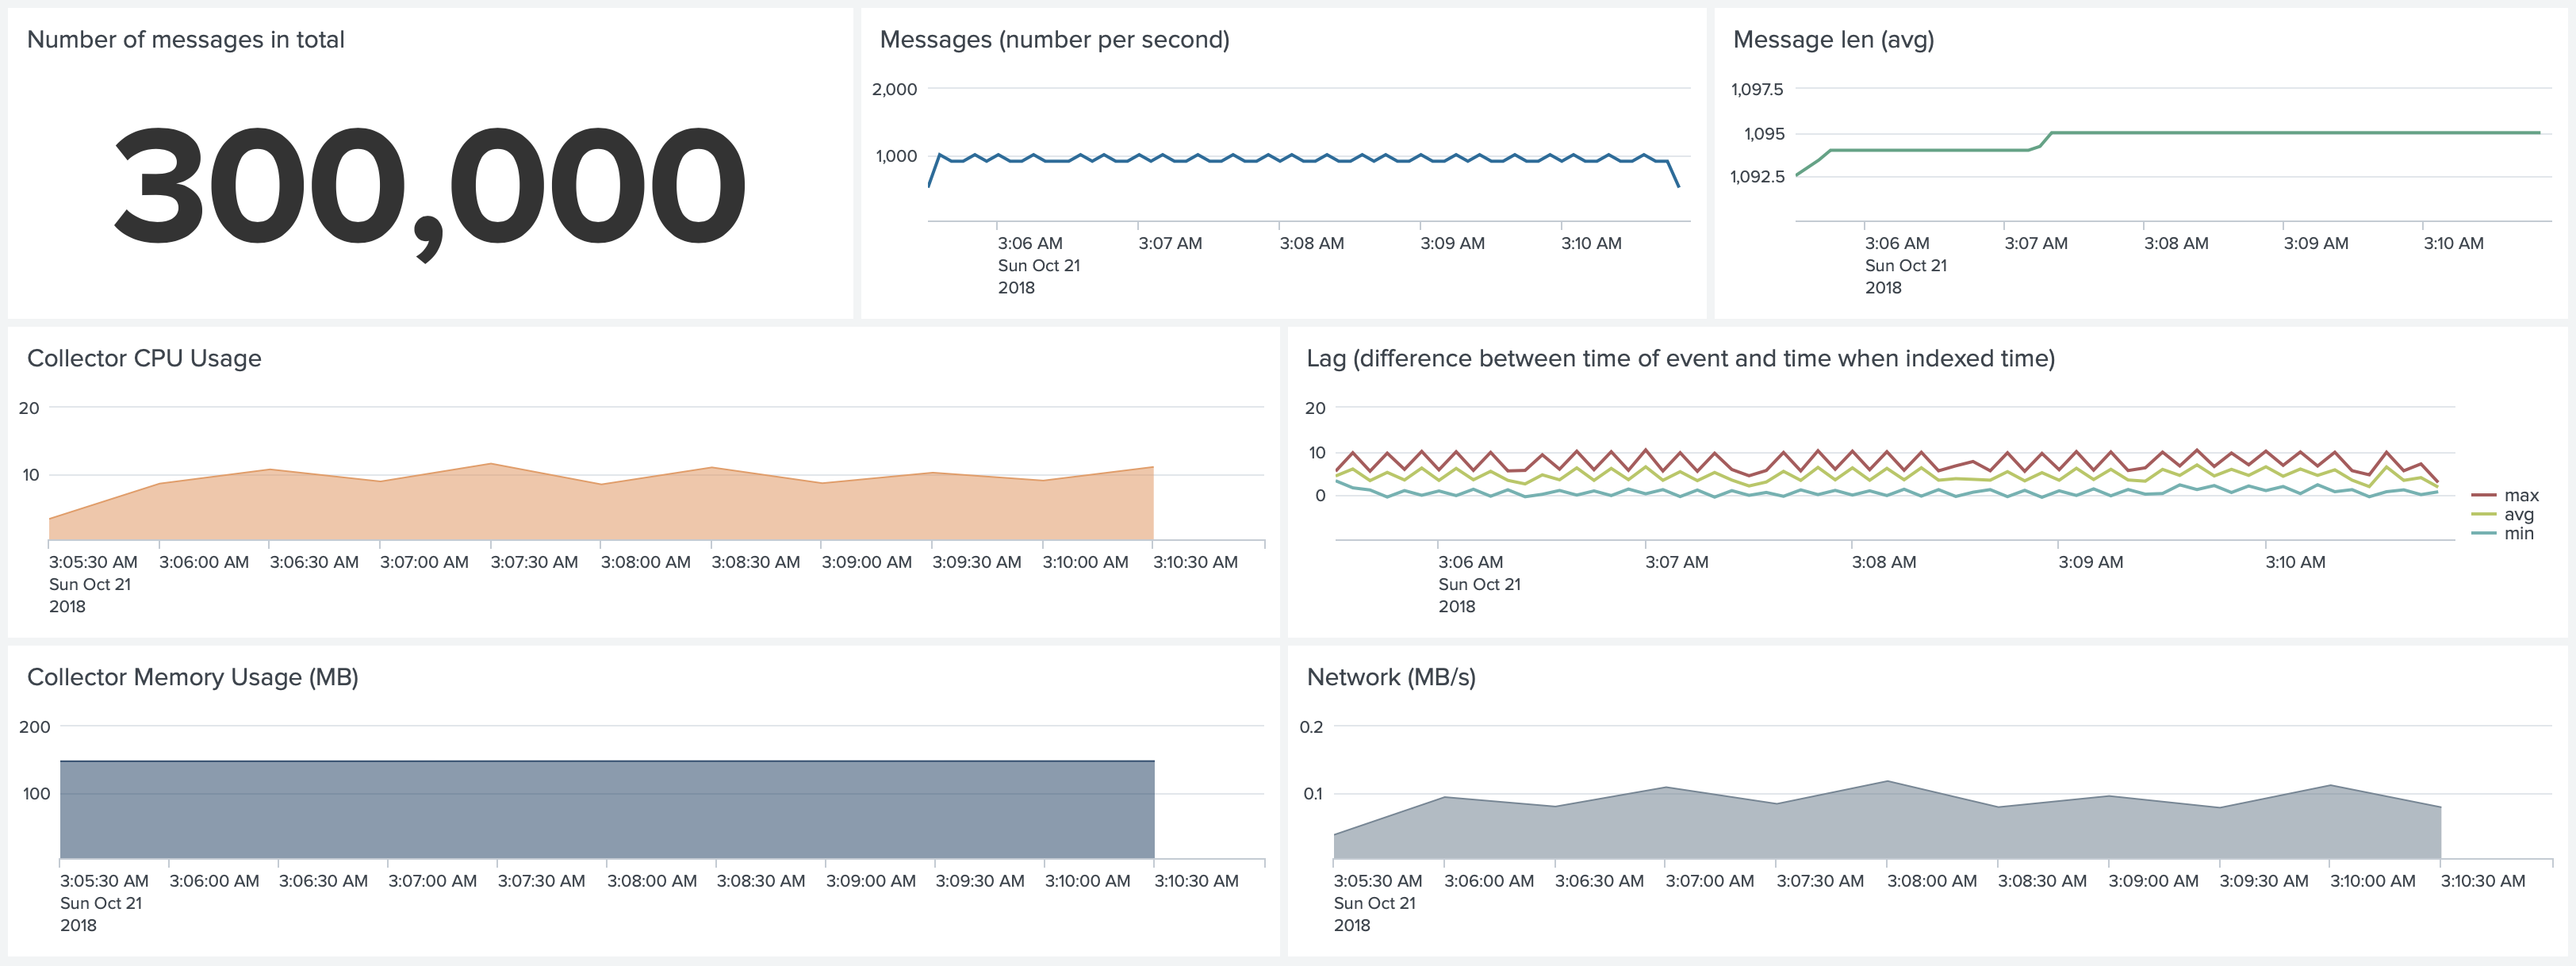
In our test dashboards we show:
- The number of messages in total (to verify that we have not lost any messages).
- The number of messages per second (only from tested containers).
- Message len (
len(_raw), only the size of the logline, excluding the metadata that we attach). - Collectord CPU usage percent of a single core.
- Lag, the difference between
_indextimeand_time(... | timechart avg(eval(_indextime-_time))). We showmax,avgandmin. - Collectord memory usage in MB.
- Network transmit from the Collectord container (in case of Kubernetes network transmit from the host, as it is running on the host network).
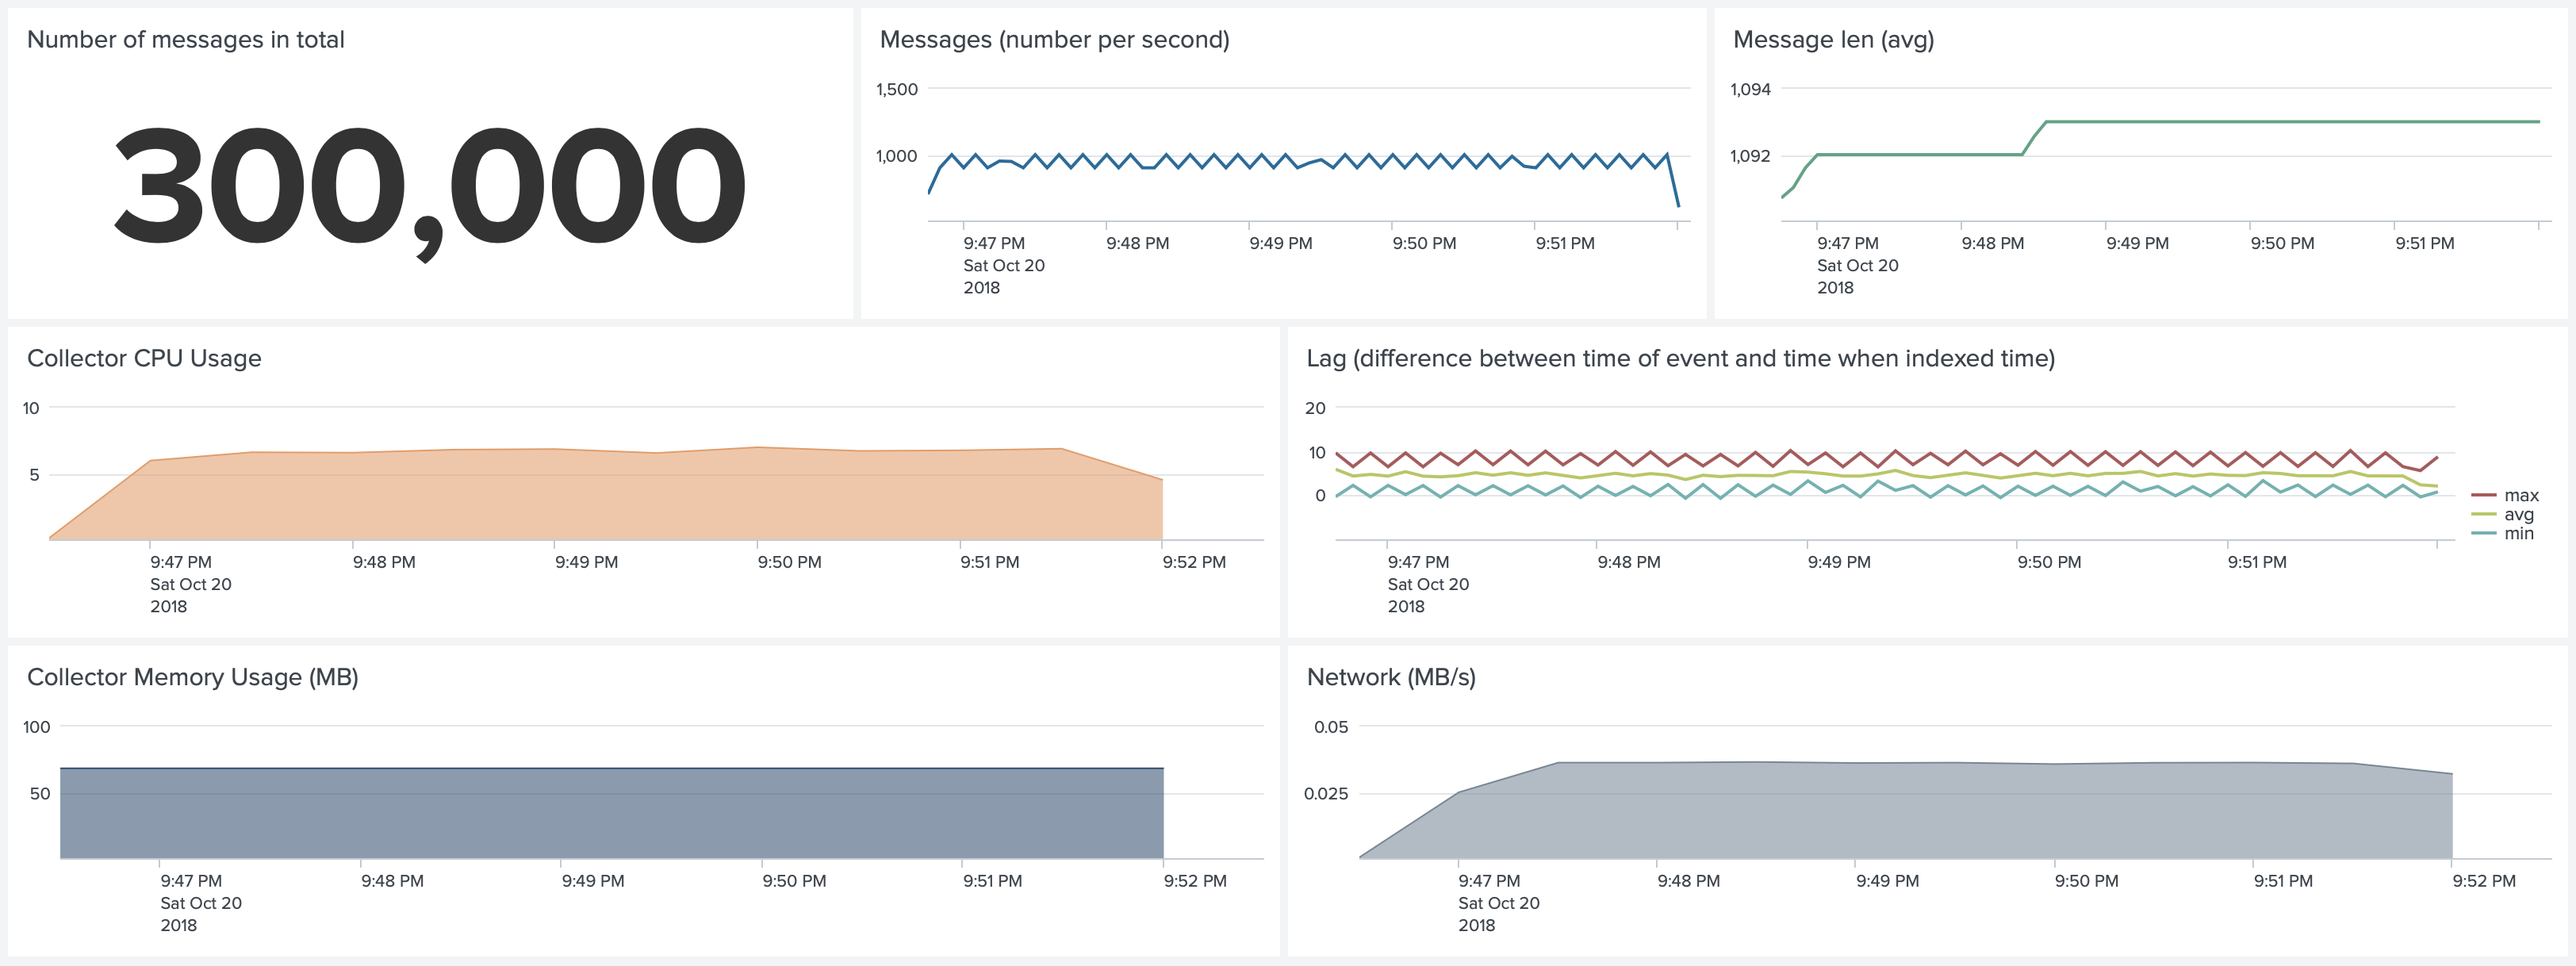
Test 1. Docker environment. Default Configuration. Forwarding 1,000 1k events per second
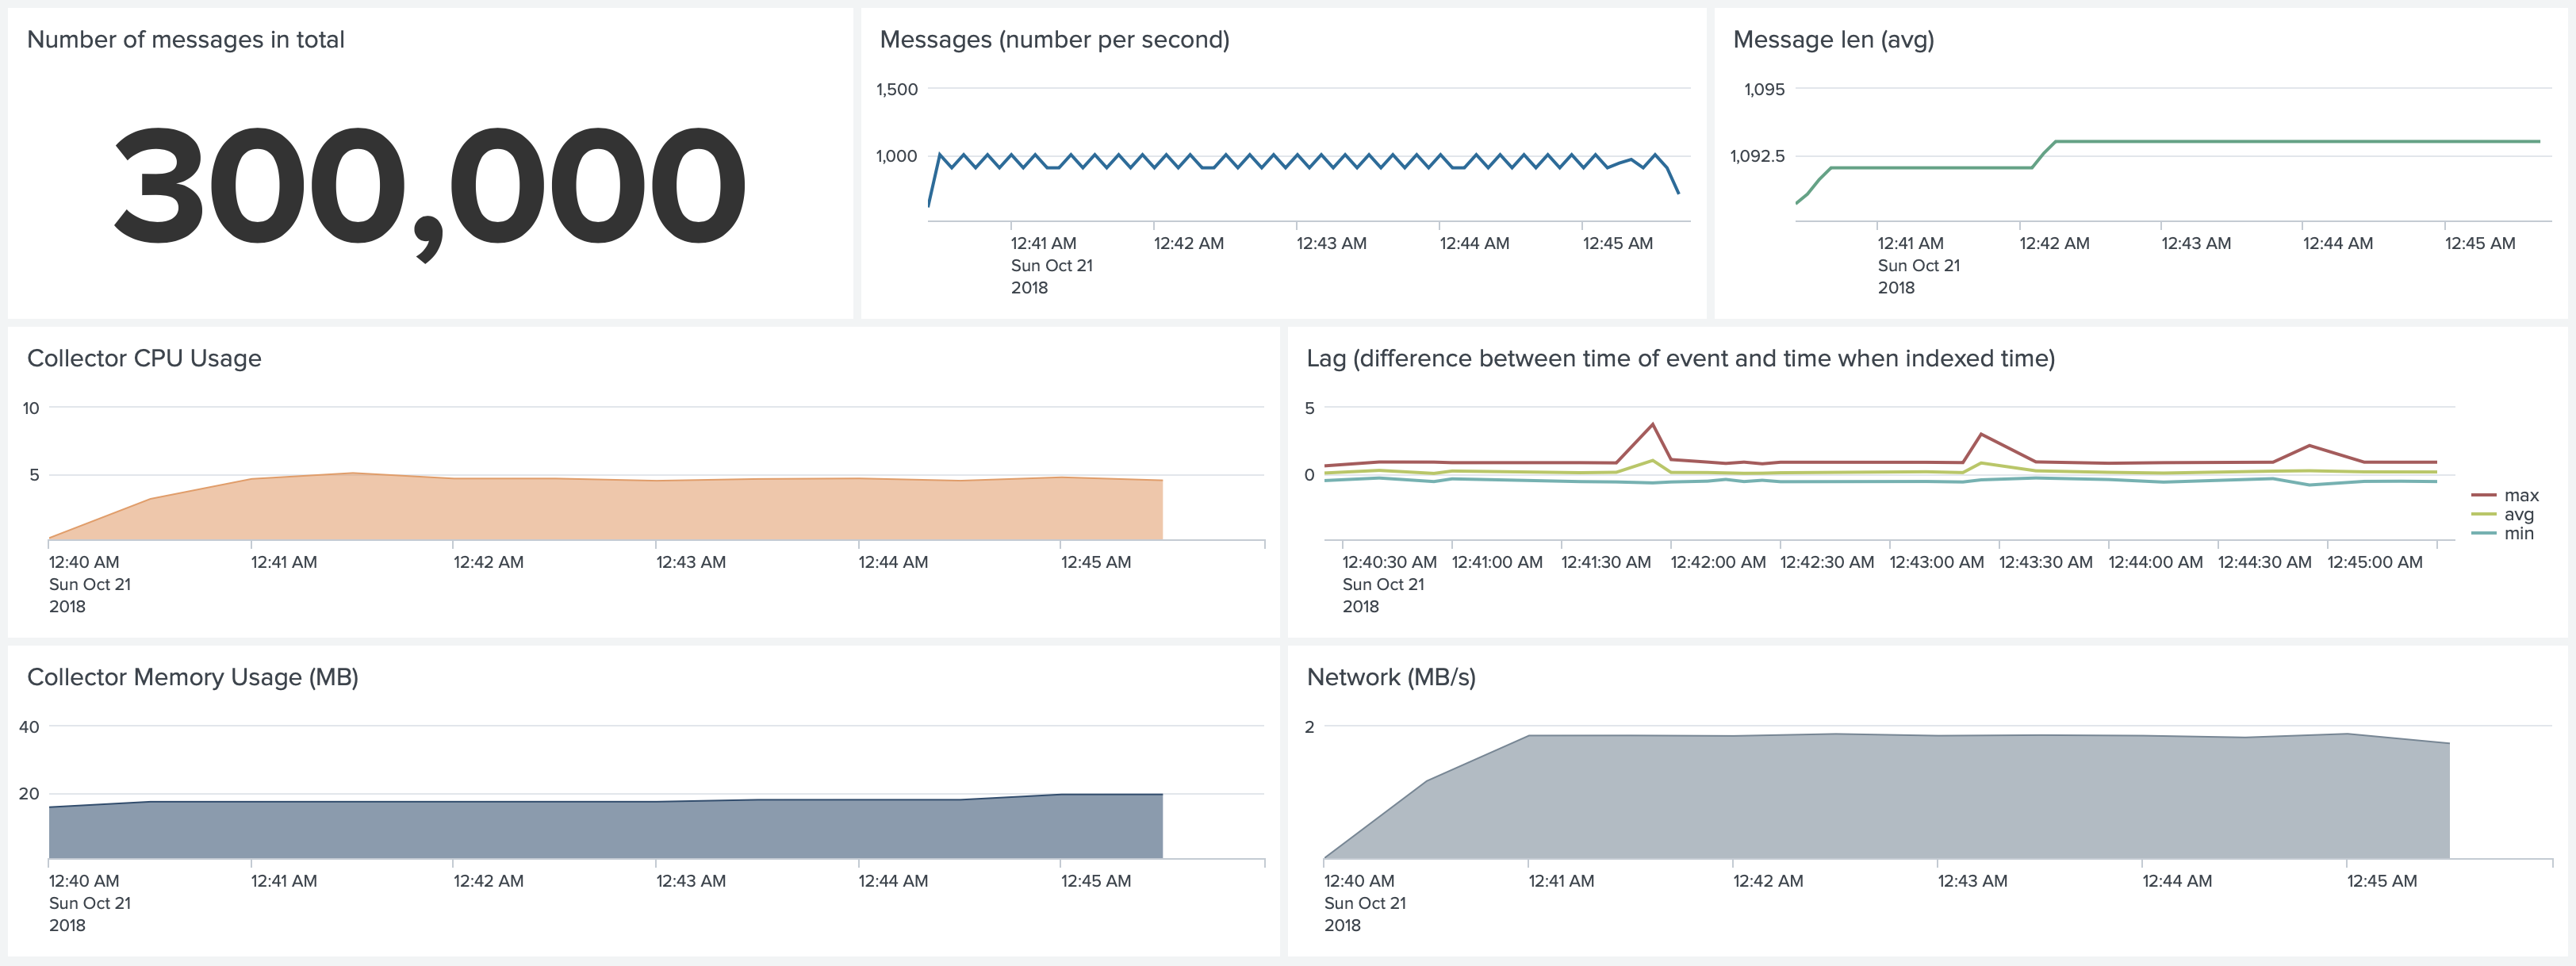
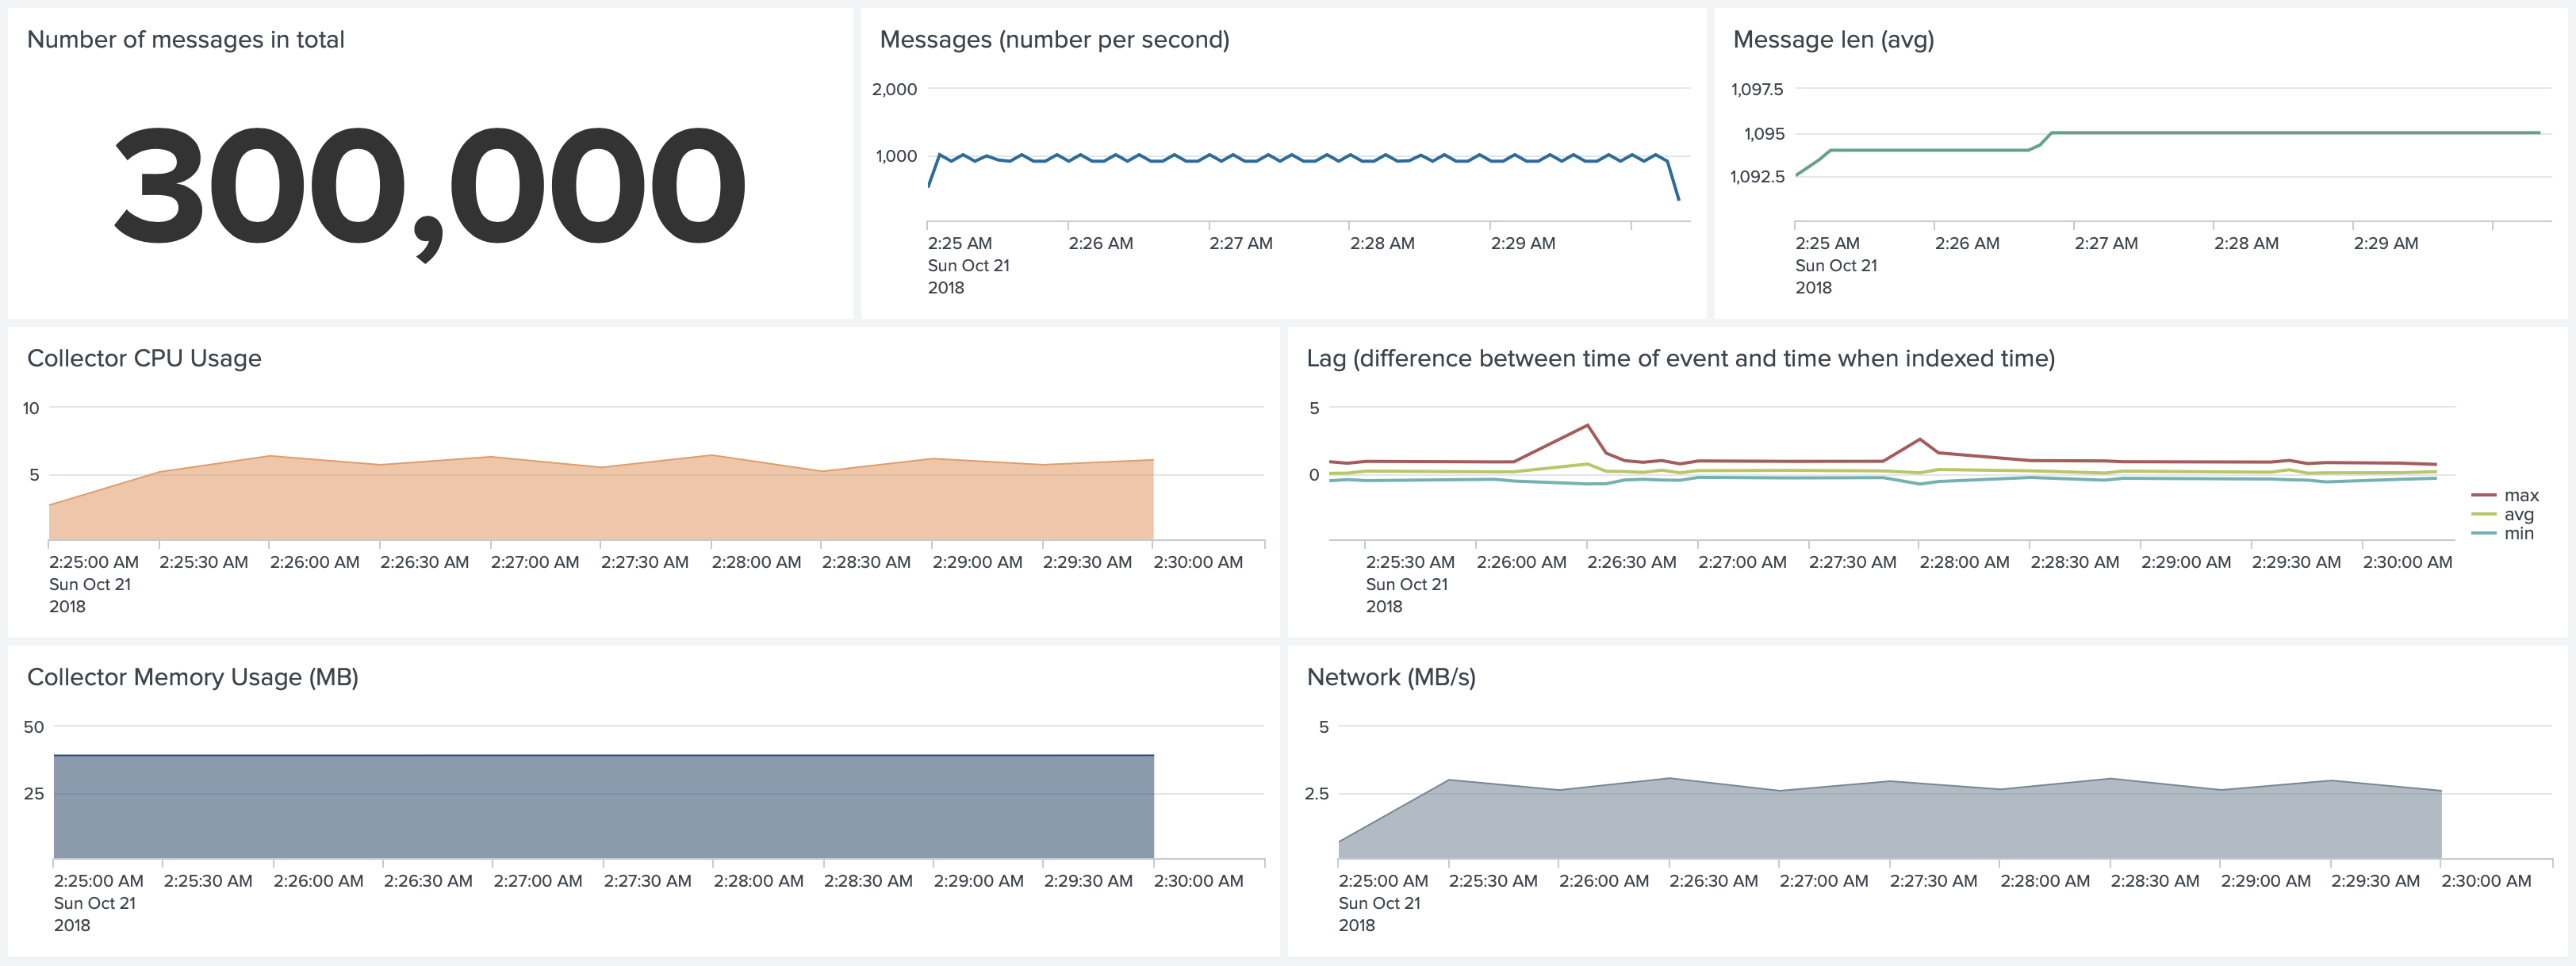
Test 2. Docker environment. No SSL, No Gzip, No Join. Forwarding 1,000 1k events per second
Changing the default configuration can significantly impact the results. Because we do not use SSL and we do not use Gzip
we reduced the CPU usage from 6-7% to 4-5%. Because we do not use Gzip we reduced memory usage from 60Mb to 20Mb,
simply because our batchSize is still the same 768K, but now we are talking about not-compressed 768K. But the network
usage grew from 50KB/s to almost 2MB/s.
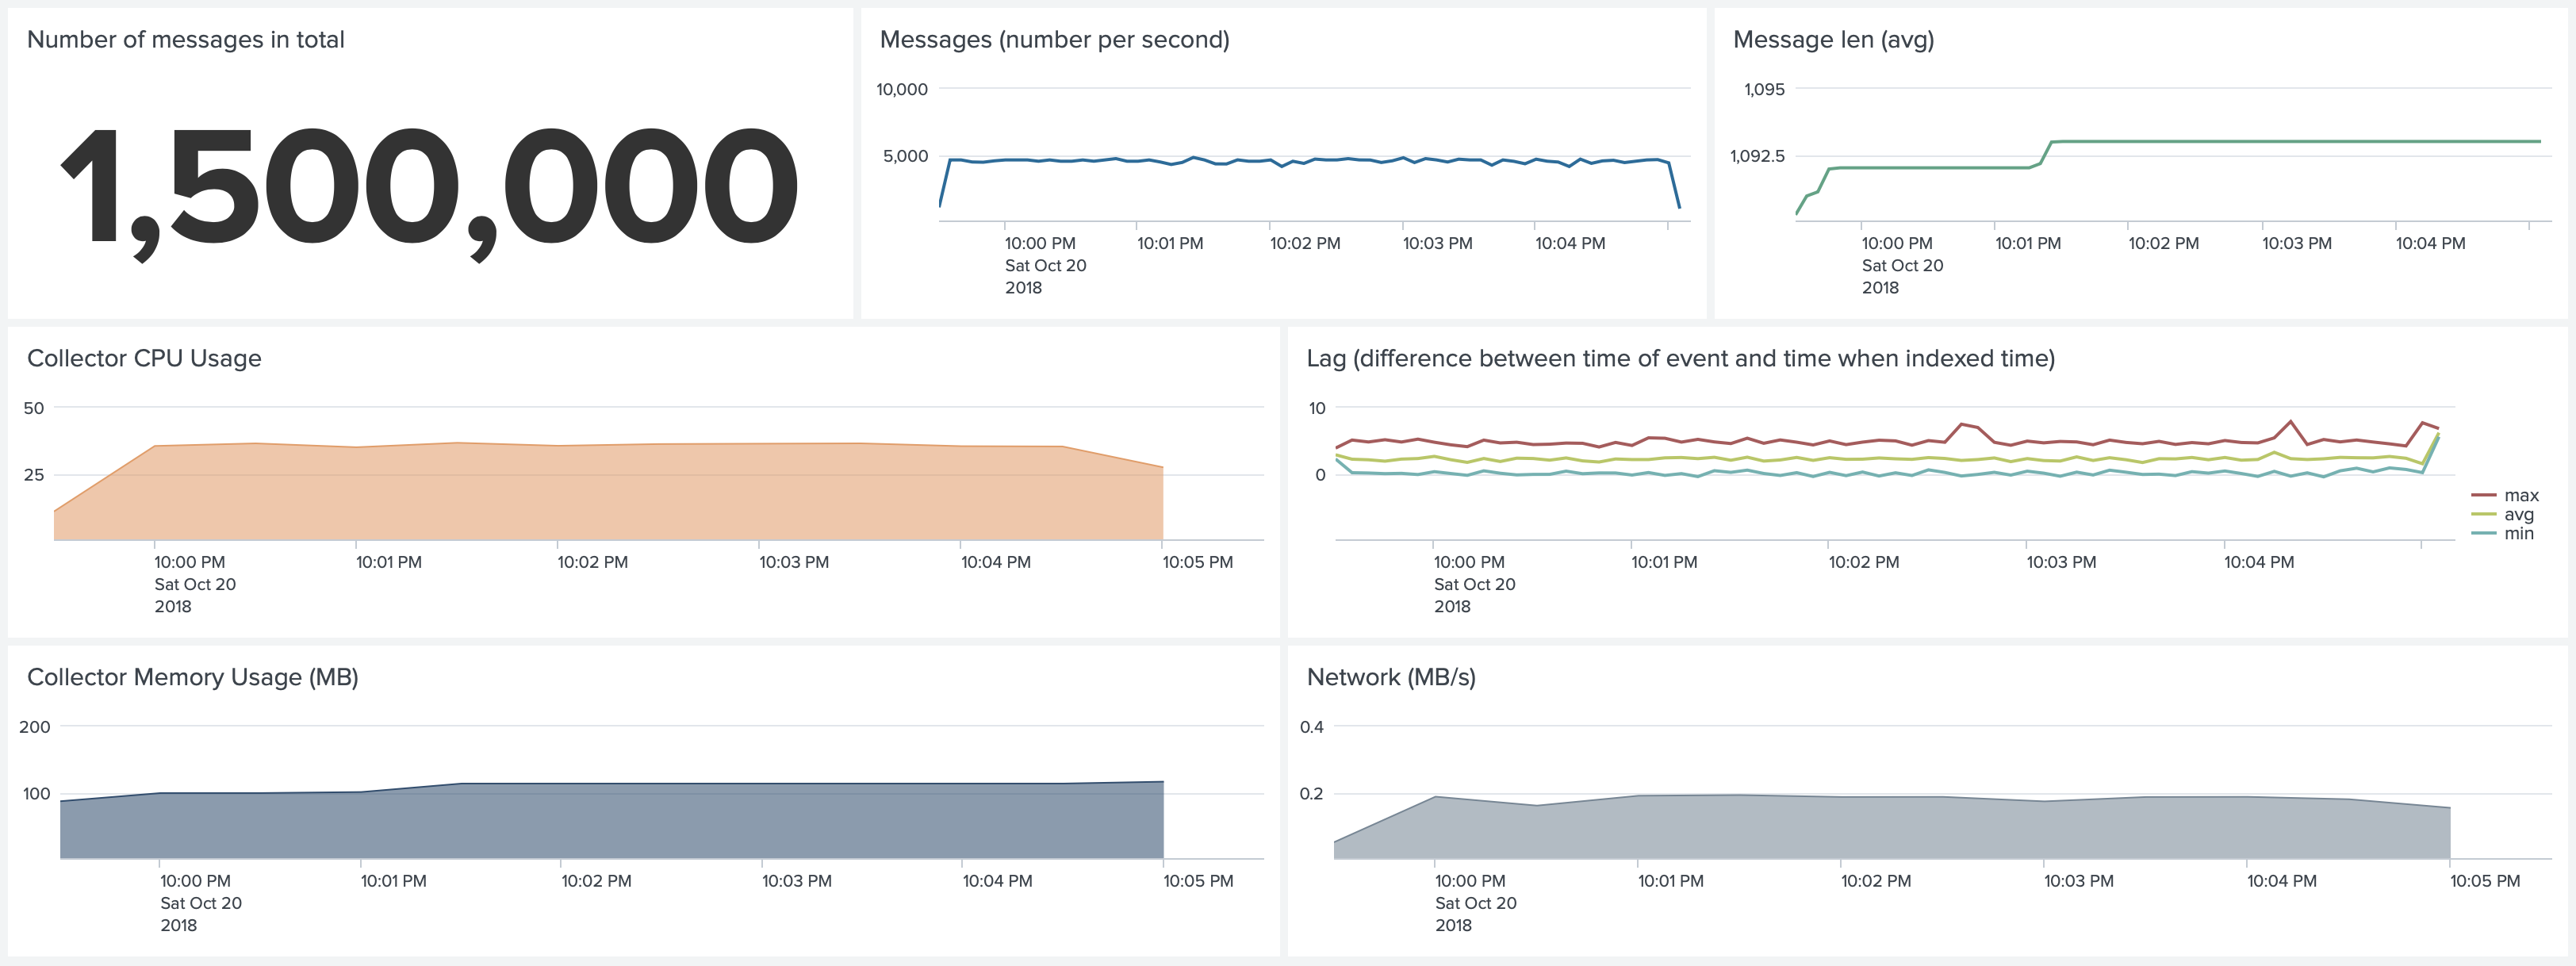
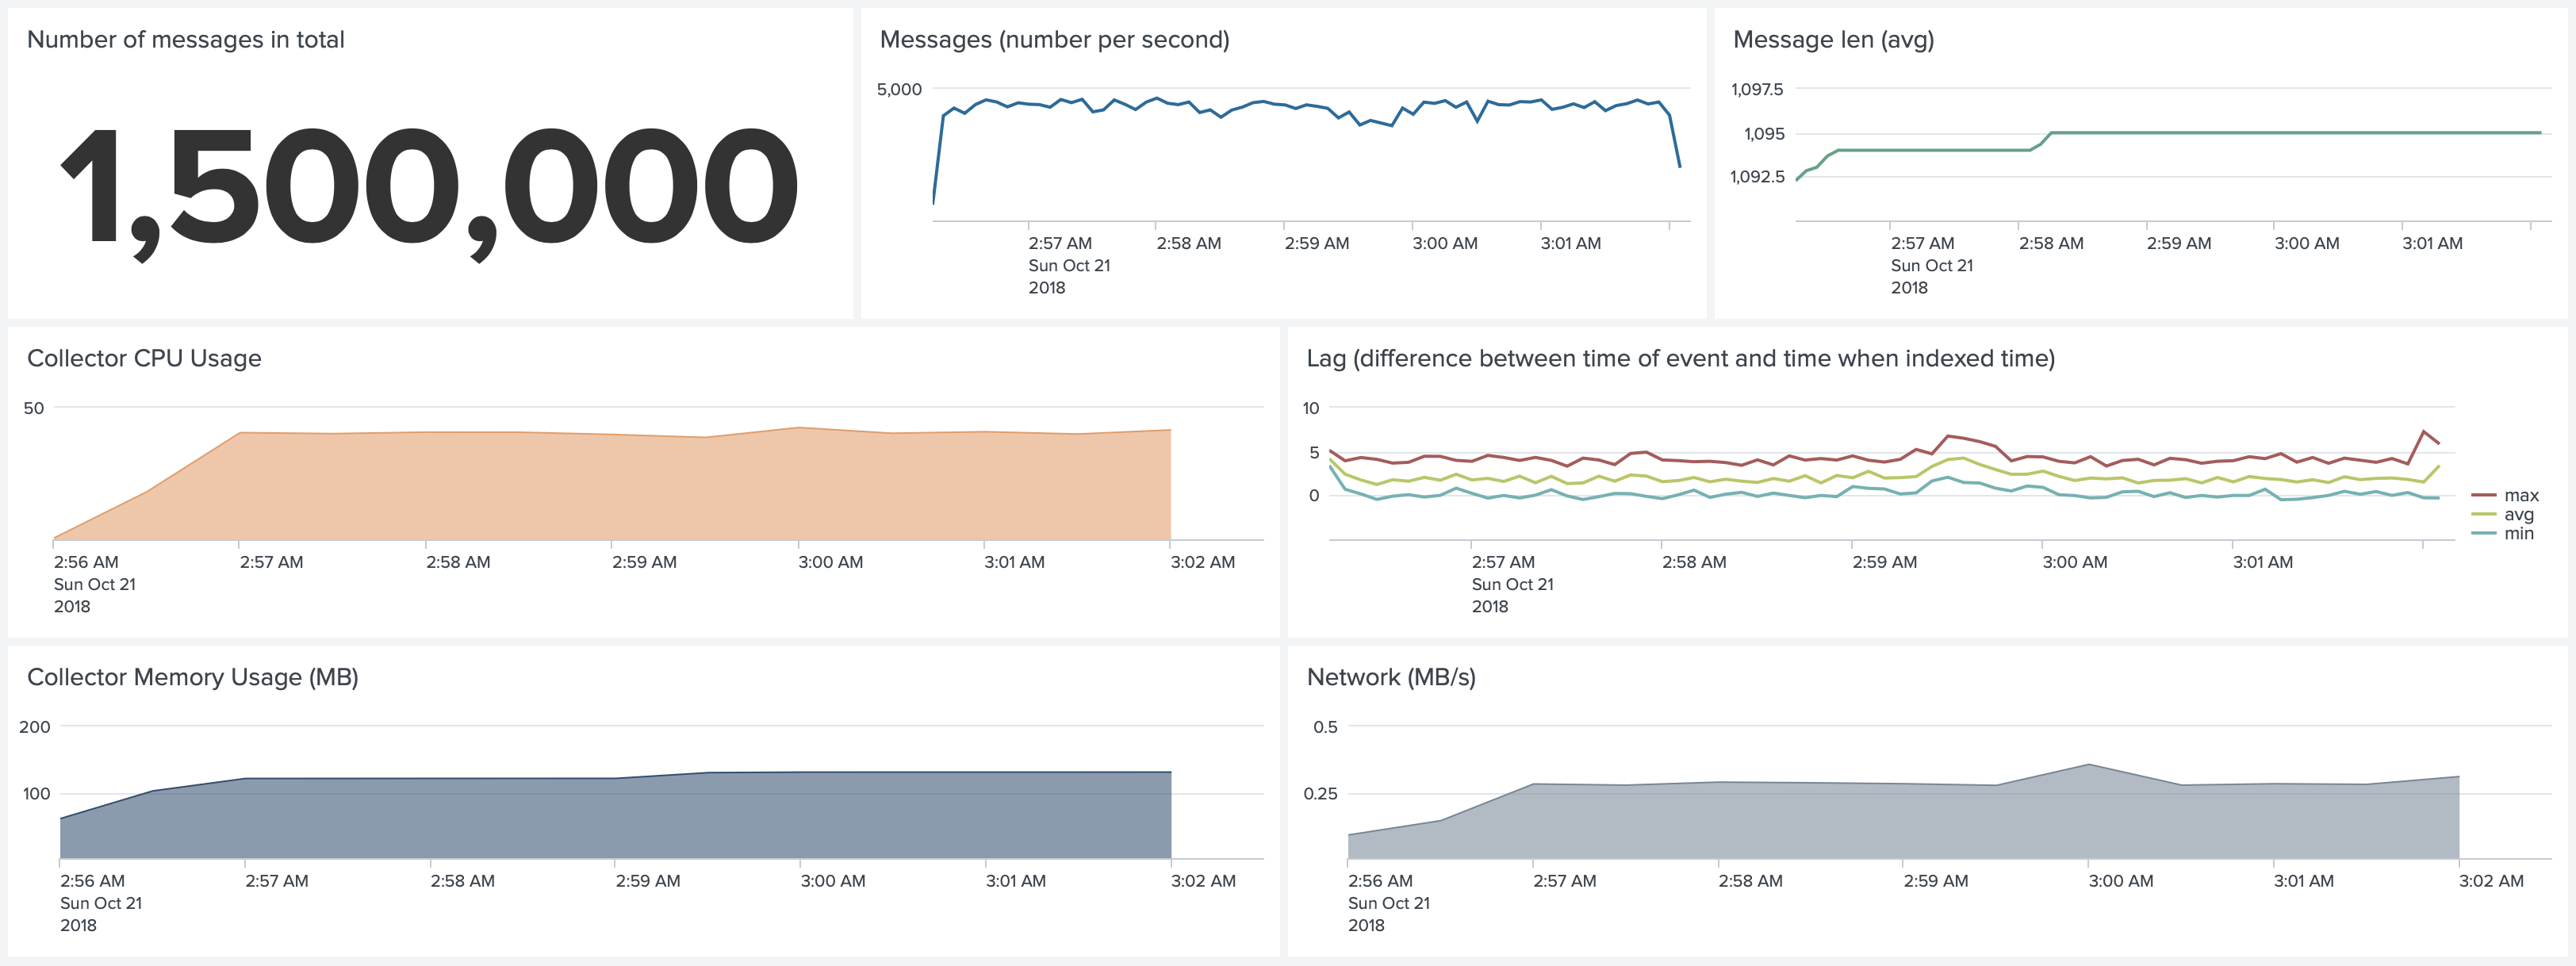
Test 3. Docker environment. Default Configuration. Forwarding 5,000 1k events per second
Compared to Test 1, now we forward 5 times more events. Instead of 6-7% CPU usage we see 30-35% CPU usage of a single core,
and increased memory usage from 60MB to around 110MB.
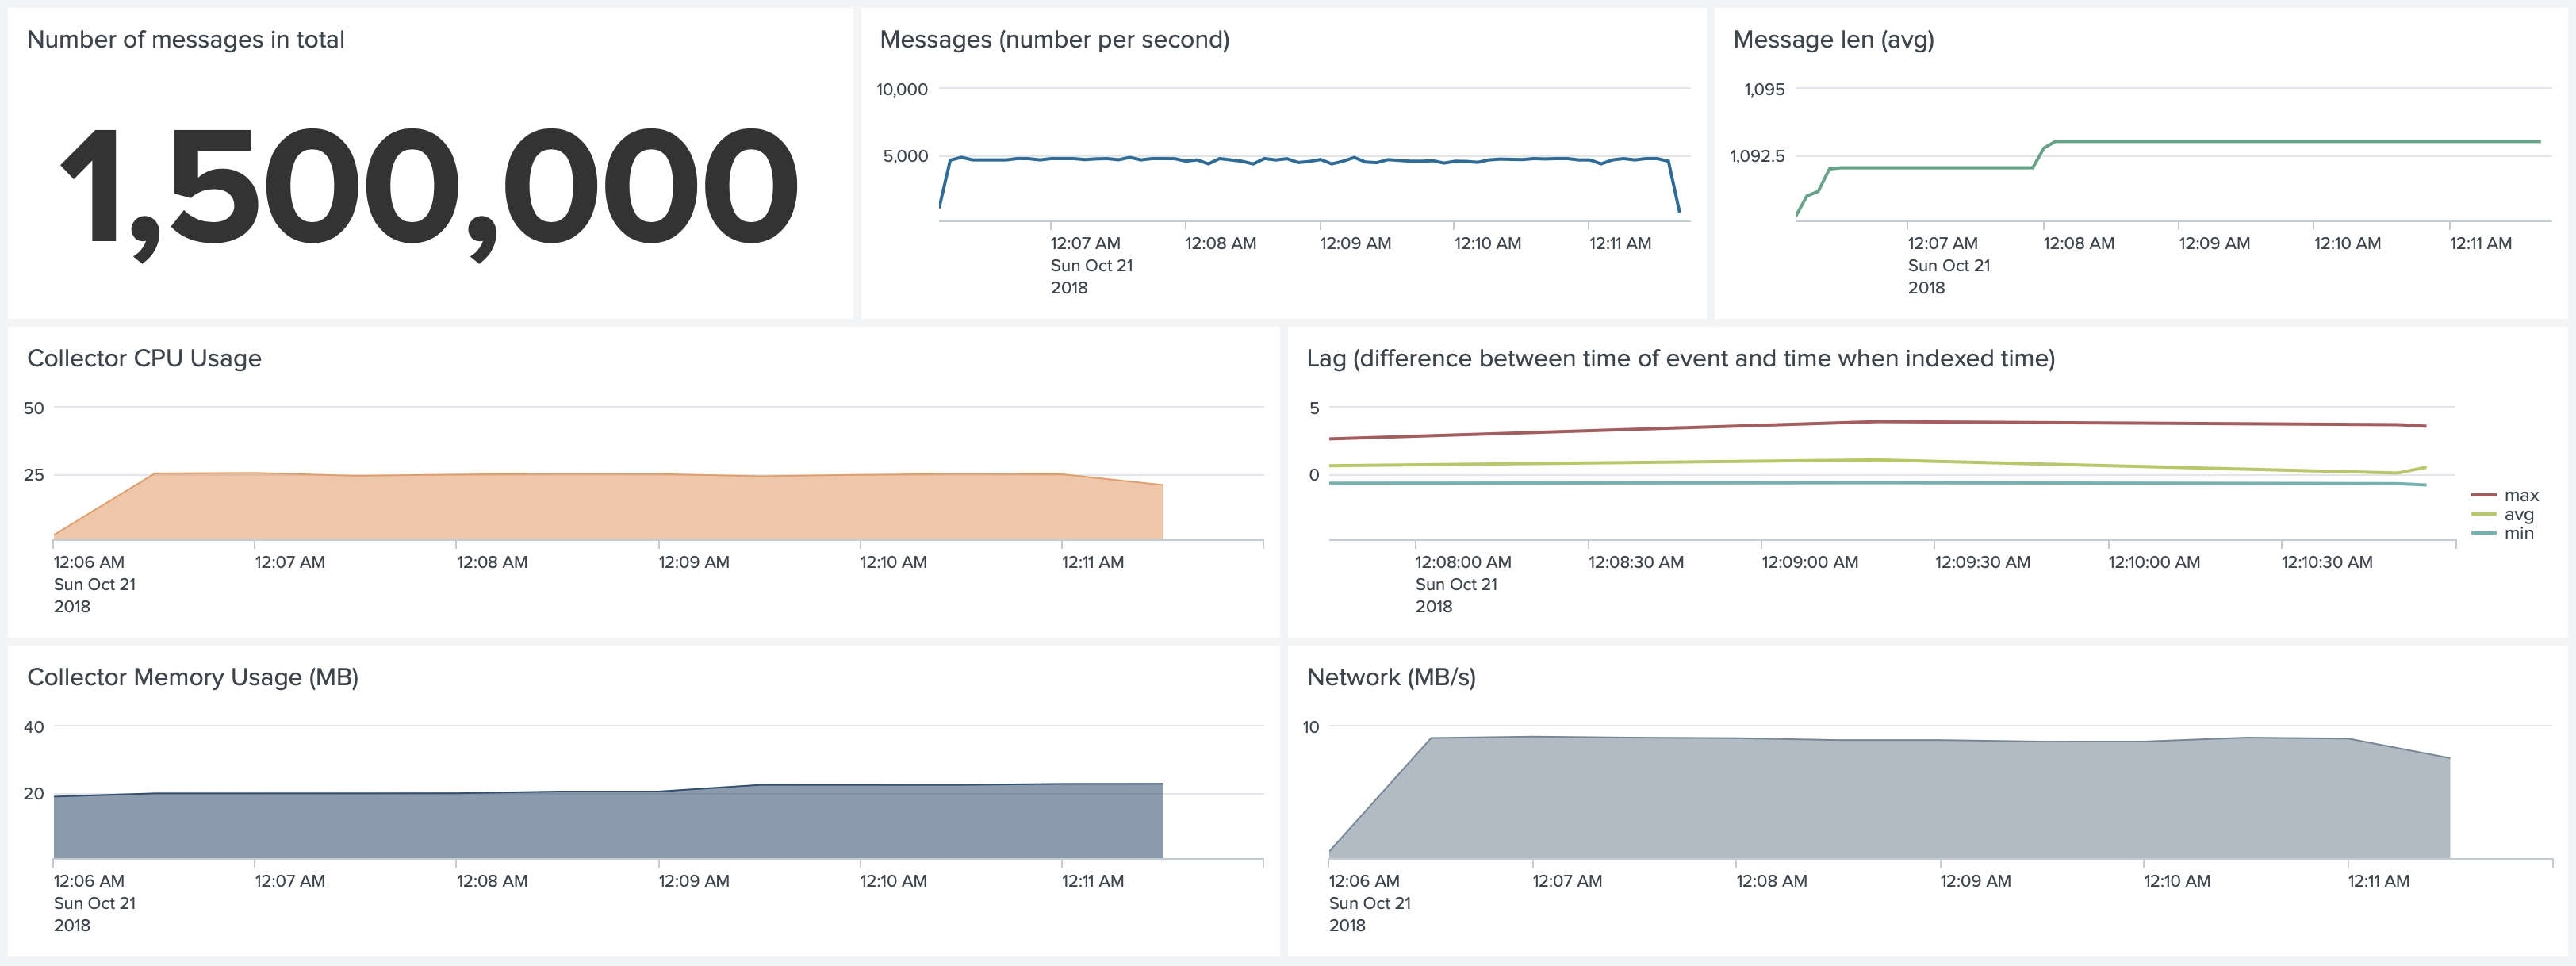
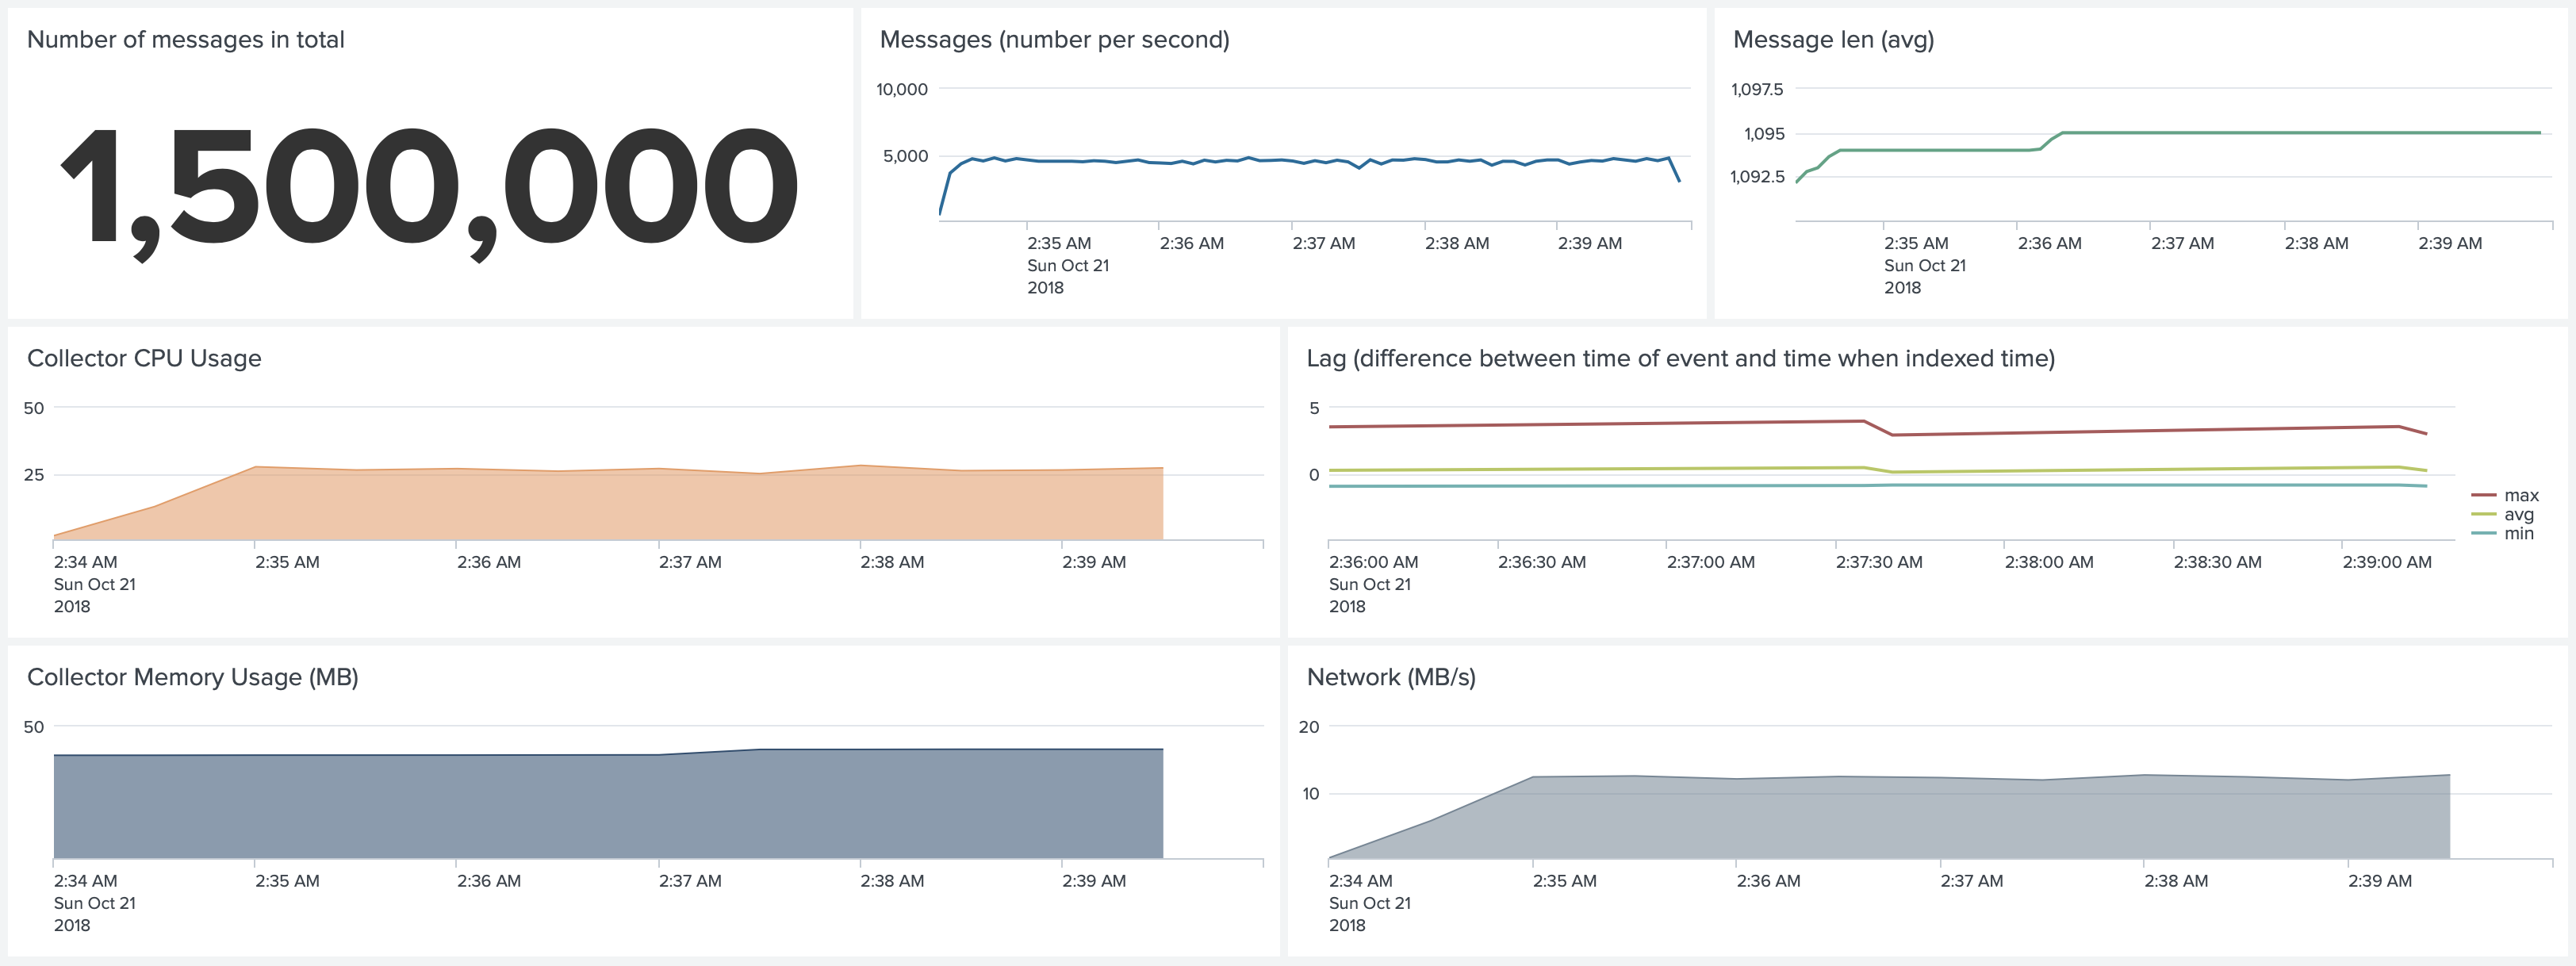
Test 4. Docker environment. No SSL, No Gzip, No Join. Forwarding 5,000 1k events per second
Disabling SSL, Gzip and Join rules can reduce CPU usage from 30-35% to 25%. But disabling Gzip compression increases the network traffic.
When you do not pay for network traffic between your nodes and Splunk instance, and if you have enough bandwidth to support
it, you can choose not to use Gzip compression.
Test 5. Kubernetes environment. Default Configuration. Forwarding 1,000 1k events per second
Similarly to the Docker environment, we tested the Kubernetes environment as well. CPU and Memory usage on Kubernetes clusters is slightly higher for several reasons. First, these Collectord instances are still performing a collection of all other data that we configure, including system metrics, Prometheus metrics, network metrics, host logs. Collectord for Kubernetes forwards more data by default, because of the more complex environment. The second reason is that we attach more metadata to logs and metrics, as we forward not only information about the Containers and Pods, but also information about the Workloads that created this Pod, and the Host information as well.
Memory usage in this test is not very accurate, because we ran the 5,000 1k events test right before this test, which
increased the memory usage of the Collectord and kept the memory reserved.
Test 6. Kubernetes environment. No SSL, No Gzip, No Join. Forwarding 1,000 1k events per second
Similar result to Docker environment. Not using Gzip compression can reduce CPU usage, and reduce Memory usage.
From 9-10% to 5-6% CPU usage of a single core.
Test 7. Kubernetes environment. Default Configuration. Forwarding 5,000 1k events per second
Forwarding 5,000 events uses 40% of CPU. Compared to test 5, we see a 4x change.
Test 8. Kubernetes environment. No SSL, No Gzip, No Join. Forwarding 5,000 1k events per second
Disabling Gzip compression reduces CPU usage from 40% to 26% of a single core.
Test 9. Docker environment. Default Configuration. Forwarding 10,000 1k events per second
To be able to forward more than 5,000 events, we reserved a c5d.xlarge instance for this test, to make sure that we would
not be affected by the performance of the gp2 EBS volume.
We changed the configuration of Collectord and increased the number of Splunk threads to 5. In our tests, we see
that one Splunk Client with the default configurations (SSL, Gzip compression, 768K batch size) can forward
about 5,000 events. We recommend increasing this value if you have more than 4,000 events per second.
1--env "COLLECTOR__SPLUNK_THREADS=output.splunk__threads=5" Doing that allowed us to forward 10,000 events per second. Compared to test 3 we are using 60% of a single core. The
memory usage grew to 400MB because of the dedicated threads (and buffers allocated for them).
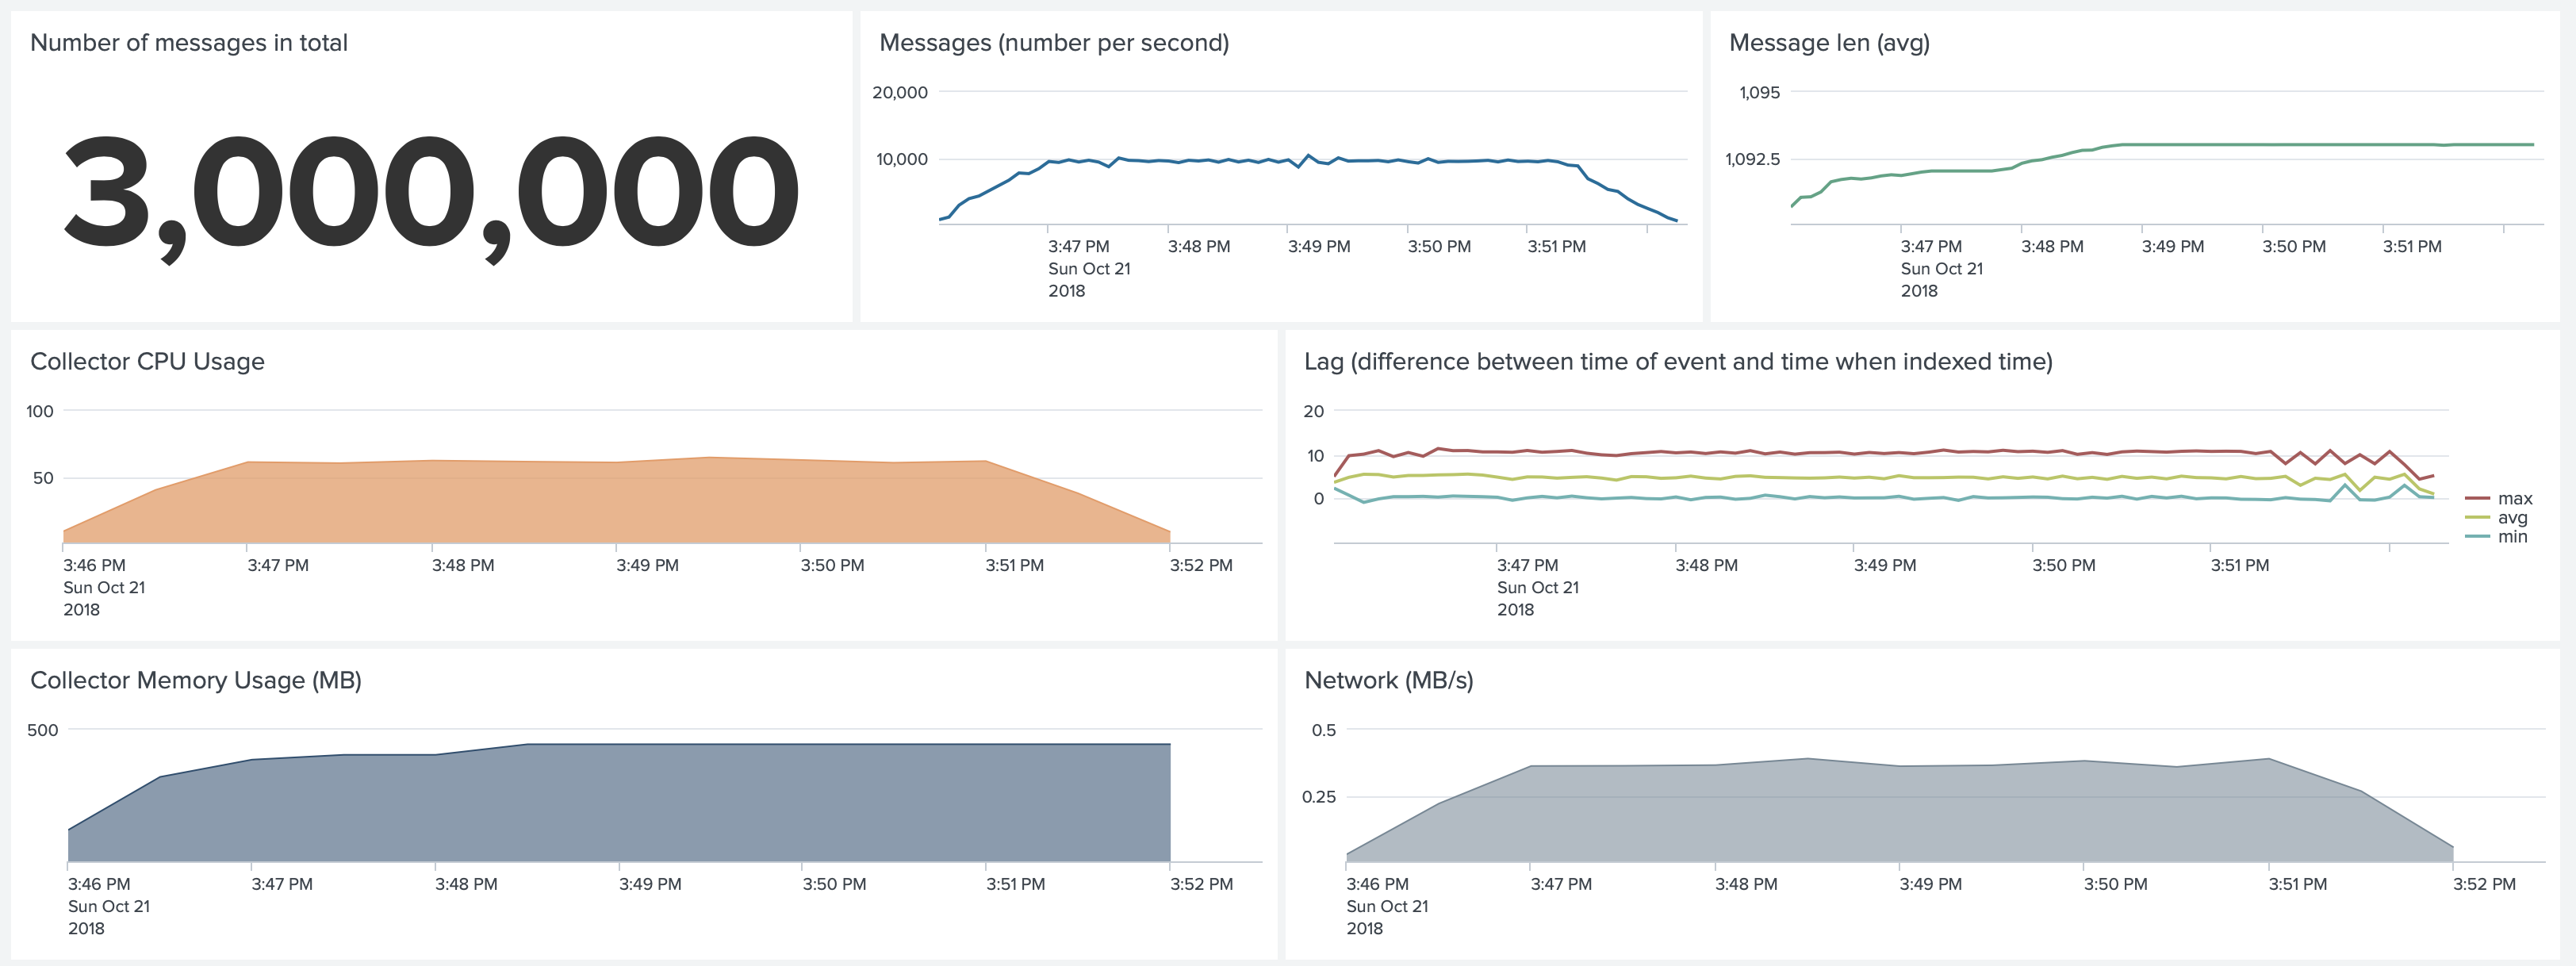
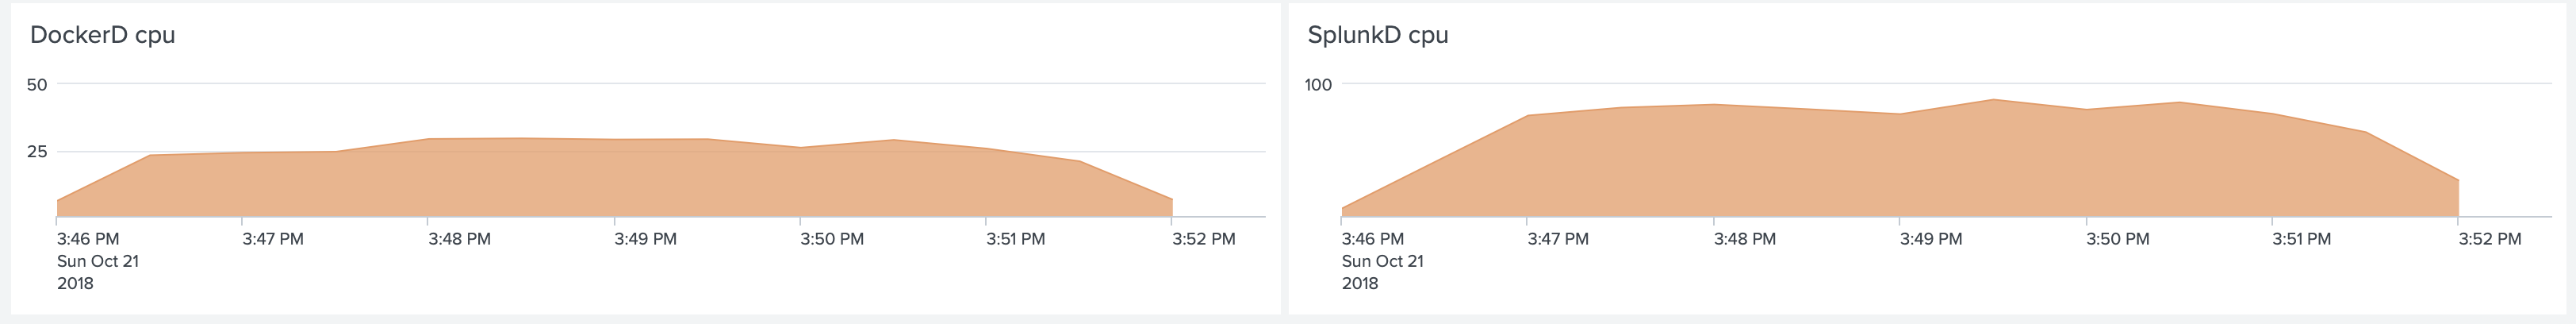
An important detail is that with this amount of events dockerd CPU uses around 25% of a single core.
The Splunk process used 80% of a single core CPU on its host.
Summary
If you want to reproduce these tests in your environment, we have shared with you all the steps we performed. If you find that some steps are missing, please let us know.
Forwarding up to 5,000 1k events per second does not require any changes to the configuration. To forward beyond that
you need to change the number of threads.
These results are not our limit. We will keep working on improving performance and memory usage in the future.


