Blog
Monitoring Docker, OpenShift and Kubernetes - Version 5.2 (Storage usage and alerts)
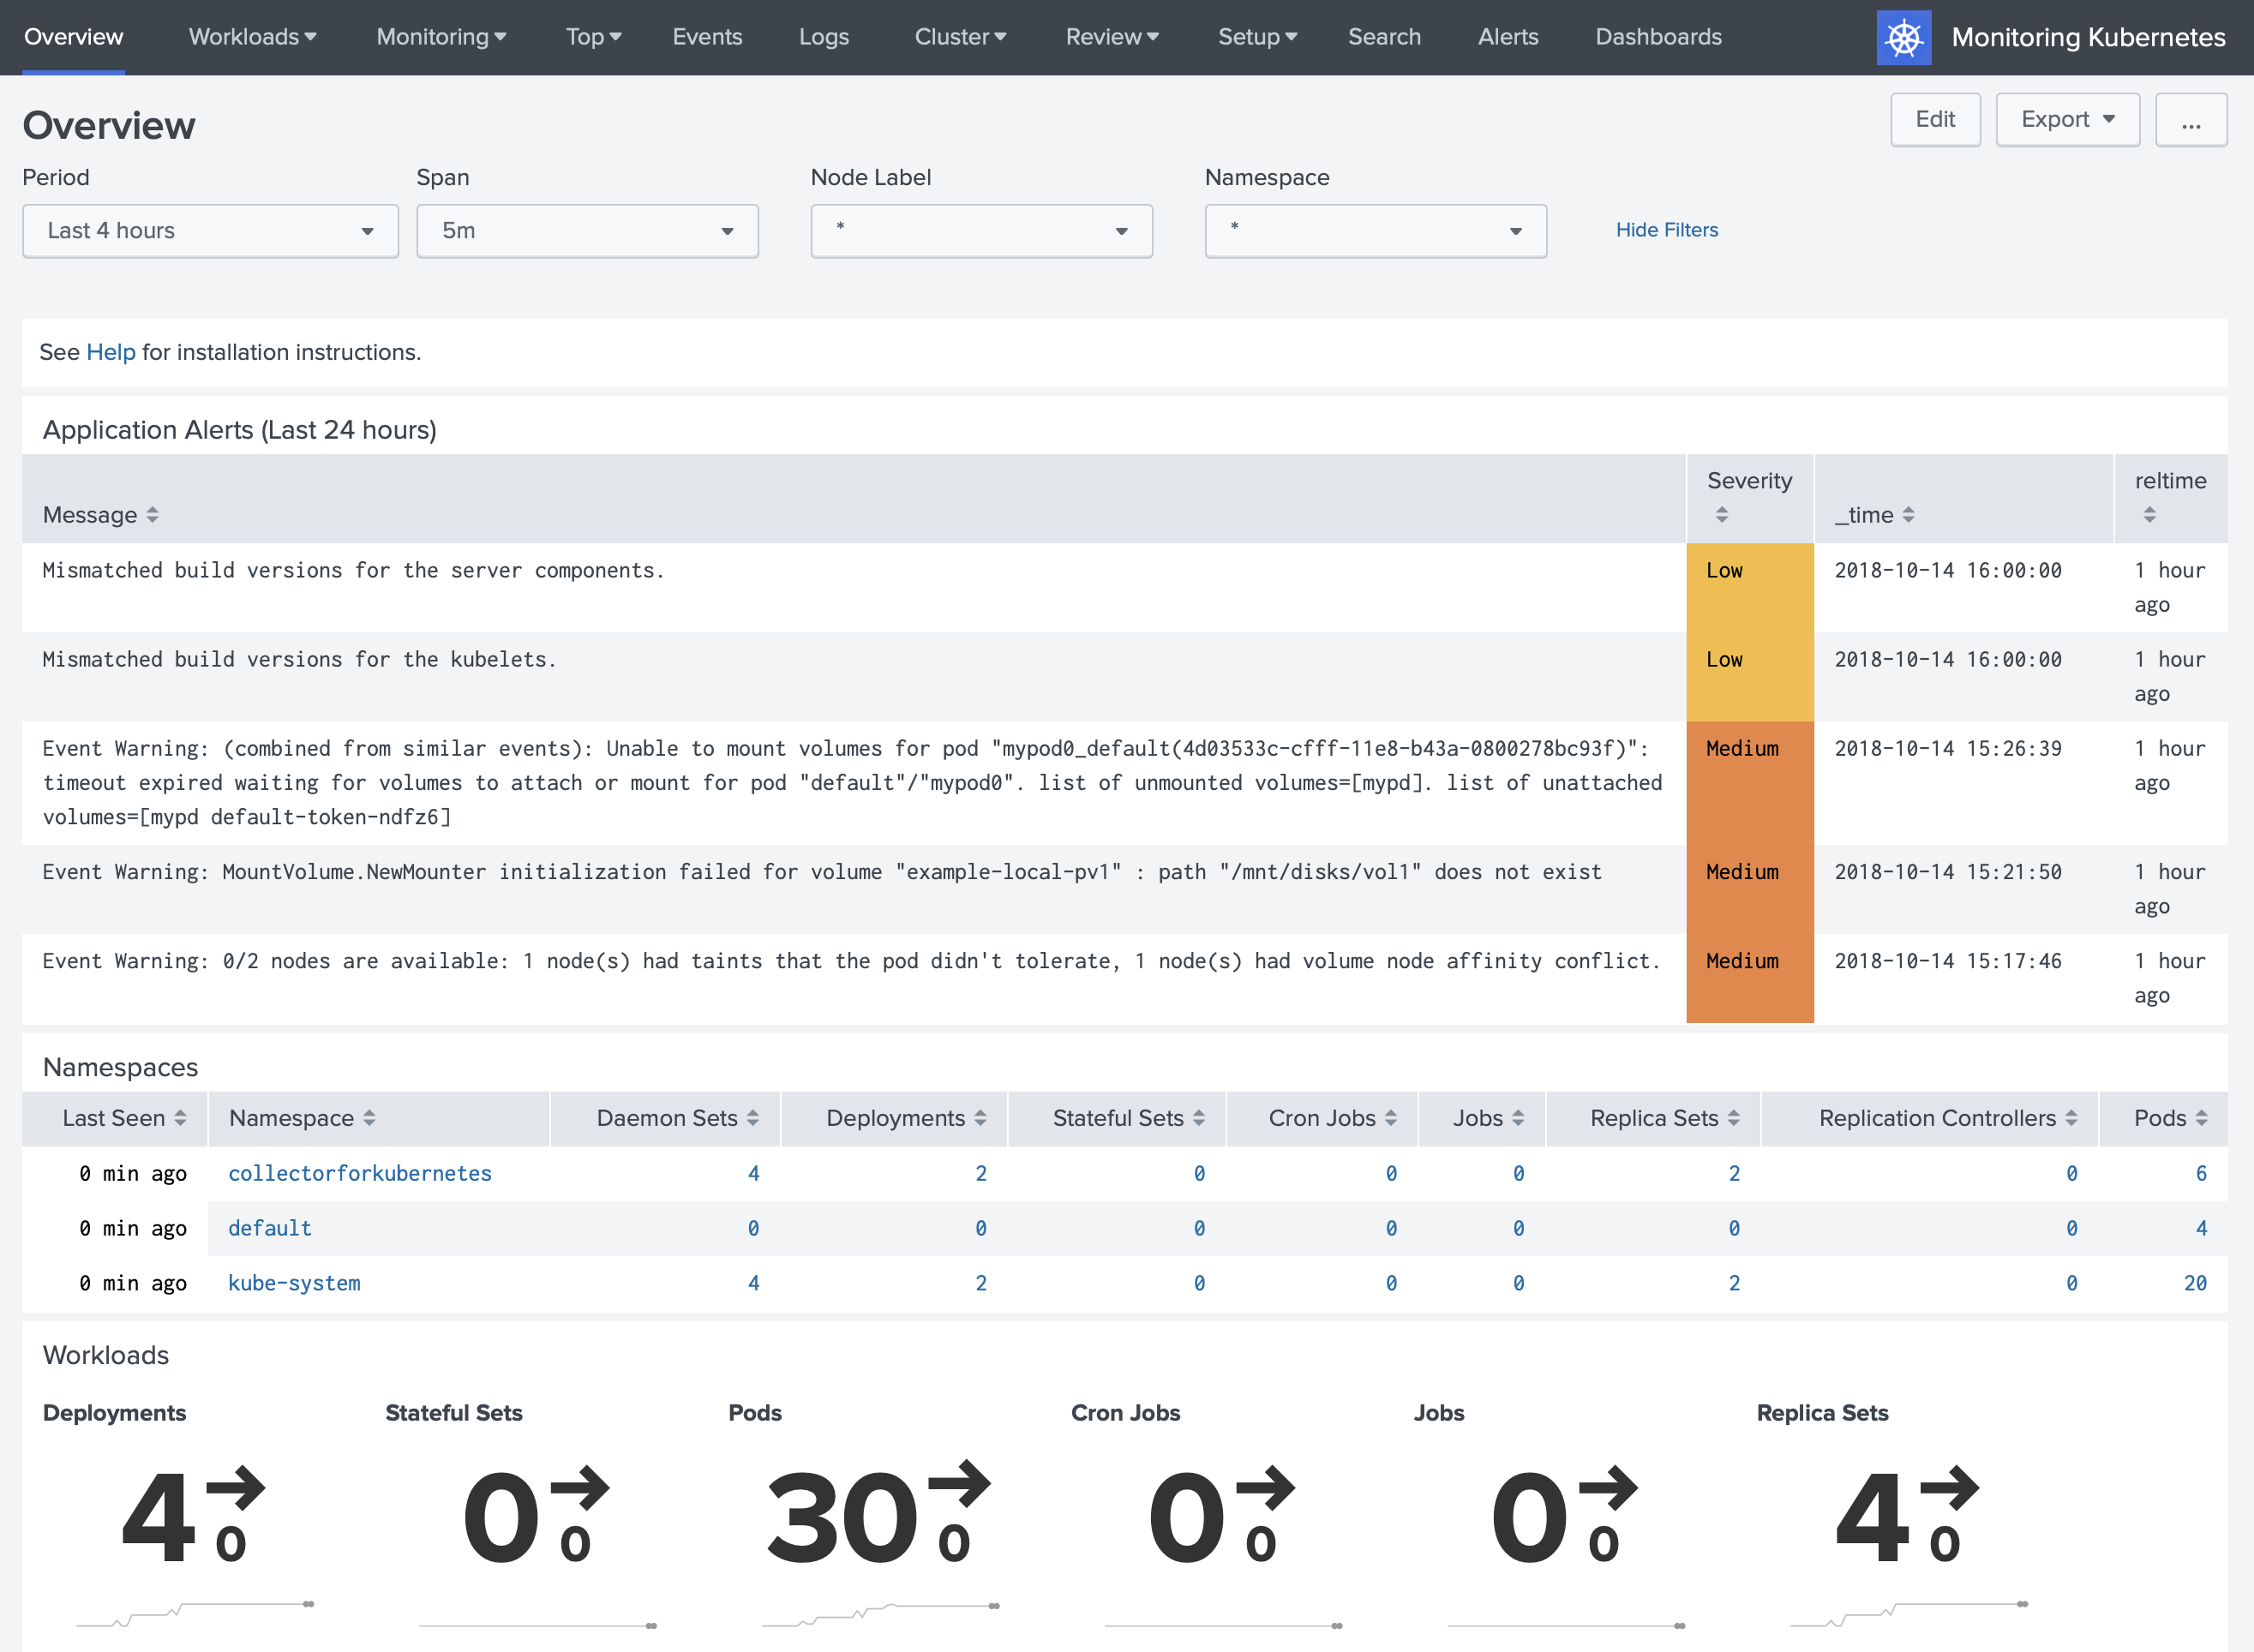
With version 5.2 we are increasing observability of your clusters by providing you with information about Storage usage for mounts where you run your runtime (docker or kubelet) and helping you to react to the issues faster with pre-built alerts. We updated several control plane dashboards to help you resolve issues raised by alerts, and improved performance for the Overview dashboard, so you will be able to find workloads and pods quicker.
On the server side, we also improved performance, added new annotations to help you reduce the amount of unnecessary data that you want to forward to Splunk, improved security by building our docker.io from scratch instead of alpine, and added self-diagnostic CLI commands that help you to troubleshoot our deployments and verify configurations.
Application updates
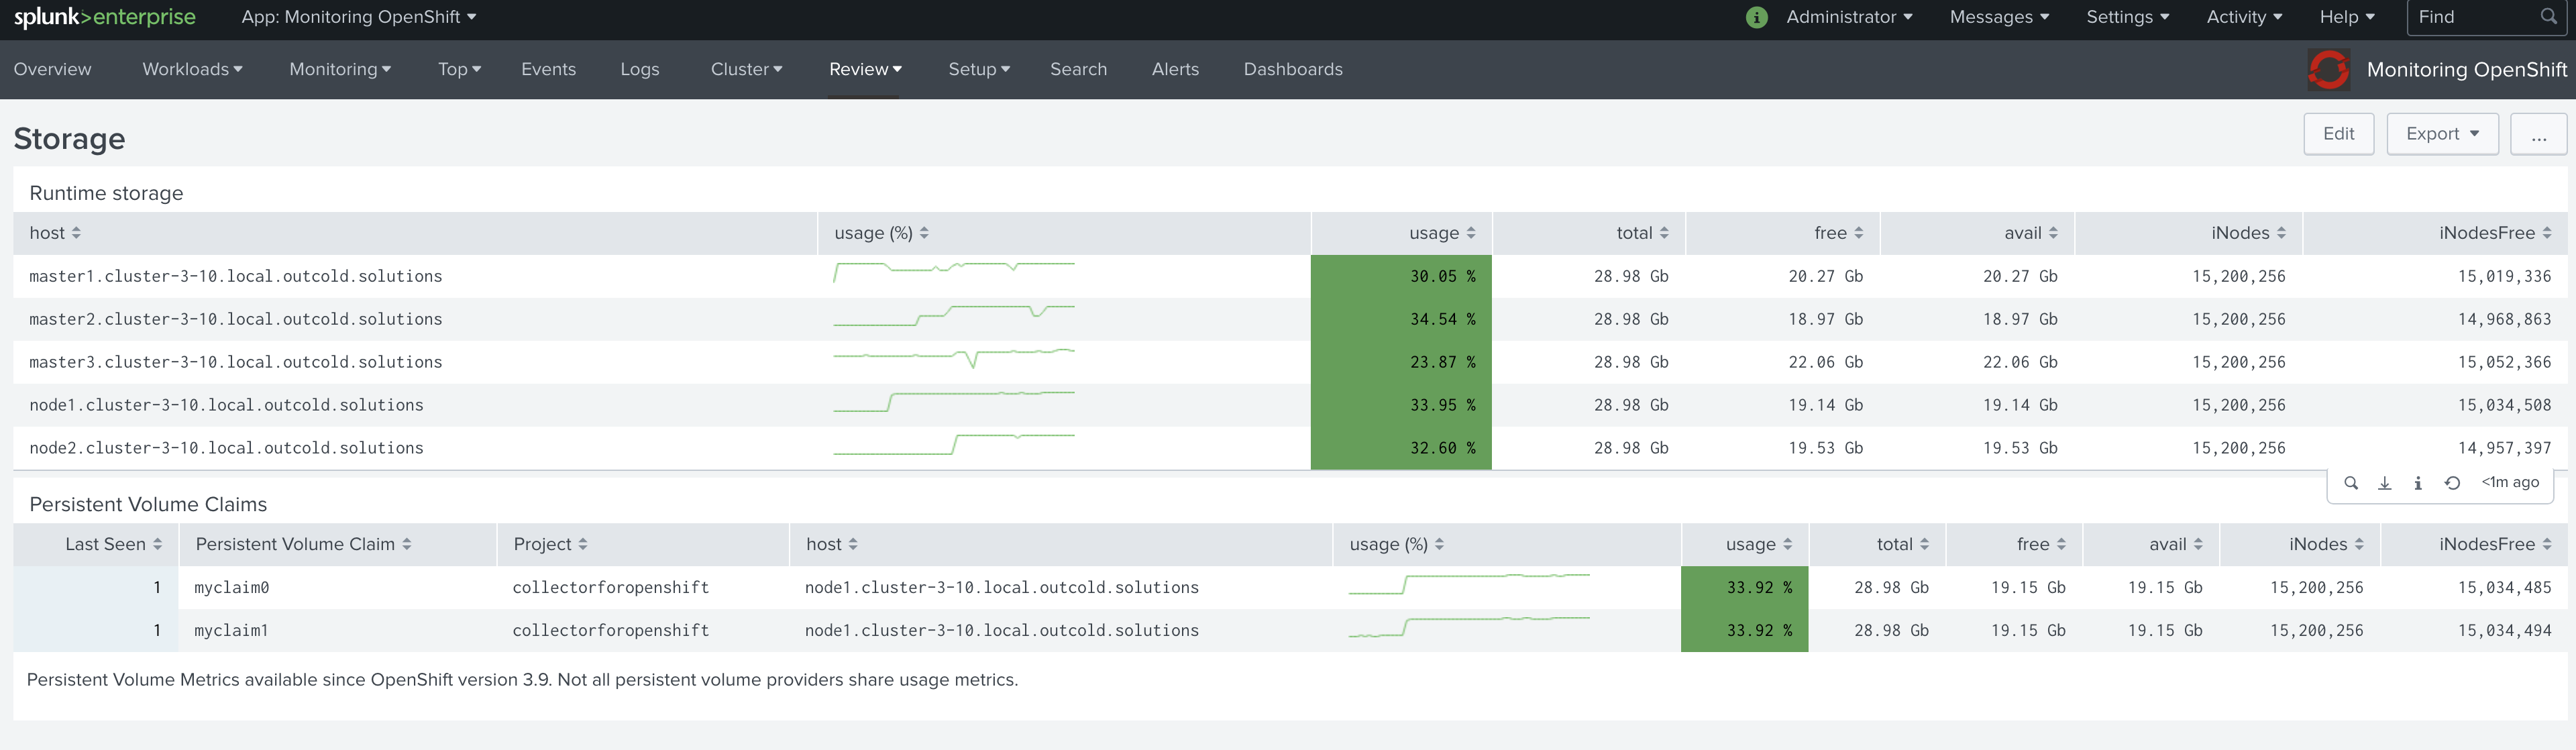
Storage Dashboards
Under Review you will find a new dashboard Storage that will show you information about used storage on the disk,
where you are running your runtime (which will be docker, or kubelet in case of Monitoring Kubernetes and OpenShift
applications).
Monitoring OpenShift and Kubernetes applications will show you information for Persistent Volume Claims as well.
These metrics are provided by metrics exported from the kubelet. These metrics are available since Kubernetes 1.8 and
OpenShift 3.9. Not all of the Persistent Volume providers support these metrics, but the majority does.
Alerts
We have added 26 alerts for Monitoring OpenShift and Kubernetes applications, and 4 alerts for the Monitoring Docker application that will help you to monitor the health of your clusters and performance of your applications.
Please review predefined alerts for every application
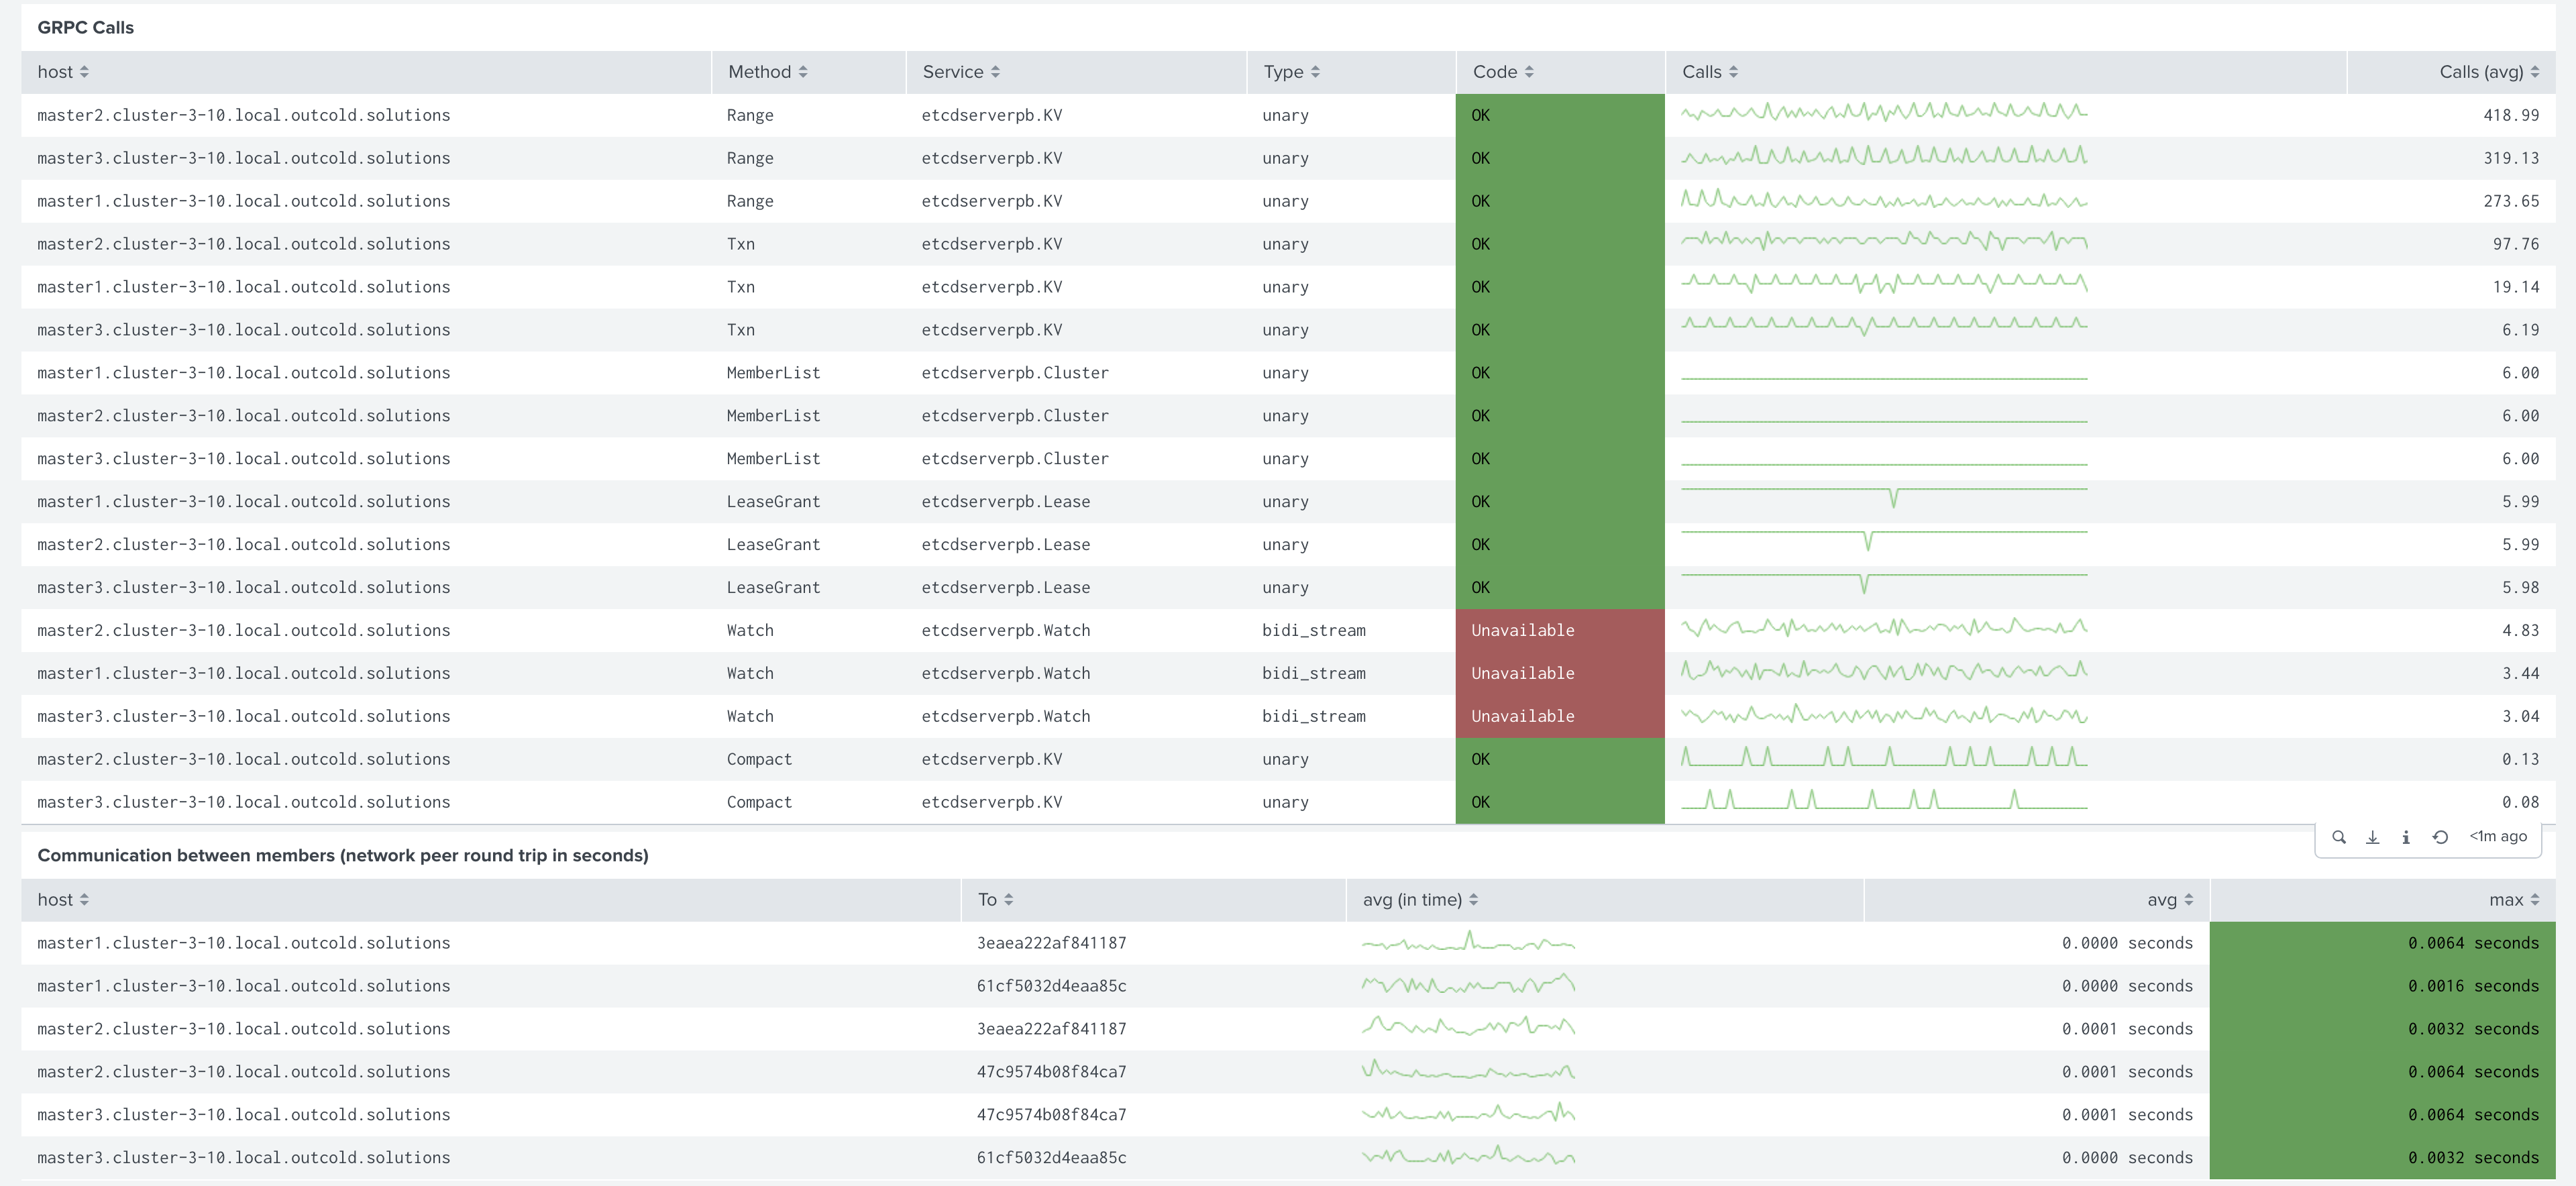
These alerts are especially useful when you are managing your own control plane, as a lot of alerts help you monitor the health of the etcd cluster and communication between control plane components. We updated our control plane dashboards to help you react to these alerts. Below is an example of the etcd dashboard with information about communication between etcd members, and calls to the etcd cluster.
Collectord updates
Verify configuration
We are proud to have a solution that is so easy to install, that does not require almost any changes in your existing infrastructure,
but we still wanted to improve the user experience. So we added a verify command that can help you to test your
existing configuration and tell you when something is wrong
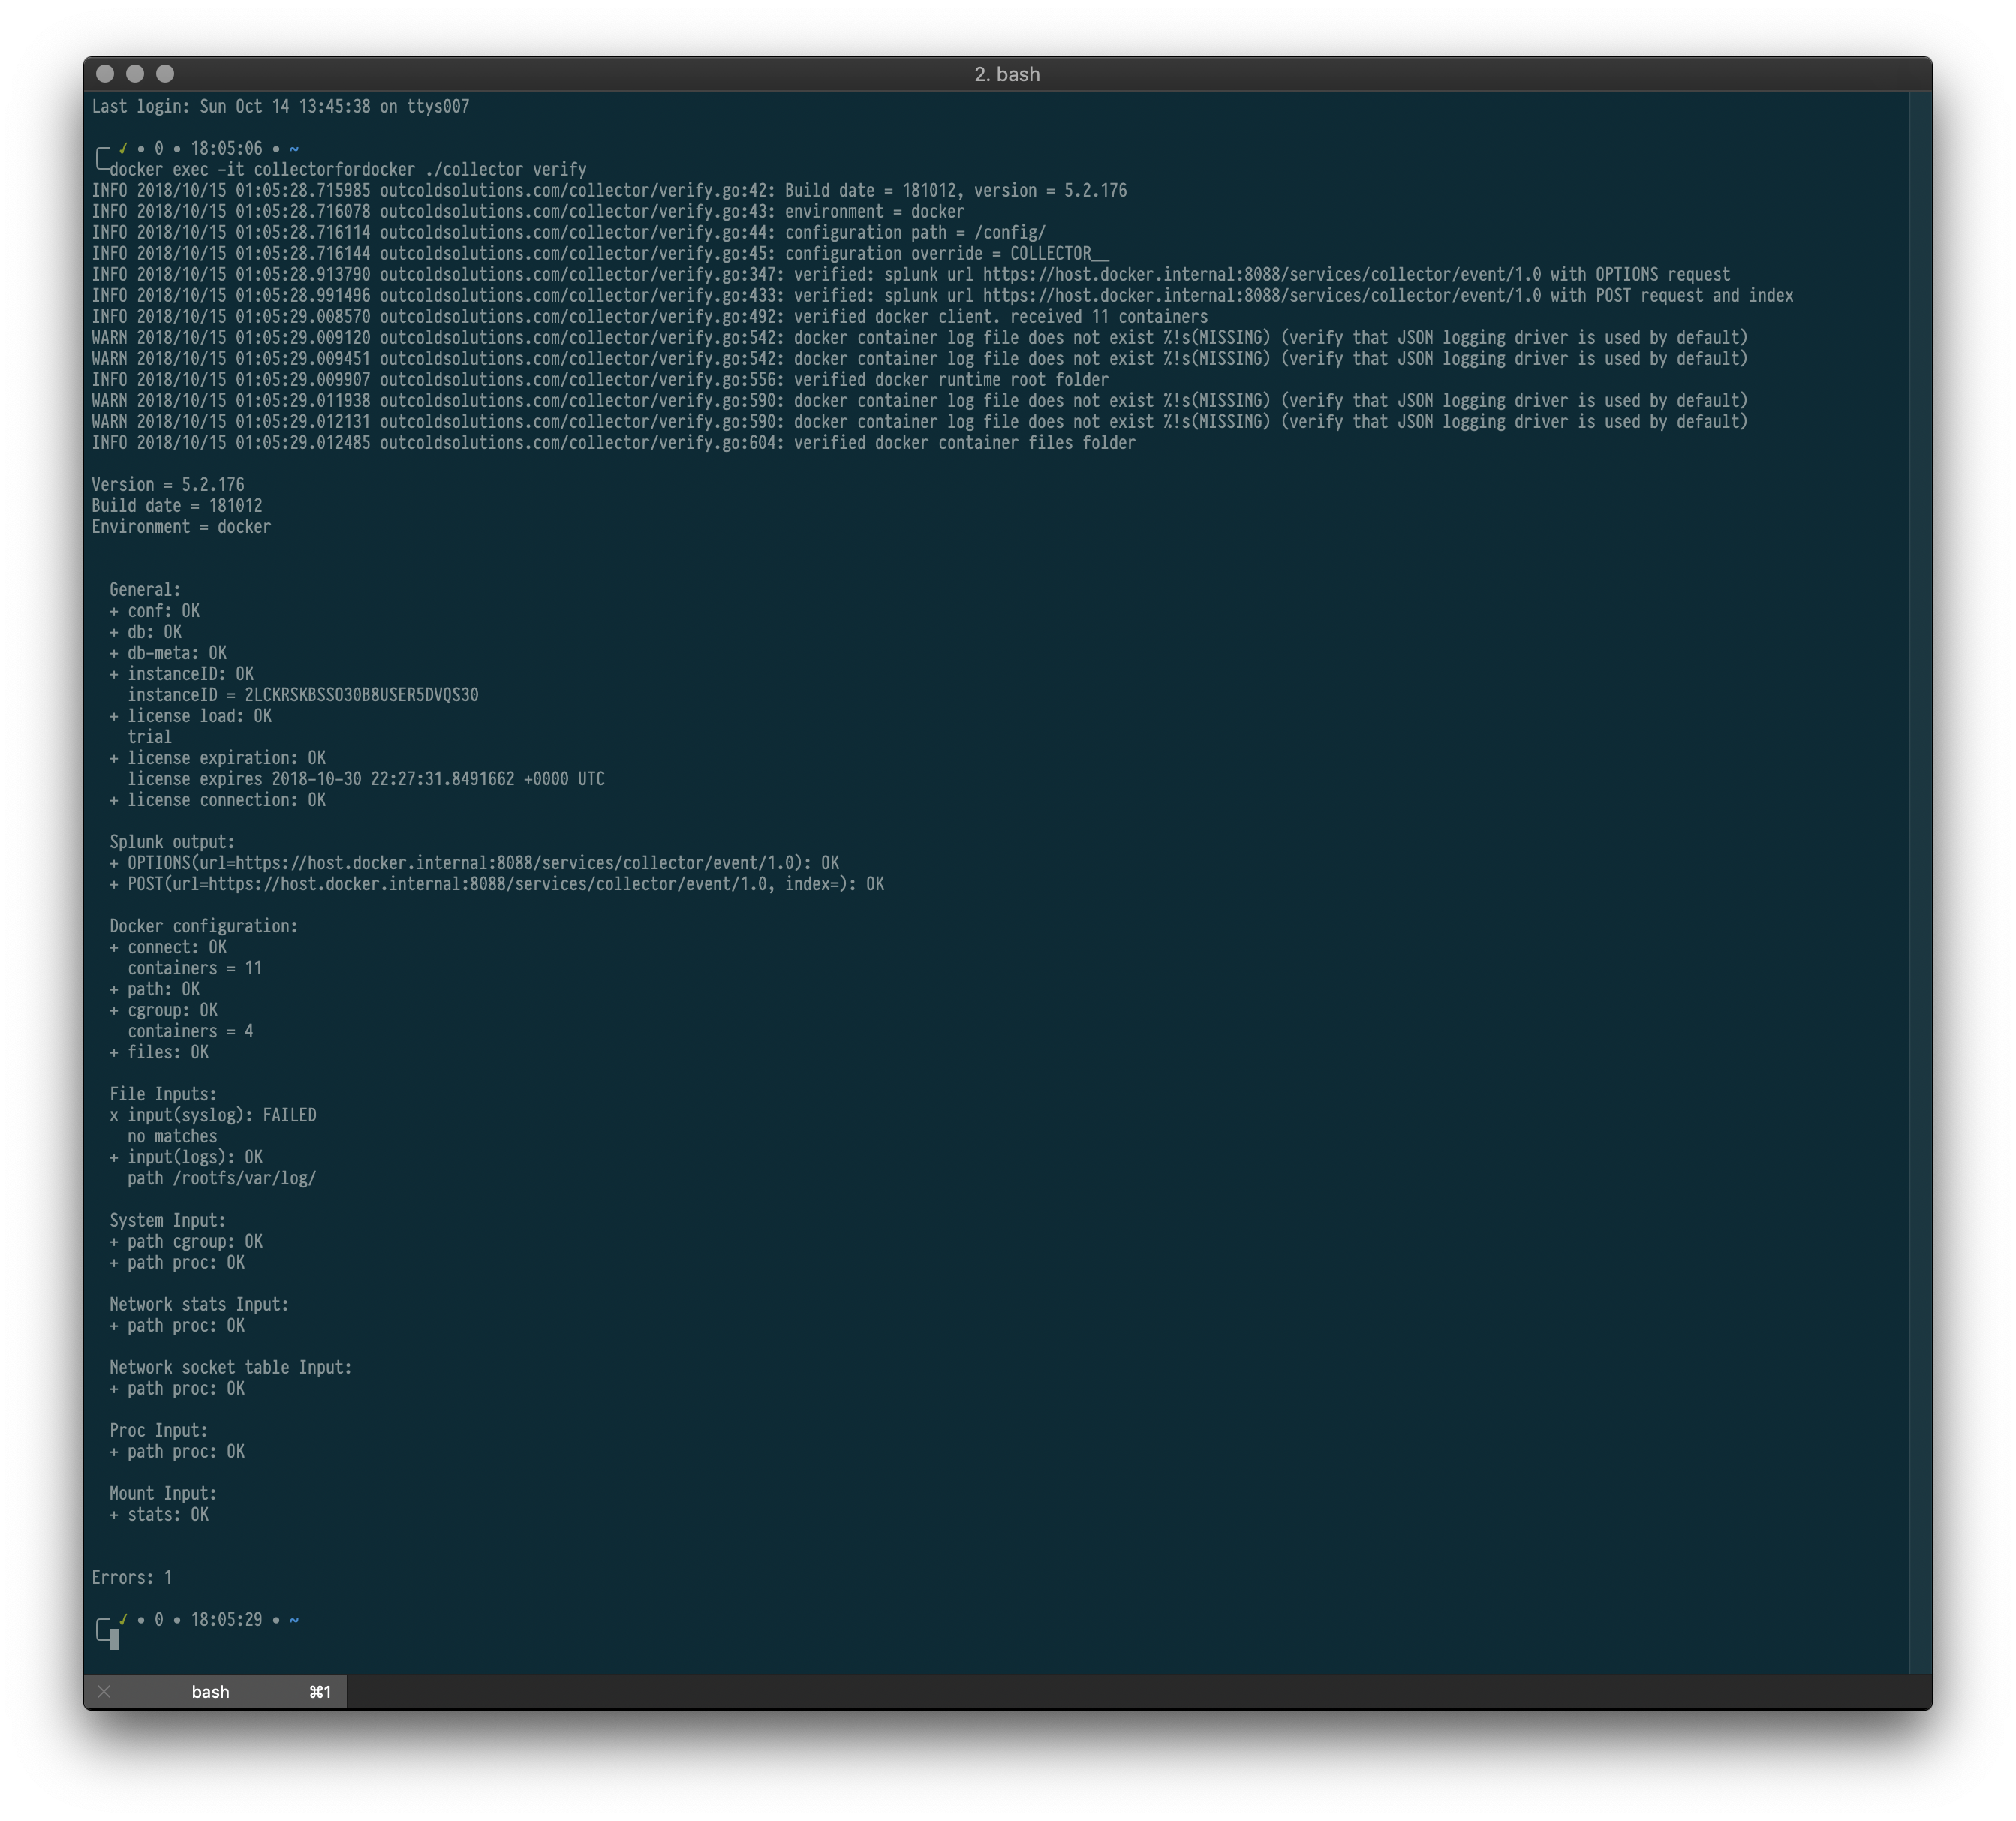
Additionally, we have added a diag command to collect diagnostic information. You can find more information about
how to invoke verify command in every environment
- Monitoring OpenShift v5 - Troubleshooting
- Monitoring Kubernetes v5 - Troubleshooting
- Monitoring Docker v5 - Troubleshooting
Security
The best way to deal with vulnerabilities in the image is not to have any components that can have vulnerabilities. We have
switched our base image from alpine to scratch, which is a 0-size image that does not have anything in it. The images
that we distribute through hub.docker.com/r/outcoldsolutions/ only have
a base configuration, our statically compiled binary, root ca-certificates and timezone database. You cannot run any
shell scripts, install any additional software with package managers or perform any other actions. If you want to
test connectivity to your Splunk instance, you can use verify command.
New annotations
We added the ability to turn on an opt-out option by default for forwarding container logs. That can be useful if you want to
reduce licensing cost or the amount of unnecessary information forwarded to Splunk. For that, we added a second output
devnull, which you can set as a default output for any type of data, including container logs under input.files.
With the annotations collectord.io/logs-output=splunk you will be able to override outputs for specific containers.
- Monitoring OpenShift v5 - Annotations - Change output destination
- Monitoring Kubernetes v5 - Annotations - Change output destination
- Monitoring Docker v5 - Annotations - Change output destination
The second set of annotations is an override annotation that can change the source, type and index of the events that
match specific patterns.
- Monitoring OpenShift v5 - Annotations - Overriding index source and type for specific events
- Monitoring Kubernetes v5 - Annotations - Overriding index source and type for specific events
- Monitoring Docker v5 - Annotations - Overriding index source and type for specific events
Links
You can find more information about other minor updates by following the links below.
Upgrade instructions
Release notes
- Monitoring OpenShift - Release notes
- Monitoring Kubernetes - Release notes
- Monitoring Docker - Release notes


