Blog
Monitoring Docker, OpenShift and Kubernetes - Version 5 (Application Logs and Annotations)
We are happy to announce the 5th version of our applications for Monitoring Docker, OpenShift, and Kubernetes.
First of all, we want to thank our customers! Feedback and close work with our customers help us to build one of the best tools for monitoring container environments.
Now, let us share with you what we worked on this summer.
Application Logs
It is a best practice to forward logs to the standard out and standard error of the container. But that is not always achievable, perhaps because of legacy software, or even if you are trying to containerize something very complicated like a database, and having all the logs in one stream can reduce readability and observability.
Our solutions for monitoring Docker, OpenShift, and Kubernetes offer the simplest way to forward logs
stored inside the container. No need to install any sidecar containers, map host paths, or change the configuration for the collectord.
Just two things: define a volume with local driver (Docker) or emptyDir (Kubernetes/OpenShift), and
tell the collectord the name of this volume.
An example of forwarding application logs from a PostgreSQL container running with Docker.
1docker run -d \
2    --volume psql_data:/var/lib/postgresql/data \
3    --volume psql_logs:/var/log/postgresql/ \
4    --label 'collectord.io/volume.1-logs-name=psql_logs' \
5    postgres:10.4 \
6    docker-entrypoint.sh postgres -c logging_collector=on -c log_min_duration_statement=0 -c log_directory=/var/log/postgresql -c log_min_messages=INFO -c log_rotation_age=1d -c log_rotation_size=10MB
With that, you will get logs from the standard output, standard input, and stored inside the volume psql_logs.

Please read more on the topic:
- Monitoring OpenShift v5 - Annotations - Application Logs
- Monitoring Kubernetes v5 - Annotations - Application Logs
- Monitoring Docker v5 - Annotations - Application Logs
Annotations
We used annotations in our solutions for Monitoring OpenShift and Kubernetes for overriding indexes, sources, source types, and hosts for data we forward with the collectord.
With version 5, we are bringing annotations to Monitoring Docker and also adding more features that can be enabled with annotations.
That includes:
- Extracting fields
- Extracting timestamps
- Hiding sensitive information from the logs
- Redirecting events to
/dev/nullon some pattern - Stripping terminal colors from container logs
- Defining multi-line event patterns
- Defining application logs
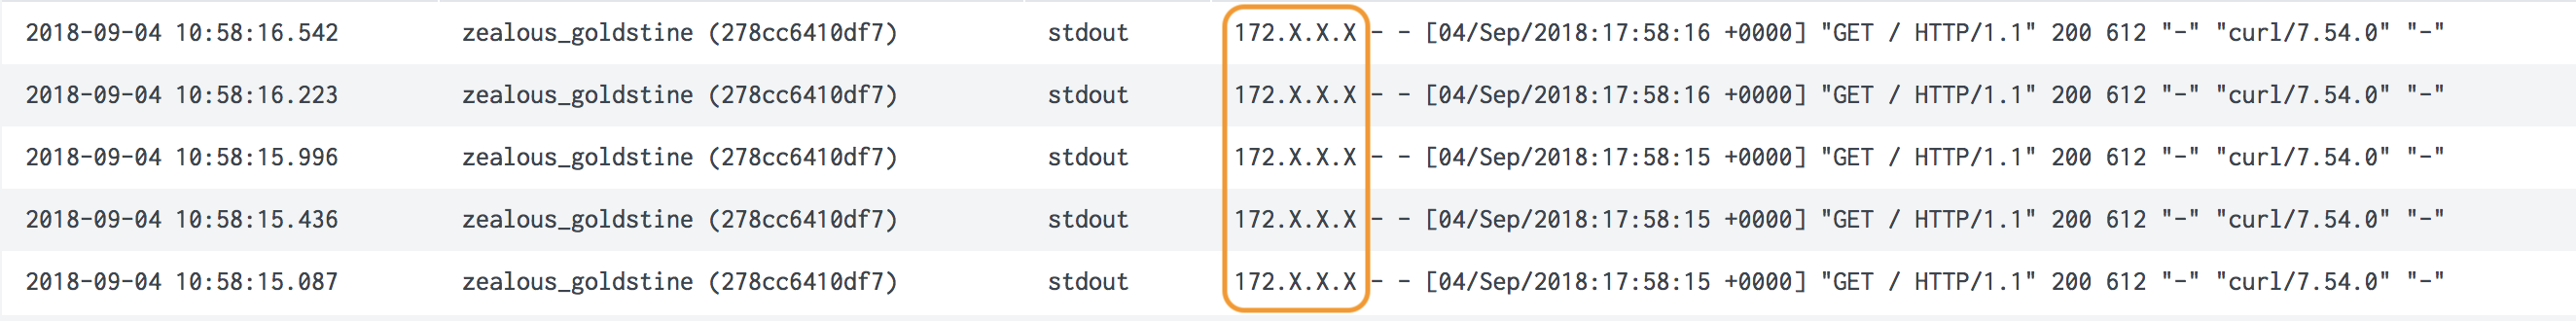
An example: obfuscating all IP addresses in nginx container logs running in Kubernetes
 1apiVersion: v1
 2kind: Pod
 3metadata:
 4  name: nginx-pod
 5  annotations:
 6    collectord.io/logs-replace.1-search: (?P<IPv4p1>\d{1,3})(\.\d{1,3}){3}
 7    collectord.io/logs-replace.1-val: ${IPv4p1}.X.X.X
 8spec:
 9  containers:
10  - name: nginx
11    image: nginx
Instead of IP Addresses
We have a lot of examples in our documentation.
- Monitoring OpenShift v5 - Annotations
- Monitoring Kubernetes v5 - Annotations
- Monitoring Docker v5 - Annotations
Splunk Output
There are two significant improvements for configuring HTTP Event Collector with the collectord. You can define multiple endpoints, which allows collectord to load balance forwarding between numerous Splunk HTTP Event Collectors if you don’t have a Load Balancer in front of them. Or you can use it for fail-overs if your Load Balancer or DNS fails, so the collector can switch to the next in the list.
The second improvement is handling invalid Indexes with Splunk HTTP Event Collector. We learned that it is a very common issue to misprint an index name or forget to add the index to the list of indexes where HTTP Event Collector can write. The collectord can recognize error messages from the Splunk HTTP Event Collector and decide how to handle this error. With version 5, in case of an error, it redirects all the data to the default index. You can change this behavior. Specify to Drop messages or Block the pipeline. Waiting on the pipeline is similar behavior to the previous version with one exception. Previously, the whole pipeline could be blocked. Now only data to this index will be blocked, process stats and events. Pod, Container stats, and logs are not affected by the blockage.
You can read more about the configurations for Splunk Output with examples in our documentation.
- Monitoring OpenShift v5 - Configurations for Splunk HTTP Event Collector
- Monitoring Kubernetes v5 - Configurations for Splunk HTTP Event Collector
- Monitoring Docker v5 - Configurations for Splunk HTTP Event Collector
Installation and Upgrade
As always, this upgrade is available for free for all our customers. And you can try it for free with the embedded trial license.
Release notes:
- Monitoring OpenShift - Release notes
- Monitoring Kubernetes - Release notes
- Monitoring Docker - Release notes
Installation instructions:
- Monitoring OpenShift - Installation
- Monitoring Kubernetes - Installation
- Monitoring Docker - Installation
Upgrade instructions:


