Blog
Using Splunk fields extractor to extract fields from container logs
Getting logs and metrics in your Splunk cluster is just the first step to managing your logs. The next step is to build your own custom dashboard to be able to explore the data you forward to Splunk.
The collectord has a special format for sources that it forwards from container logs. We on purpose decided to replace it
from unused and non-interesting /var/lib/docker/containers/{container_id}/{container_id}-logs.json to something that
we can leverage with Splunk. So instead we are sending logs with the format that includes container name, image name and
more, depends on used orchestration. You can find the format definition in
Docker,
Kubernetes and
OpenShift documentation.
With the following example, we show how you can leverage this knowledge to extract fields from your container logs and start building custom dashboards. We use Monitoring OpenShift as an example, but you can apply this to any of our applications.
First, you need to find the logs and define the source rule. Using wildcards, you can cover multiple sources, like all containers that were created from a specific image, as in the example below

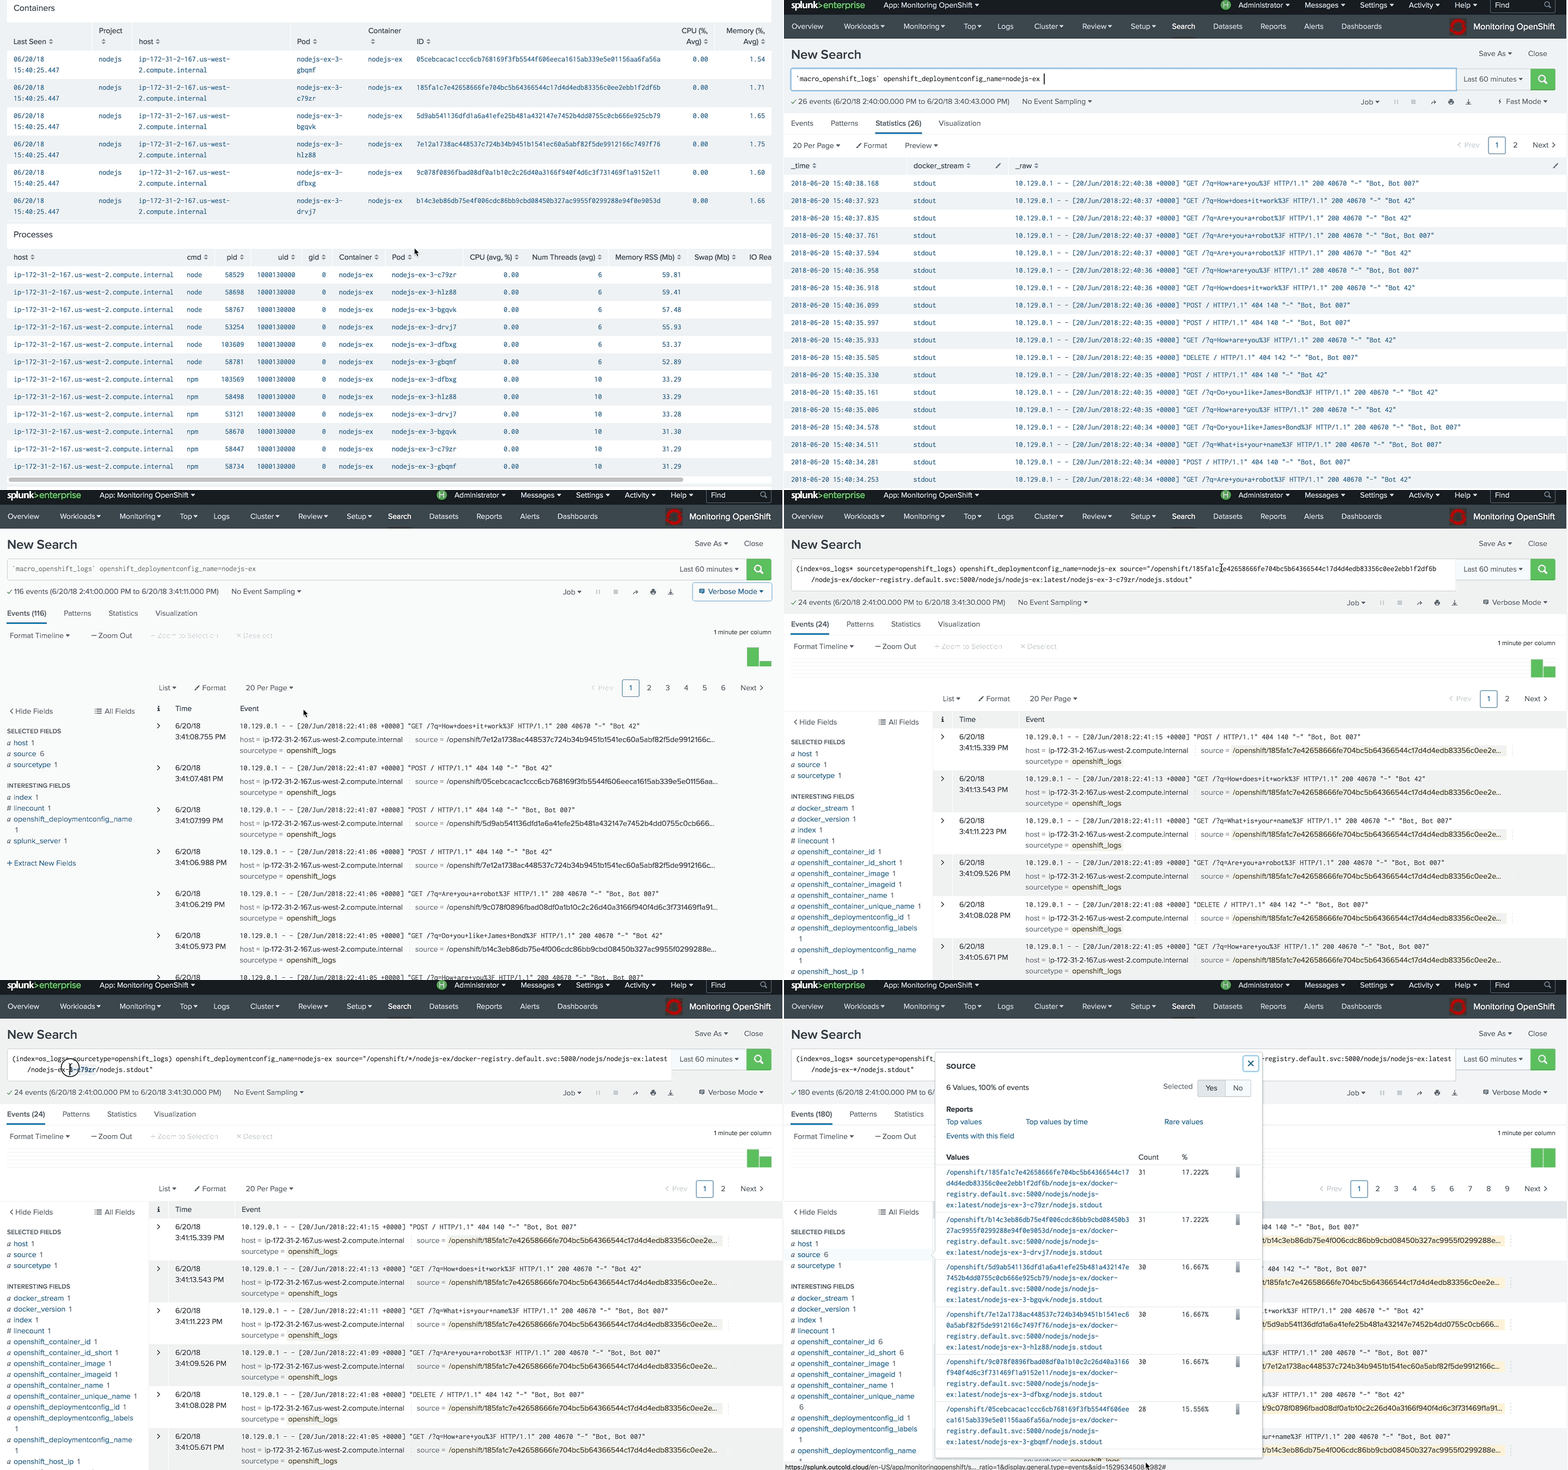
In our deployment, we have 6 pods with similar sources.
1/openshift/5d9ab541136dfd1a6a41efe25b481a432147e7452b4dd0755c0cb666e925cb79/nodejs-ex/docker-registry.default.svc:5000/nodejs/nodejs-ex:latest/nodejs-ex-3-bgqvk/nodejs.stdout
2/openshift/9c078f0896fbad08df0a1b10c2c26d40a3166f940f4d6c3f731469f1a9152e11/nodejs-ex/docker-registry.default.svc:5000/nodejs/nodejs-ex:latest/nodejs-ex-3-dfbxg/nodejs.stdout
3/openshift/05cebcacac1ccc6cb768169f3fb5544f606eeca1615ab339e5e01156aa6fa56a/nodejs-ex/docker-registry.default.svc:5000/nodejs/nodejs-ex:latest/nodejs-ex-3-gbqmf/nodejs.stdout
4/openshift/185fa1c7e42658666fe704bc5b64366544c17d4d4edb83356c0ee2ebb1f2df6b/nodejs-ex/docker-registry.default.svc:5000/nodejs/nodejs-ex:latest/nodejs-ex-3-c79zr/nodejs.stdout
5/openshift/7e12a1738ac448537c724b34b9451b1541ec60a5abf82f5de9912166c7497f76/nodejs-ex/docker-registry.default.svc:5000/nodejs/nodejs-ex:latest/nodejs-ex-3-hlz88/nodejs.stdout
6/openshift/b14c3eb86db75e4f006cdc86bb9cbd08450b327ac9955f0299288e94f0e9053d/nodejs-ex/docker-registry.default.svc:5000/nodejs/nodejs-ex:latest/nodejs-ex-3-drvj7/nodejs.stdout
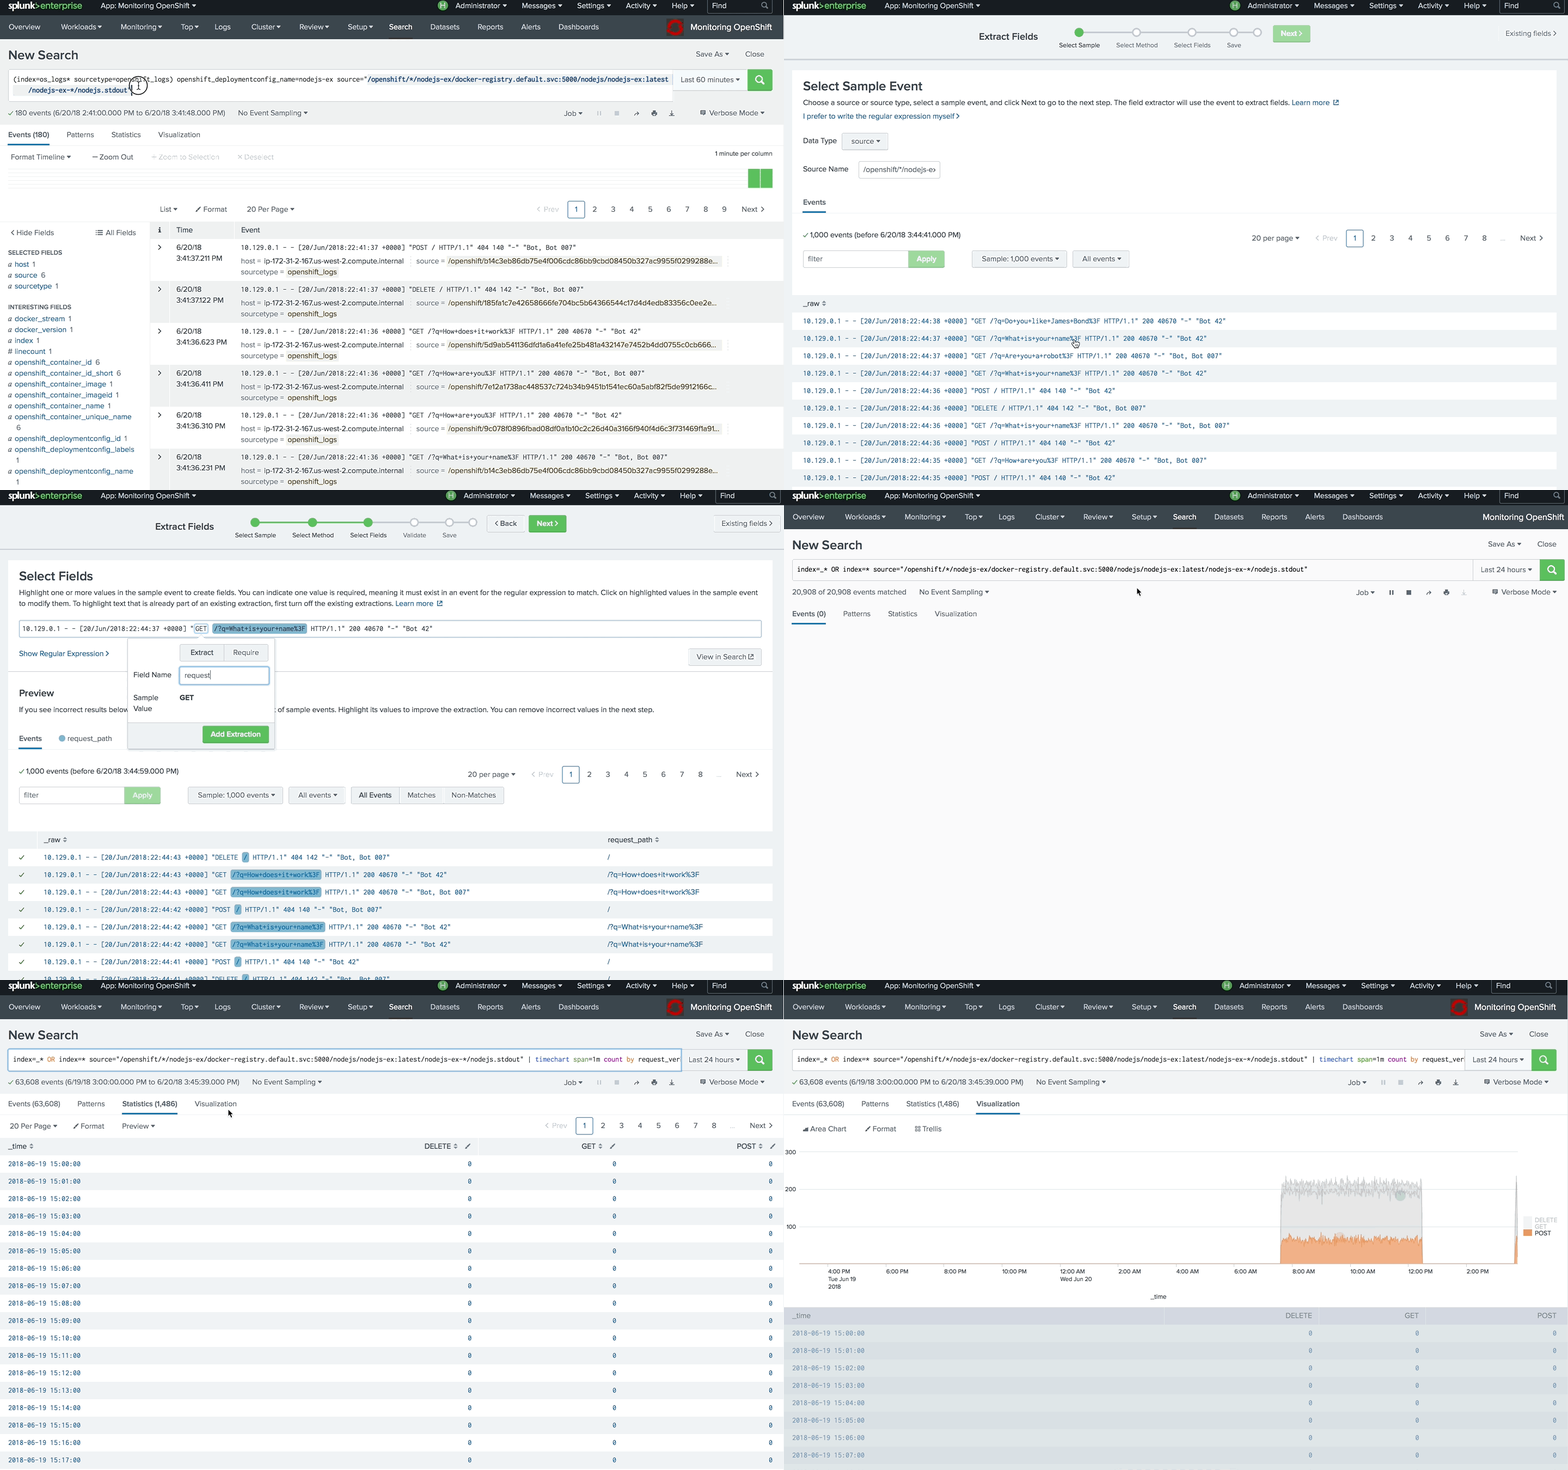
Based on the format for OpenShift container logs, we can define the source by applying wildcards to the container id and pod suffix.
1/openshift/*/nodejs-ex/docker-registry.default.svc:5000/nodejs/nodejs-ex:latest/nodejs-ex*/nodejs.stdoutUsing this pattern, we can define field extraction in Splunk. For that, go to Settings, Fields, Field extractions and choose Open Field Extractor. Change the data type to source and paste the source defined above. Verify that you can see all the logs that you expect and define field extraction by following the wizard.

With this simple approach, you can easily extract fields from container logs and start building custom dashboards.


