Blog
Monitoring OpenShift and Kubernetes - Version 4 (Audit Logs and Prometheus metrics)
At Red Hat Summit 2018, we presented our next version of the application Monitoring OpenShift in Splunk. We are happy to announce the GA of Version 4 of Monitoring OpenShift and Kubernetes. These applications are now certified by Splunk, and they are available on SplunkBase.
Version 4 brings two significant features: Audit logs and control plane monitoring (etcd clusters, Kubelets, controllers, and API servers).
Our solutions are now the most complete suites for monitoring Kubernetes clusters, allowing developers to monitor their applications and operators to monitor the health of their clusters. With the power of Splunk, application developers can build more complex dashboards specific to their applications. And operators can diagnose the health of their clusters.
Installation instructions
Upgrade instructions
Overview
The most notable new features are Audit Logs and Prometheus metrics, but there are many small usability improvements and significant performance improvements.
Audit Logs
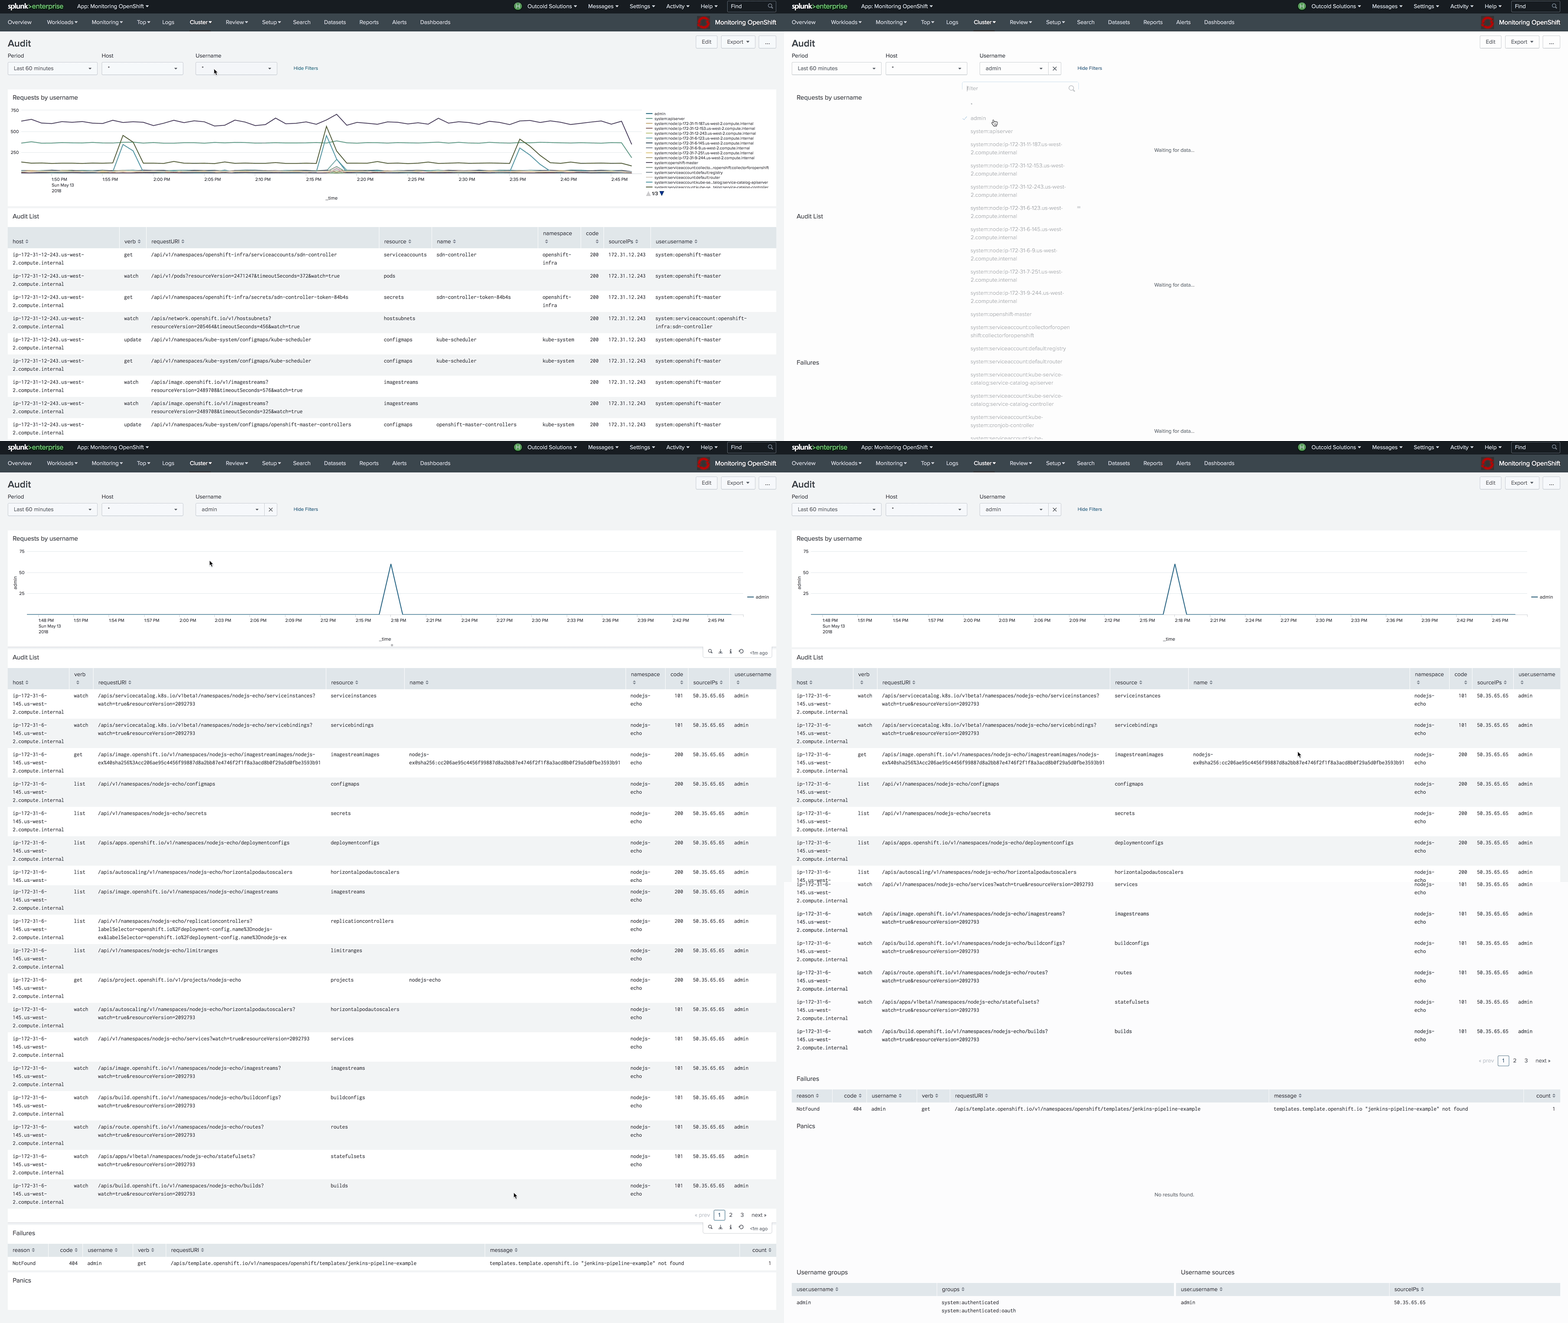
By enabling advanced Audit Logs in Kubernetes or OpenShift, you will be able to use our dashboard, which will help you answer questions about when and who modified specified objects, who has access to view them, and from where.

To learn more about how to enable advanced audit logs, follow these links
Control plane monitoring
Version 4 of our collectord brings the capability of forwarding metrics from Prometheus format directly to Splunk. This allows us to monitor the control plane, including etcd clusters, Kubelets, API Servers, and controllers.
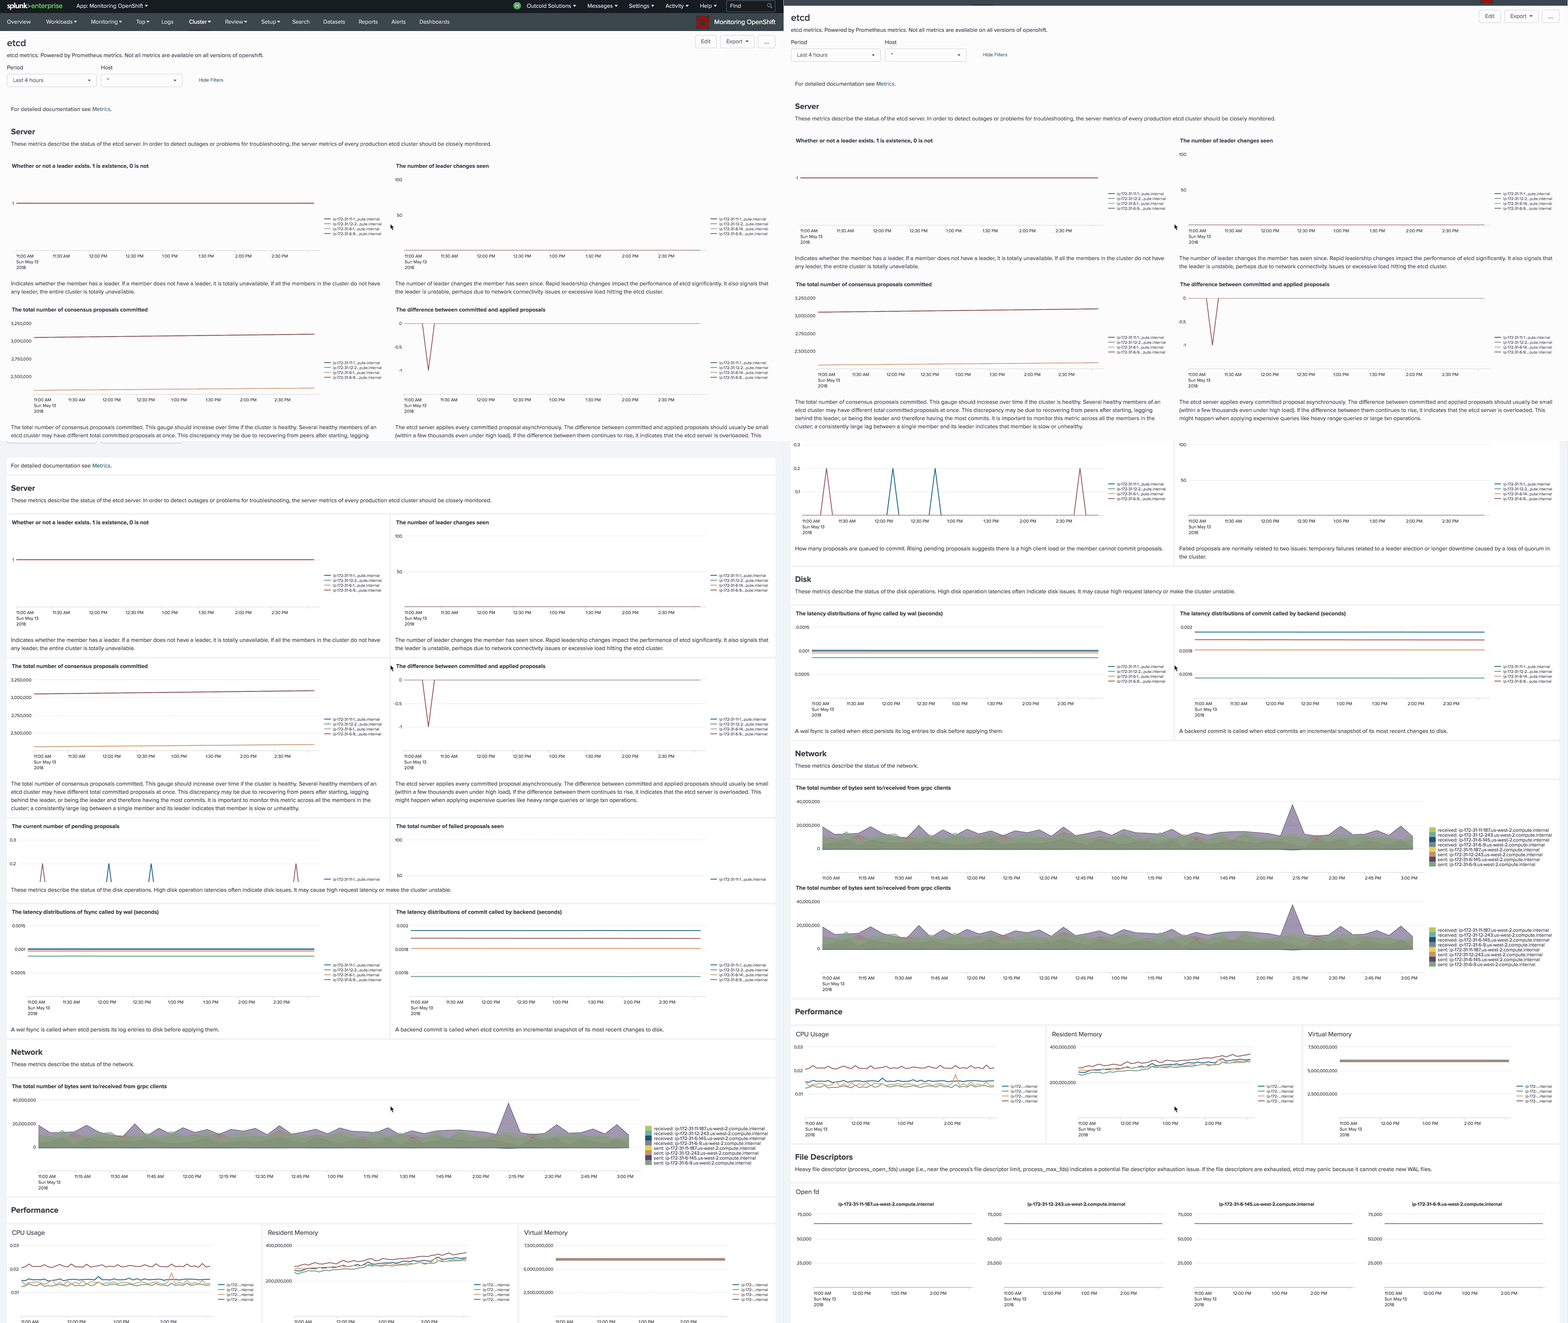
Example of the dashboard for monitoring an etcd cluster in Monitoring OpenShift

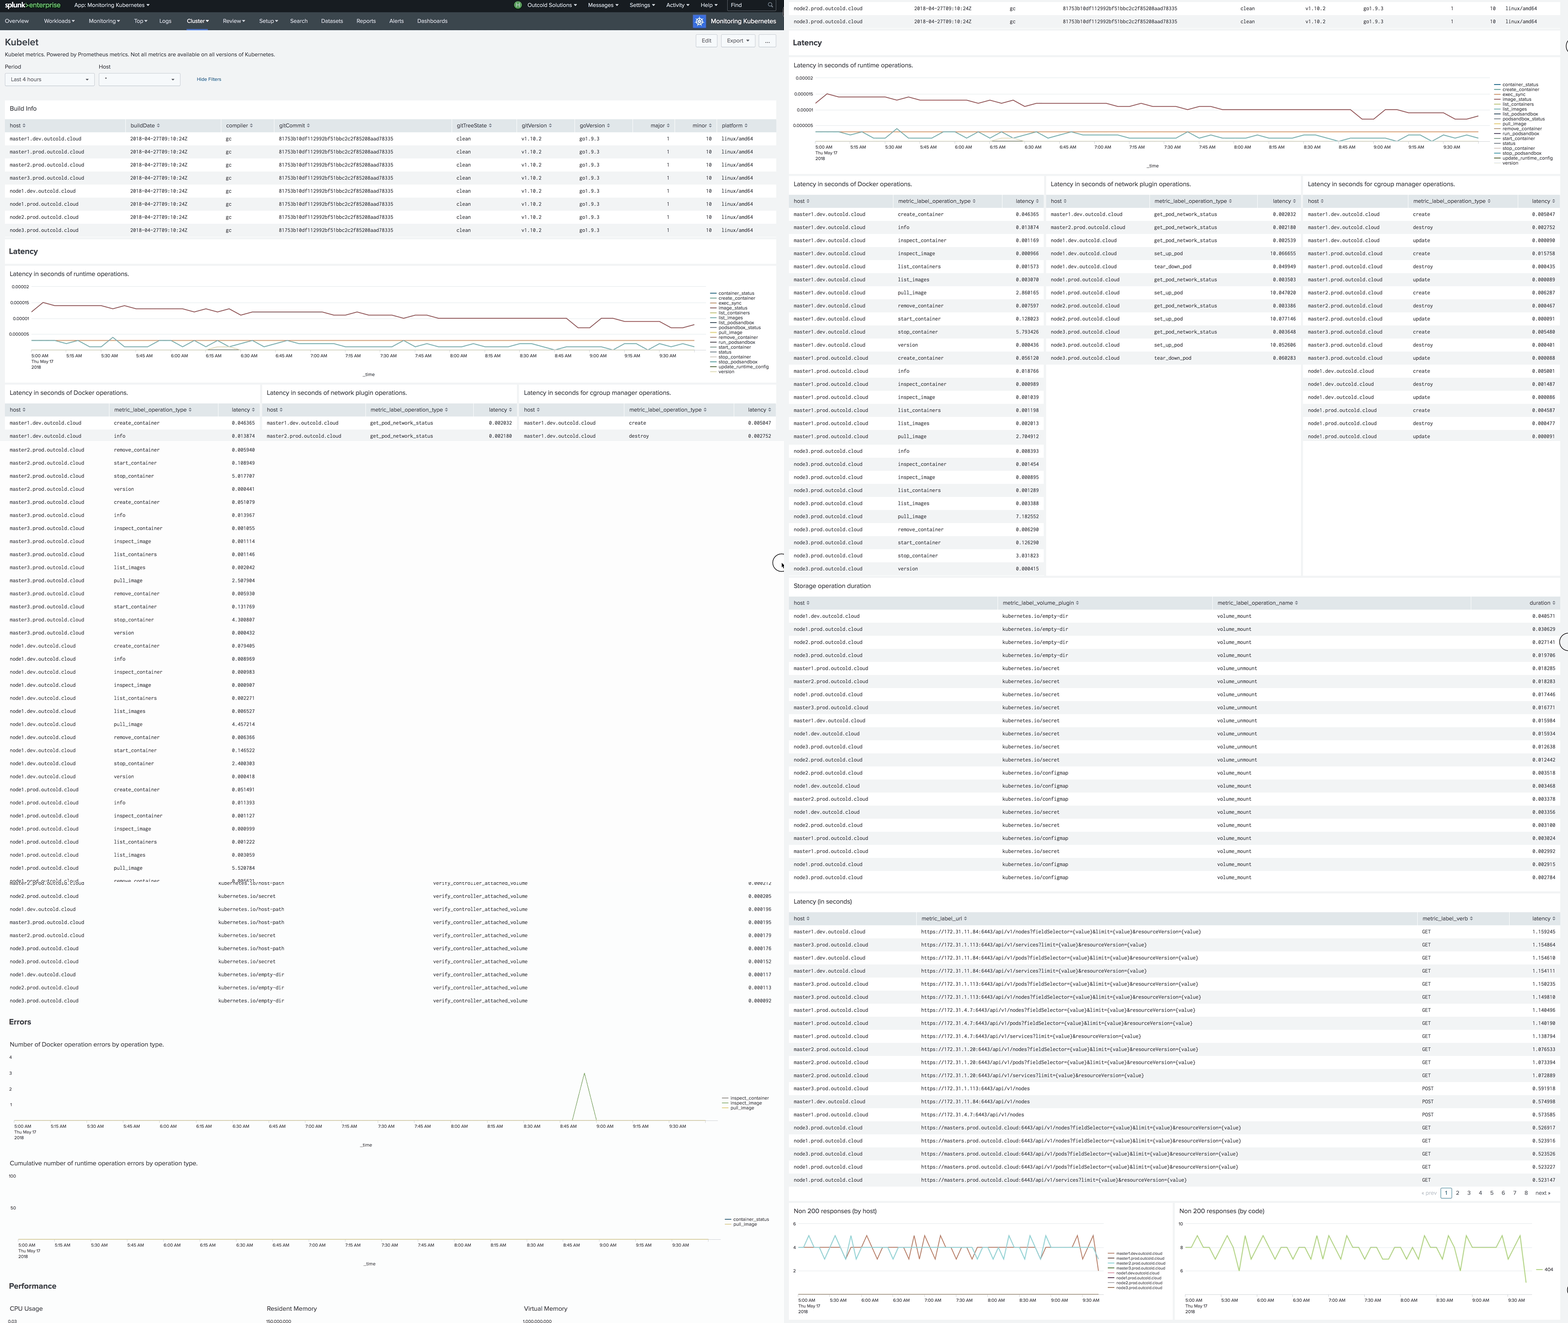
Example of the dashboard for monitoring Kubelets in Monitoring Kubernetes

To learn more about how to enable Prometheus metrics, follow these links


